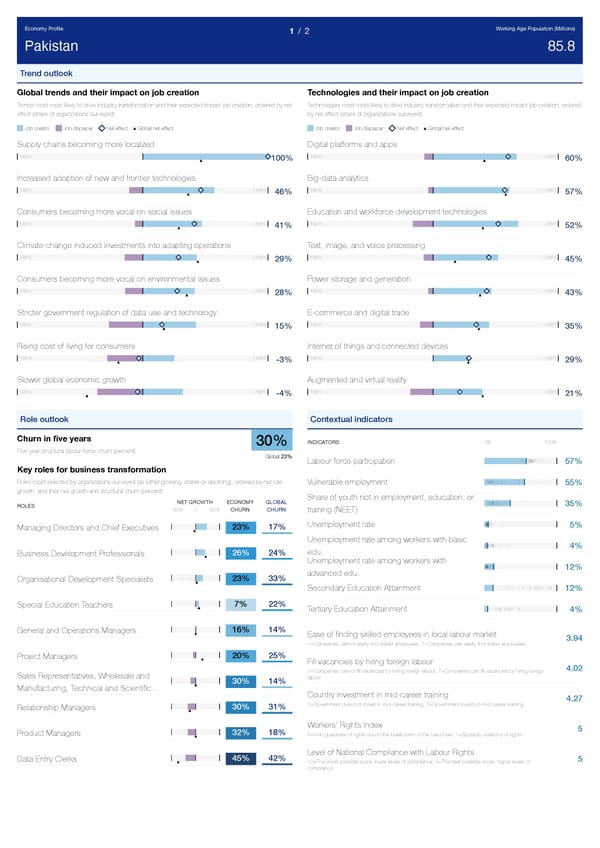
Economy Profile Working Age Population (Millions) 1 / 2 Pakistan 85.8 Trend outlook Global trends and their impact on job creation Technologies and their impact on job creation Trends most most likely to drive industry transformation and their expected impact job creation, ordered by net Technologies most most likely to drive industry transformation and their expected impact job creation, ordered effect (share of organizations surveyed) by net effect (share of organizations surveyed) Job creator Job displacer Net effect Global net effect Job creator Job displacer Net effect Global net effect Supply chains becoming more localized Digital platforms and apps -100% +100% -100% +100% 100% 60% Increased adoption of new and frontier technologies Big-data analytics -100% +100% -100% +100% 46% 57% Consumers becoming more vocal on social issues Education and workforce development technologies -100% +100% -100% +100% 41% 52% Climate-change induced investments into adapting operations Text, image, and voice processing -100% +100% -100% +100% 29% 45% Consumers becoming more vocal on environmental issues Power storage and generation -100% +100% -100% +100% 28% 43% Stricter government regulation of data use and technology E-commerce and digital trade -100% +100% -100% +100% 15% 35% Rising cost of living for consumers Internet of things and connected devices -100% +100% -100% +100% -3% 29% Slower global economic growth Augmented and virtual reality -100% +100% -100% +100% -4% 21% Role outlook Contextual indicators Churn in five years INDICATORS 0% 100% 30% Five-year structural labour-force churn (percent) Global 23% Labour force participation 57% Key roles for business transformation Roles most selected by organizations surveyed (as either growing, stable or declining), ordered by net role Vulnerable employment 55% growth, and their net growth and structural churn (percent) Share of youth not in employment, education, or NET GROWTH ECONOMY GLOBAL 35% ROLES -50% 0 50% CHURN CHURN training (NEET) Unemployment rate 5% 23% 17% Managing Directors and Chief Executives Unemployment rate among workers with basic 4% edu. 26% 24% Business Development Professionals Unemployment rate among workers with 12% advanced edu. 23% 33% Organisational Development Specialists Secondary Education Attainment 12% 7% 22% Special Education Teachers Tertiary Education Attainment 4% 16% 14% General and Operations Managers Ease of finding skilled employees in local labour market 3.94 1=Companies cannot easily find skilled employees, 7=Companies can easily find skilled employees 20% 25% Project Managers Fill vacancies by hiring foreign labour 4.02 1=Companies cannot fill vacancies by hiring foreign labour, 7=Companies can fill vacancies by hiring foreign Sales Representatives, Wholesale and labour 30% 14% … Manufacturing, Technical and Scientific Country investment in mid-career training 4.27 1=Government does not invest in mid-career training, 7=Government invests in mid-career training 30% 31% Relationship Managers Workers' Rights Index 5 32% 18% Product Managers 5+=No guarantee of rights due to the breakdown of the rule of law, 1=Sporadic violations of rights Level of National Compliance with Labour Rights 45% 42% Data Entry Clerks 5 10=The worst possible score, lower levels of compliance, 0=The best possible score, higher levels of compliance
 The Future of Jobs Report 2023 Page 147 Page 149