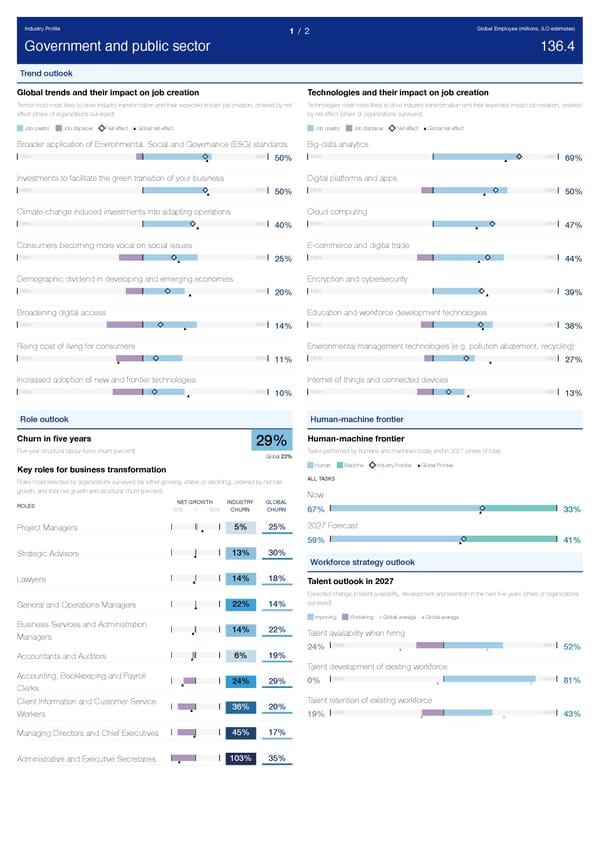
Industry Profile Global Employee (millions, ILO estimates) 1 / 2 Government and public sector 136.4 Trend outlook Global trends and their impact on job creation Technologies and their impact on job creation Trends most most likely to drive industry transformation and their expected impact job creation, ordered by net Technologies most most likely to drive industry transformation and their expected impact job creation, ordered effect (share of organizations surveyed) by net effect (share of organizations surveyed) Job creator Job displacer Net effect Global net effect Job creator Job displacer Net effect Global net effect Broader application of Environmental, Social and Governance (ESG) standards Big-data analytics -100% +100% -100% +100% 50% 69% Investments to facilitate the green transition of your business Digital platforms and apps -100% +100% -100% +100% 50% 50% Climate-change induced investments into adapting operations Cloud computing -100% +100% -100% +100% 40% 47% Consumers becoming more vocal on social issues E-commerce and digital trade -100% +100% -100% +100% 25% 44% Demographic dividend in developing and emerging economies Encryption and cybersecurity -100% +100% -100% +100% 20% 39% Broadening digital access Education and workforce development technologies -100% +100% -100% +100% 14% 38% Rising cost of living for consumers Environmental management technologies (e.g. pollution abatement, recycling) -100% +100% -100% +100% 11% 27% Increased adoption of new and frontier technologies Internet of things and connected devices -100% +100% -100% +100% 10% 13% Role outlook Human-machine frontier Churn in five years Human-machine frontier 29% Five-year structural labour-force churn (percent) Tasks performed by humans and machines today and in 2027 (share of total) Global 23% Human Machine Industry Frontier Global Frontier Key roles for business transformation ALL TASKS Roles most selected by organizations surveyed (as either growing, stable or declining), ordered by net role growth, and their net growth and structural churn (percent) Now NET GROWTH INDUSTRY GLOBAL ROLES -50% 0 50% CHURN CHURN 67% 33% 2027 Forecast 5% 25% Project Managers 59% 41% 13% 30% Strategic Advisors Workforce strategy outlook 14% 18% Lawyers Talent outlook in 2027 Expected change in talent availability, development and retention in the next five years (share of organizations surveyed) 22% 14% General and Operations Managers Improving Worsening Global average Global average Business Services and Administration 14% 22% Talent availability when hiring Managers -100% +100% 24% 52% 6% 19% Accountants and Auditors Talent development of existing workforce Accounting, Bookkeeping and Payroll -100% +100% 0% 81% 24% 29% Clerks Talent retention of existing workforce Client Information and Customer Service 36% 20% -100% +100% Workers 19% 43% 45% 17% Managing Directors and Chief Executives 103% 35% Administrative and Executive Secretaries
 The Future of Jobs Report 2023 Page 208 Page 210