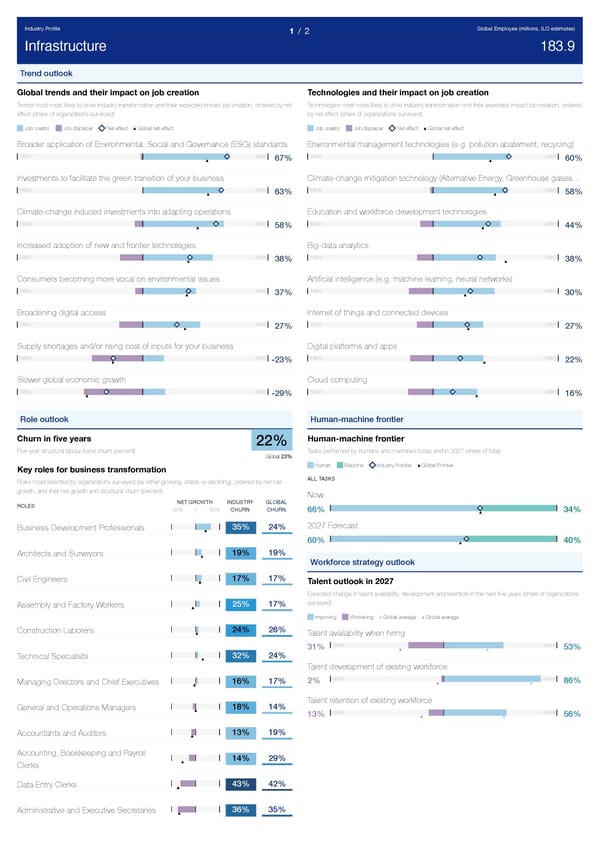
Industry Profile Global Employee (millions, ILO estimates) 1 / 2 Infrastructure 183.9 Trend outlook Global trends and their impact on job creation Technologies and their impact on job creation Trends most most likely to drive industry transformation and their expected impact job creation, ordered by net Technologies most most likely to drive industry transformation and their expected impact job creation, ordered effect (share of organizations surveyed) by net effect (share of organizations surveyed) Job creator Job displacer Net effect Global net effect Job creator Job displacer Net effect Global net effect Broader application of Environmental, Social and Governance (ESG) standards Environmental management technologies (e.g. pollution abatement, recycling) -100% +100% -100% +100% 67% 60% Investments to facilitate the green transition of your business Climate-change mitigation technology (Alternative Energy, Greenhouse gases … -100% +100% -100% +100% 63% 58% Climate-change induced investments into adapting operations Education and workforce development technologies -100% +100% -100% +100% 58% 44% Increased adoption of new and frontier technologies Big-data analytics -100% +100% -100% +100% 38% 38% Consumers becoming more vocal on environmental issues Artificial intelligence (e.g. machine learning, neural networks) -100% +100% -100% +100% 37% 30% Broadening digital access Internet of things and connected devices -100% +100% -100% +100% 27% 27% Supply shortages and/or rising cost of inputs for your business Digital platforms and apps -100% +100% -100% +100% -23% 22% Slower global economic growth Cloud computing -100% +100% -100% +100% -29% 16% Role outlook Human-machine frontier Churn in five years Human-machine frontier 22% Five-year structural labour-force churn (percent) Tasks performed by humans and machines today and in 2027 (share of total) Global 23% Human Machine Industry Frontier Global Frontier Key roles for business transformation ALL TASKS Roles most selected by organizations surveyed (as either growing, stable or declining), ordered by net role growth, and their net growth and structural churn (percent) Now NET GROWTH INDUSTRY GLOBAL ROLES -50% 0 50% CHURN CHURN 66% 34% 2027 Forecast 35% 24% Business Development Professionals 60% 40% 19% 19% Architects and Surveyors Workforce strategy outlook 17% 17% Civil Engineers Talent outlook in 2027 Expected change in talent availability, development and retention in the next five years (share of organizations surveyed) 25% 17% Assembly and Factory Workers Improving Worsening Global average Global average 24% 26% Construction Laborers Talent availability when hiring -100% +100% 31% 53% 32% 24% Technical Specialists Talent development of existing workforce -100% +100% 2% 86% 16% 17% Managing Directors and Chief Executives Talent retention of existing workforce 18% 14% General and Operations Managers -100% +100% 13% 56% 13% 19% Accountants and Auditors Accounting, Bookkeeping and Payroll 14% 29% Clerks 43% 42% Data Entry Clerks 36% 35% Administrative and Executive Secretaries
 The Future of Jobs Report 2023 Page 212 Page 214