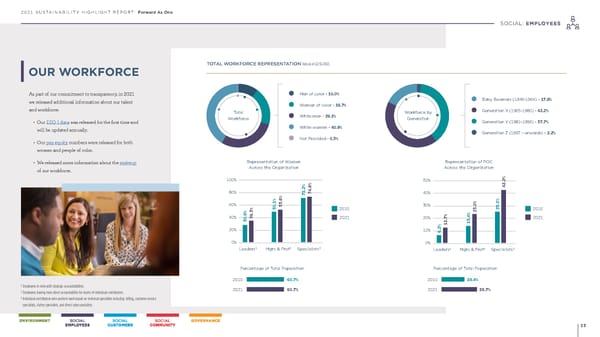
2021 SUSTAINABILITY HIGHLIGHT REPORT: Forward As One 15 SOCIAL: EMPLOYEES As part of our commitment to transparency, in 2021 we released additional information about our talent and workforce: • Our EEO-1 data was released for the first time and will be updated annually • Our pay equity numbers were released for both women and people of color • We released more information about the makeup of our workforce TOTAL WORKFORCE REPRESENTATION Data as of 12/31/2021 Baby Boomers (1946-1964) - 17.8% Generation X (1965-1980) - 42.2% Generation Y (1981-1996) - 37.7% Generation Z (1997 - onwards) - 2.2% Men of color - 10.0% Women of color - 19.7% White men - 29.1% White women - 40.9% Not Provided - 0.3% Total Workforce Workforce by Generation 60.7% 60.7% 2010 2021 Representation of Women Across the Organization Percentage of Total Population Percentage of Total Population 2010 2021 2010 2010 2021 2021 Leaders 1 Mgrs & Prof 2 Specialists 3 100% 80% 60% 40% 20% 0% 30.9% 36.3% 50.1% 71.2% 53.6% 74.8% Representation of POC Across the Organization Leaders 1 Mgrs & Prof 2 Specialists 3 50% 40% 30% 20% 10% 0% 6.2% 12.7% 13.4% 25.1% 23.0% 42.2% 19.4% 29.7% OUR WORKFORCE 1 Employees in roles with strategic accountabilities. 2 Employees having more direct accountability for teams of individual contributors. 3 Individual contributors who perform work based on technical specialties including: billing, customer service specialists, claims specialists, and direct sales specialists.
 The Hartford Financial Sustainability Report Page 14 Page 16