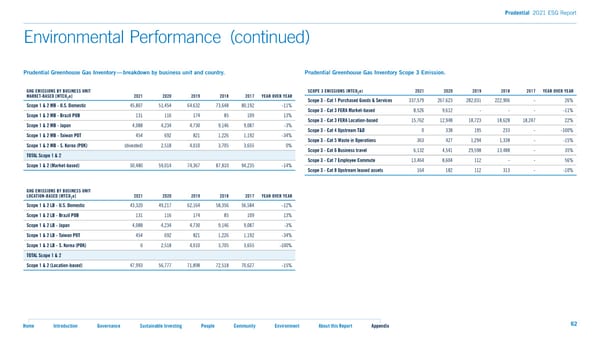
Prudential 2021 ESG Report Environmental Performance (continued) Prudential Greenhouse Gas Inventory — breakdown by business unit and country. Prudential Greenhouse Gas Inventory Scope 3 Emission. GHG EMISSIONS BY BUSINESS UNIT SCOPE 3 EMISSIONS (MTCO e) 2021 2020 2019 2018 2017 YEAR OVER YEAR MARKET-BASED [MTCO e] 2021 2020 2019 2018 2017 YEAR OVER YEAR 2 2 Scope 3 - Cat 1 Purchased Goods & Services 337,579 267,623 282,031 222,906 - 26% Scope 1 & 2 MB - U.S. Domestic 45,807 51,454 64,632 73,648 80,192 -11% Scope 3 - Cat 3 FERA Market-based 8,526 9,612 - - - -11% Scope 1 & 2 MB - Brazil POB 131 116 174 85 109 13% Scope 3 - Cat 3 FERA Location-based 15,762 12,948 18,723 18,628 18,247 22% Scope 1 & 2 MB - Japan 4,088 4,234 4,730 9,146 9,087 -3% Scope 3 - Cat 4 Upstream T&D 0 338 195 233 - -100% Scope 1 & 2 MB - Taiwan POT 454 692 821 1,226 1,192 -34% Scope 3 - Cat 5 Waste in Operations 363 427 1,294 1,338 - -15% Scope 1 & 2 MB - S. Korea (POK) (divested) 2,518 4,010 3,705 3,655 0% Scope 3 - Cat 6 Business travel 6,132 4,541 29,598 13,488 - 35% TOTAL Scope 1 & 2 Scope 3 - Cat 7 Employee Commute 13,464 8,604 112 - - 56% Scope 1 & 2 (Market-based) 50,480 59,014 74,367 87,810 94,235 -14% Scope 3 - Cat 8 Upstream leased assets 164 182 112 313 - -10% GHG EMISSIONS BY BUSINESS UNIT LOCATION-BASED [MTCO e] 2021 2020 2019 2018 2017 YEAR OVER YEAR 2 Scope 1 & 2 LB - U.S. Domestic 43,320 49,217 62,164 58,356 56,584 -12% Scope 1 & 2 LB - Brazil POB 131 116 174 85 109 13% Scope 1 & 2 LB - Japan 4,088 4,234 4,730 9,146 9,087 -3% Scope 1 & 2 LB - Taiwan POT 454 692 821 1,226 1,192 -34% Scope 1 & 2 LB - S. Korea (POK) 0 2,518 4,010 3,705 3,655 -100% TOTAL Scope 1 & 2 Scope 1 & 2 (Location-based) 47,993 56,777 71,898 72,518 70,627 -15% 62 Home Introduction Governance Sustainable Investing People Community Environment About this Report Appendix
 2021 ESG Report Page 61 Page 63