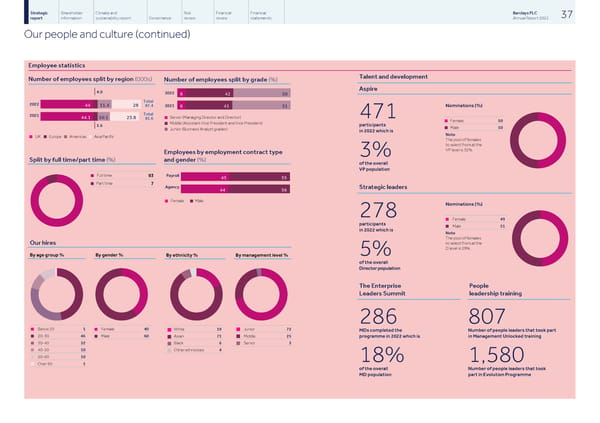
Strategic Shareholder Climate and Risk Financial Financial Barclays PLC 37 report information sustainability report Governance review review statements Annual Report 2022 Our people and culture (continued) Employee statistics Talent and development Number of employees split by region (000s) Number of employees split by grade (%) Aspire 4.0 2022 8 42 50 Total 2022 44 11.4 28 87.4 2021 Nominations (%) 8 41 51 Total 2021 471 Senior (Managing Director and Director) 44.1 10.1 23.8 n 81.6 Female 50 n Middle (Assistant Vice President and Vice President) n participants 3.6 Male 50 n Junior (Business Analyst grades) n in 2022 which is Note UK Europe Americas Asia Pacific n n n n The pool of females to select from at the VP level is 32%. Employees by employment contract type 3% and gender (%) Split by full time/part time (%) of the overall VP population Full time Payroll 93 n 45 55 Part time 7 n Agency Strategic leaders 44 56 Female Male n n Nominations (%) 278 Female 49 n participants Male 51 n in 2022 which is Note The pool of females to select from at the Our hires D level is 29%. 5% By age group % By gender % By ethnicity % By management level % of the overall Director population The Enterprise People Leaders Summit leadership training 286 807 Below 20 1 Female 40 White 19 Junior 72 n n n MDs completed the Number of people leaders that took part n 20-30 46 Male 60 Asian 71 Middle 25 programme in 2022 which is in Management Unlocked training n n n n 30-40 32 Black 6 Senior 3 n n n 40-50 10 Other ethnicities 4 n n 50-60 10 n 18% 1,580 Over 60 1 n of the overall Number of people leaders that took MD population part in Evolution Programme
 Barclays PLC - Annual Report - 2022 Page 38 Page 40