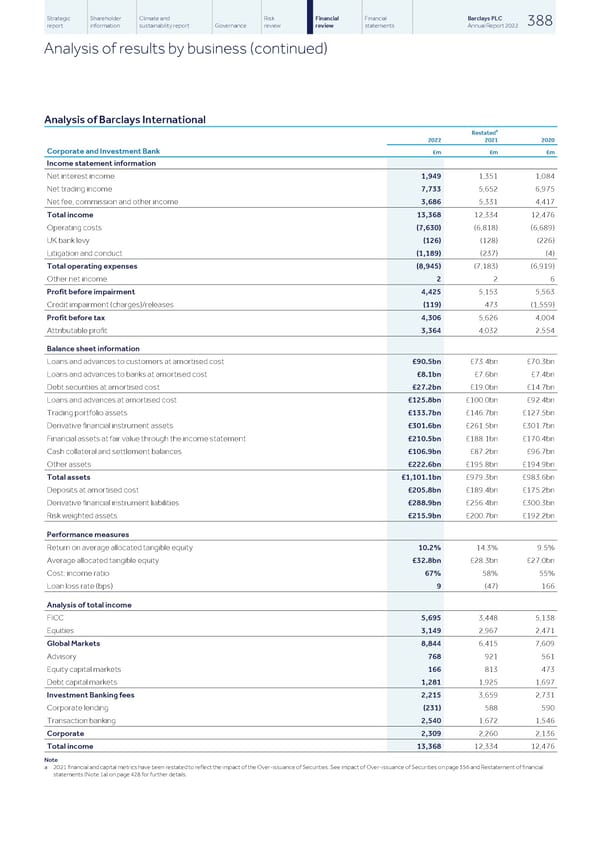
Strategic Shareholder Climate and Risk Financial Financial Barclays PLC 388 report information sustainability report Governance review review statements Annual Report 2022 Analysis of results by business (continued) Analysis of Barclays International a Restated 2022 2021 2020 Corporate and Investment Bank £m £m £m Income statement information Net interest income 1,949 1,351 1,084 Net trading income 7,733 5,652 6,975 Net fee, commission and other income 3,686 5,331 4,417 Total income 13,368 12,334 12,476 Operating costs (7,630) (6,818) (6,689) UK bank levy (126) (128) (226) Litigation and conduct (1,189) (237) (4) Total operating expenses (8,945) (7,183) (6,919) Other net income 2 2 6 Profit before impairment 4,425 5,153 5,563 Credit impairment (charges)/releases (119) 473 (1,559) Profit before tax 4,306 5,626 4,004 Attributable profit 3,364 4,032 2,554 Balance sheet information Loans and advances to customers at amortised cost £90.5bn £73.4bn £70.3bn Loans and advances to banks at amortised cost £8.1bn £7.6bn £7.4bn Debt securities at amortised cost £27.2bn £19.0bn £14.7bn Loans and advances at amortised cost £125.8bn £100.0bn £92.4bn Trading portfolio assets £133.7bn £146.7bn £127.5bn Derivative financial instrument assets £301.6bn £261.5bn £301.7bn Financial assets at fair value through the income statement £210.5bn £188.1bn £170.4bn Cash collateral and settlement balances £106.9bn £87.2bn £96.7bn Other assets £222.6bn £195.8bn £194.9bn Total assets £1,101.1bn £979.3bn £983.6bn Deposits at amortised cost £205.8bn £189.4bn £175.2bn Derivative financial instrument liabilities £288.9bn £256.4bn £300.3bn Risk weighted assets £215.9bn £200.7bn £192.2bn Performance measures Return on average allocated tangible equity 10.2% 14.3% 9.5% Average allocated tangible equity £32.8bn £28.3bn £27.0bn Cost: income ratio 67% 58% 55% Loan loss rate (bps) 9 (47) 166 Analysis of total income FICC 5,695 3,448 5,138 Equities 3,149 2,967 2,471 Global Markets 8,844 6,415 7,609 Advisory 768 921 561 Equity capital markets 166 813 473 Debt capital markets 1,281 1,925 1,697 Investment Banking fees 2,215 3,659 2,731 Corporate lending (231) 588 590 Transaction banking 2,540 1,672 1,546 Corporate 2,309 2,260 2,136 Total income 13,368 12,334 12,476 Note a 2021 financial and capital metrics have been restated to reflect the impact of the Over-issuance of Securities. See impact of Over-issuance of Securities on page 356 and Restatement of financial statements (Note 1a) on page 428 for further details.
 Barclays PLC - Annual Report - 2022 Page 389 Page 391