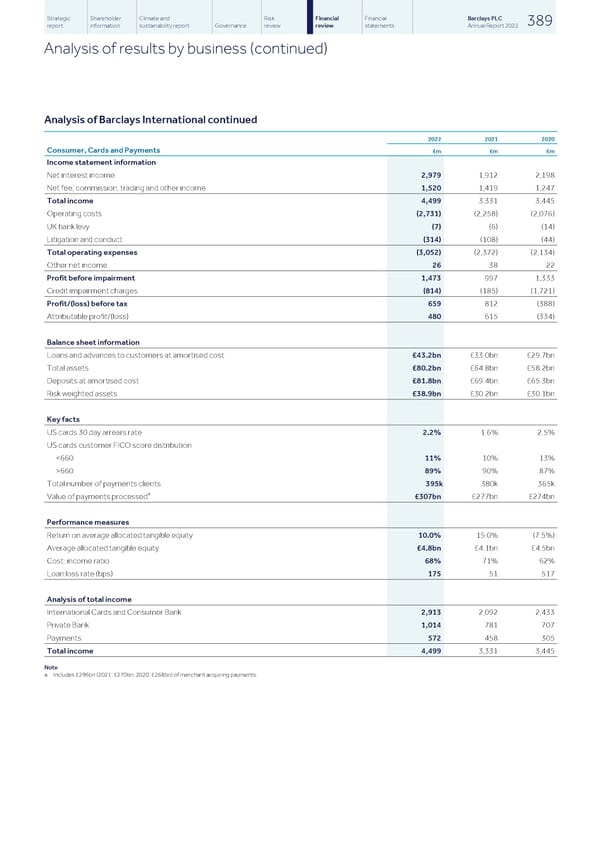
Strategic Shareholder Climate and Risk Financial Financial Barclays PLC 389 report information sustainability report Governance review review statements Annual Report 2022 Analysis of results by business (continued) Analysis of Barclays International continued 2022 2021 2020 Consumer, Cards and Payments £m £m £m Income statement information Net interest income 2,979 1,912 2,198 Net fee, commission, trading and other income 1,520 1,419 1,247 Total income 4,499 3,331 3,445 Operating costs (2,731) (2,258) (2,076) UK bank levy (7) (6) (14) Litigation and conduct (314) (108) (44) Total operating expenses (3,052) (2,372) (2,134) Other net income 26 38 22 Profit before impairment 1,473 997 1,333 Credit impairment charges (814) (185) (1,721) Profit/(loss) before tax 659 812 (388) Attributable profit/(loss) 480 615 (334) Balance sheet information Loans and advances to customers at amortised cost £43.2bn £33.0bn £29.7bn Total assets £80.2bn £64.8bn £58.2bn Deposits at amortised cost £81.8bn £69.4bn £65.3bn Risk weighted assets £38.9bn £30.2bn £30.1bn Key facts US cards 30 day arrears rate 2.2% 1.6% 2.5% US cards customer FICO score distribution 660 89% 90% 87% Total number of payments clients 395k 380k 365k a Value of payments processed £307bn £277bn £274bn Performance measures Return on average allocated tangible equity 10.0% 15.0% (7.5%) Average allocated tangible equity £4.8bn £4.1bn £4.5bn Cost: income ratio 68% 71% 62% Loan loss rate (bps) 175 51 517 Analysis of total income International Cards and Consumer Bank 2,913 2,092 2,433 Private Bank 1,014 781 707 Payments 572 458 305 Total income 4,499 3,331 3,445 Note a Includes £296bn (2021: £270bn; 2020: £268bn) of merchant acquiring payments.
 Barclays PLC - Annual Report - 2022 Page 390 Page 392