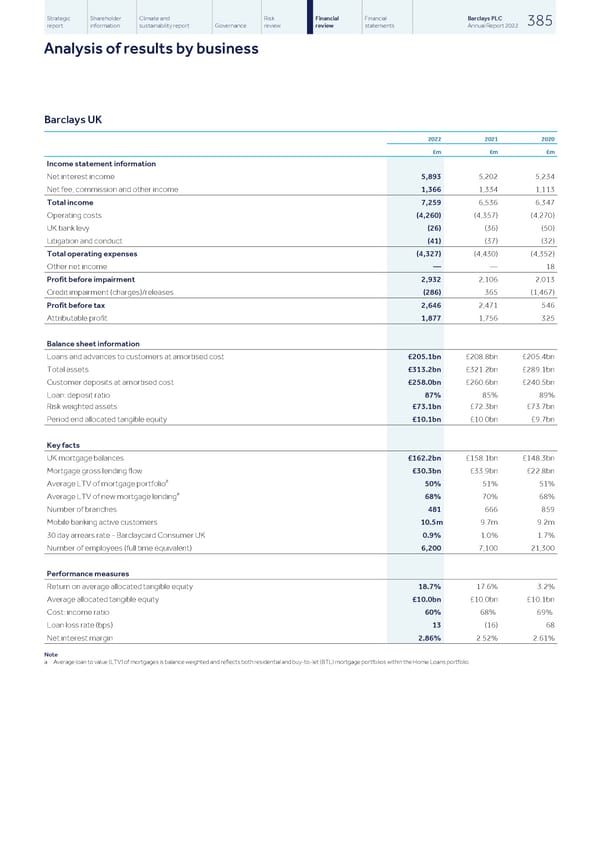
Strategic Shareholder Climate and Risk Financial Financial Barclays PLC 385 report information sustainability report Governance review review statements Annual Report 2022 Analysis of results by business Barclays UK 2022 2021 2020 £m £m £m Income statement information Net interest income 5,893 5,202 5,234 Net fee, commission and other income 1,366 1,334 1,113 Total income 7,259 6,536 6,347 Operating costs (4,260) (4,357) (4,270) UK bank levy (26) (36) (50) Litigation and conduct (41) (37) (32) Total operating expenses (4,327) (4,430) (4,352) Other net income — — 18 Profit before impairment 2,932 2,106 2,013 Credit impairment (charges)/releases (286) 365 (1,467) Profit before tax 2,646 2,471 546 Attributable profit 1,877 1,756 325 Balance sheet information Loans and advances to customers at amortised cost £205.1bn £208.8bn £205.4bn Total assets £313.2bn £321.2bn £289.1bn Customer deposits at amortised cost £258.0bn £260.6bn £240.5bn Loan: deposit ratio 87% 85% 89% Risk weighted assets £73.1bn £72.3bn £73.7bn Period end allocated tangible equity £10.1bn £10.0bn £9.7bn Key facts UK mortgage balances £162.2bn £158.1bn £148.3bn Mortgage gross lending flow £30.3bn £33.9bn £22.8bn a Average LTV of mortgage portfolio 50% 51% 51% a Average LTV of new mortgage lending 68% 70% 68% Number of branches 481 666 859 Mobile banking active customers 10.5m 9.7m 9.2m 30 day arrears rate - Barclaycard Consumer UK 0.9% 1.0% 1.7% Number of employees (full time equivalent) 6,200 7,100 21,300 Performance measures Return on average allocated tangible equity 18.7% 17.6% 3.2% Average allocated tangible equity £10.0bn £10.0bn £10.1bn Cost: income ratio 60% 68% 69% Loan loss rate (bps) 13 (16) 68 Net interest margin 2.86% 2.52% 2.61% Note a Average loan to value (LTV) of mortgages is balance weighted and reflects both residential and buy-to-let (BTL) mortgage portfolios within the Home Loans portfolio.
 Barclays PLC - Annual Report - 2022 Page 386 Page 388