Applied Materials Sustainability Report
SUSTAINABILITY REPORT 2021 Make Possible ® a Better Future
INTRODUCTION Message from our CEO About Applied Materials Our Sustainability Vision and Strategy Make Possible a Better Future Our Progress at a Glance Corporate Responsibility Materiality Assessment PURPOSE PEOPLE PLANET PROGRESS Applied Materials has the industry’s broadest and most enabling portfolio of materials engineering solutions used to produce virtually every chip and advanced display in the world. We recognize that this unique leadership position comes with tremendous responsibility to our employees, customers and society. In fiscal 2021, as the world continued to adapt to the impacts of COVID-19 and global supply chain disruptions challenged the resilience of every industry, Applied made strong progress toward our 10-year sustainability roadmap. Our comprehensive 2030 strategy considers the magnitude of our opportunities including social and environmental impacts in our operations (1X), how we work with customers and suppliers (100X), and how our technology can be used to advance sustainability on a global scale (10,000X). Here are just a few highlights of our recent progress: > Reduced our Scope 1 and 2 emissions and increased our use of renewable electricity, remaining on track to achieve our 2030 goals. > Quantified our full Scope 3 emissions inventory for our 2019 baseline and reported our carbon impact and risks in-line with the Task Force on Climate Related Financial Disclosures (TCFD). > Advanced our 3x30 and SuCCESS2030 goals, including accelerating sustainable innovation, improving the longevity of our products, and enabling our suppliers to better meet our ESG expectations. > Strengthened our Culture of Inclusion by providing comprehensive diversity training to all senior leaders and a majority of employees worldwide and increased the representation of women and underrepresented minorities in our company—though we know we have to do much more to reach our targets. > Conducted our first human rights salience assessment, which builds on our Human Rights Statement of Principles . We will report on our progress toward these topics in future years. > Completed an equity audit of our community involvement and investments, and committed to put equity at the center of all future community engagements. In this 2021 Sustainability Report, you will learn how we lead with purpose and support our local communities; invest in people to create a vibrant culture of inclusion where every Applied employee is empowered to grow and thrive in their careers; protect our planet by reducing our direct and indirect impacts; and innovate for progress across our global supply chain. The opportunity for technology to shape a more equitable and sustainable world has never been more promising. Applied Materials remains steadfast in our commitment to work across this ecosystem to drive critical advances that will accelerate a sustainable and inclusive digital economy and Make Possible ® a Better Future for all generations to come. Gary E. Dickerson President and Chief Executive Officer Digital transformation is accelerating and impacting virtually every area of life and the economy. Semiconductors that power this transformation are more essential than ever and greatly influence the prospect of shaping a more sustainable and equitable future. Message from our CEO Sustainability Report 2021 2 INTRODUCTION Message from our CEO About Applied Materials Our Sustainability Vision and Strategy Make Possible a Better Future Our Progress at a Glance Corporate Responsibility Materiality Assessment PURPOSE PEOPLE PLANET PROGRESS
INTRODUCTION Message from our CEO About Applied Materials Our Sustainability Vision and Strategy Make Possible a Better Future Our Progress at a Glance Corporate Responsibility Materiality Assessment PURPOSE PEOPLE PLANET PROGRESS Sustainability Report 2021 3 Applied Materials is the leader in materials engineering solutions used to produce virtually every new chip and advanced display in the world. Our expertise in modifying materials at atomic levels and on an industrial scale enables customers to transform possibilities into reality. We are driven to Make Possible a Better Future for everyone. About Applied Materials Sustainability Report 2021 Our Products and Services Applied provides manufacturing equipment, services, and software to the semiconductor, display, and related industries. Our customers include manufacturers of semiconductor chips, liquid crystal display (LCD) and organic light-emitting diode (OLED) displays, and other electronic devices. Semiconductor Systems Designing and manufacturing the systems used to fabricate semiconductor chips. Applied Global Services Providing consulting, spare parts, services, and automation software to improve equipment and fab operation performance and productivity. Display and Adjacent Markets Making the products to manufacture LCDs, OLEDs, and other display technologies and customer-oriented devices, and equipment for processing flexible substrates. Applied Ventures, LLC Applied Ventures, LLC, is the venture capital arm of Applied Materials, investing in and collaborating with startups pioneering innovations in smartphones, augmented and virtual reality, artificial intelligence, driverless cars, big data, life sciences, 3D printing, robotics, cleantech, and advanced materials. Applied Ventures is stage agnostic and may invest up to $50M per year globally. INTRODUCTION Message from our CEO About Applied Materials Our Sustainability Vision and Strategy Make Possible a Better Future Our Progress at a Glance Corporate Responsibility Materiality Assessment PURPOSE PEOPLE PLANET PROGRESS
Sustainability Report 2021 4 FY21 Company Overview Highlights Awards and Recognition Fortune The World’s Most Admired Companies 2022 JUST100 America’s Most Just Companies 2022 Barron’s Top 100 Most Sustainable Companies 2021 Forbes World’s Best Employers 2021 Investor’s Business Daily Best ESG Companies 2021 Forbes Green Growth 50 List 2021 FTSE4Good CommonWealth Magazine’s Excellence in Corporate Social Responsibility Award, Foreign Enterprise Category, 2021 HEADQUARTERED IN CALIFORNIA’S SILICON VALLEY $ 23.1 B REVENUE ~15,700 PATENTS AMAT STOCK LISTING ON NASDAQ $ 2.5 B R&D INVESTMENT ~27,000 REGULAR FULL-TIME EMPLOYEES WORLDWIDE (>115 LOCATIONS, 19 COUNTRIES) INTRODUCTION Message from our CEO About Applied Materials Our Sustainability Vision and Strategy Make Possible a Better Future Our Progress at a Glance Corporate Responsibility Materiality Assessment PURPOSE PEOPLE PLANET PROGRESS 2022 Human Rights Campaign Best Places to Work for LGBTQ Equality
INTRODUCTION Message from our CEO About Applied Materials Our Sustainability Vision and Strategy Make Possible a Better Future Our Progress at a Glance Corporate Responsibility Materiality Assessment PURPOSE PEOPLE PLANET PROGRESS Sustainability Report 2021 5 We take a holistic approach to sustainability that considers our direct impact and how we run our business (1X), our industry’s impact and that of our customers and suppliers (100X), and how our technology can be used to advance sustainability on a global scale (10,000X). To advance our 1X–100X–10,000X strategy, we: Our 1X–100X–10,000X framework is underpinned by aggressive environmental and social impact goals to hold us accountable for progress. See our Purpose , People , Planet , and Progress goals and progress. Our Sustainability Vision and Strategy Lead with purpose through a values-based approach to innovation, decision-making and community action. Read more Invest in people to build a deep-rooted Culture of Inclusion and foster a diverse and skilled talent pipeline. Read more Innovate for progress to empower transformative innovation that improves technology in harmony with resources. Read more Protect our planet by respecting the Earth’s finite resources while enabling infinite growth in our business and the data economy. Read more INTRODUCTION Message from our CEO About Applied Materials Our Sustainability Vision and Strategy Make Possible a Better Future Our Progress at a Glance Corporate Responsibility Materiality Assessment PURPOSE PEOPLE PLANET PROGRESS
INTRODUCTION Message from our CEO About Applied Materials Our Sustainability Vision and Strategy Make Possible a Better Future Our Progress at a Glance Corporate Responsibility Materiality Assessment PURPOSE PEOPLE PLANET PROGRESS Lead with Purpose Invest in People Protect our Planet Innovate for Progress 10,000 X 100X FOR THE INDUSTRY 1 X FOR OUR BUSINESS FOR THE WORLD Sustainability Report 2021 6 Make Possible a Better Future Empowering a more sustainable and equitable world. INTRODUCTION Message from our CEO About Applied Materials Our Sustainability Vision and Strategy Make Possible a Better Future Our Progress at a Glance Corporate Responsibility Materiality Assessment PURPOSE PEOPLE PLANET PROGRESS
INTRODUCTION Message from our CEO About Applied Materials Our Sustainability Vision and Strategy Make Possible a Better Future Our Progress at a Glance Corporate Responsibility Materiality Assessment PURPOSE PEOPLE PLANET PROGRESS Sustainability Report 2021 7 Our Progress at a Glance In 2021, Applied Materials made progress toward its vision to Make Possible a Better Future. Here are just a few of the highlights. Lead with purpose Invest in people Innovate for progress Protect our planet $ 13.7 M DIRECT CORPORATE CONTRIBUTIONS & FOUNDATION GRANTS ACHIEVED OUR GOAL TO INCREASE WOMEN’S REPRESENTATION IN THE U.S. TO 21% ENGAGED NEARLY 16,000 EMPLOYEES IN THE PATHWAY LEARNING & DEVELOPMENT PROGRAM 2019 SCOPE 3 BASELINE CALCULATED: ~ 12 M MT CO 2 E OF THE APPLIED LEADERSHIP GROUP COMPLETED OUR INCLUSIVE LEADERSHIP TRAINING PROGRAM OF TOOLS UNDER CONTRACT ARE CONTINUOUSLY REFURBISHED, EXTENDING THEIR PRODUCTIVE LIVES RENEWABLE ELECTRICITY USE INCREASED IN THE U.S. AND GLOBAL LY FROM 2020 TO 2021 28% REDUCTION IN SCOPE 1 & 2 MARKET-BASED EMISSIONS 3 X 30 COLLABORATING WITH MULTIPLE CUSTOMERS TO SIGNIFICANTLY REDUCE ENERGY USE & THE IMPACT OF CHEMICAL CONSUMPTION IN THE SEMICONDUCTOR INDUSTRY ADVOCATED FOR ECONOMIC INCENTIVES TO STRENGTHEN THE U.S. SEMICONDUCTOR INNOVATION ECOSYSTEM 87 % 4 1 % 80 % 37 % 5 7 % U.S. GLOBAL 70 % INTRODUCTION Message from our CEO About Applied Materials Our Sustainability Vision and Strategy Make Possible a Better Future Our Progress at a Glance Corporate Responsibility Materiality Assessment PURPOSE PEOPLE PLANET PROGRESS
INTRODUCTION Message from our CEO About Applied Materials Our Sustainability Vision and Strategy Make Possible a Better Future Our Progress at a Glance Corporate Responsibility Materiality Assessment PURPOSE PEOPLE PLANET PROGRESS Sustainability Report 2021 8 To strengthen our focus and improve our performance on potential environmental, social, and governance issues, Applied conducted a corporate responsibility materiality* assessment in 2021 using the Datamaran platform. Corporate Responsibility Materiality Assessment This automated solution helped us comprehensively review a wide range of environmental, social and governance (ESG) topics to identify those ESG issues most important to our stakeholders and where Applied may effect the most significant progress to Make Possible a Better Future. To ensure the most comprehensive identification of relevant issues, the assessment analyzed impacts using a double-materiality lens: assessing ESG factors likely to impact Applied as well as factors that our activities may impact. The assessment includes insights from key stakeholders, including customers, investors, suppliers, policy makers, regulators, media, industries and peers, as well as internal Applied stakeholders. All the issues identified as critical in the matrix are discussed in this report. Though this exercise has affirmed the company’s prioritization of ESG issues that are most strategic and impactful for Applied, such as climate change, energy, supply chain resilience, diversity and inclusion, and human rights, Applied will continue to reassess relative priorities, which may shift in the future. * Materiality in this context and in this report refers to the relative significance of ESG issues in the context of our ESG program, and does not refer to the concept of materiality used in financial reporting, securities, or other applicable law. Importance to Stakeholders Importance to Business H I G HER H I G HER L O WER L O WER Innovation & Technology Community Relations Water & natural capital Employee health & safety Supply chain resilience Public health risk Climate change & GHG emissions Energy management Transition to renewable & alternative energies Management of the Legal & Regulatory Environment Responsible consumption & production Customer privacy & data security Ethical corporate behavior Human rights Workforce management Environmental Social Economic/Governance Waste & hazardous materials management Employee diversity & inclusion INTRODUCTION Message from our CEO About Applied Materials Our Sustainability Vision and Strategy Make Possible a Better Future Our Progress at a Glance Corporate Responsibility Materiality Assessment PURPOSE PEOPLE PLANET PROGRESS
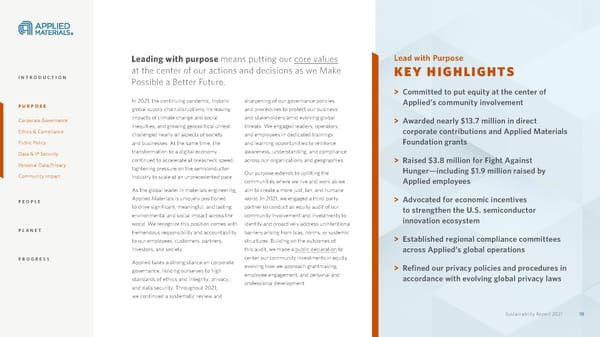
Sustainability Report 2021 9 Lead with Purpose Our values guide every decision we make and every action we take to Make Possible a Better Future for our employees, customers, partners, and neighbors. INTRODUCTION PURPOSE Corporate Governance Ethics & Compliance Public Policy Data & IP Security Personal Data Privacy Community Impact PEOPLE PLANET PROGRESS
Sustainability Report 2021 10 In 2021, the continuing pandemic, historic global supply chain disruptions, increasing impacts of climate change and social inequities, and growing geopolitical unrest challenged nearly all aspects of society and businesses. At the same time, the transformation to a digital economy continued to accelerate at breakneck speed, tightening pressure on the semiconductor industry to scale at an unprecedented pace. As the global leader in materials engineering, Applied Materials is uniquely positioned to drive significant, meaningful, and lasting environmental and social impact across the world. We recognize this position comes with tremendous responsibility and accountability to our employees, customers, partners, investors, and society. Applied takes a strong stance on corporate governance, holding ourselves to high standards of ethics and integrity, privacy, and data security. Throughout 2021, we continued a systematic review and sharpening of our governance policies and procedures to protect our business and stakeholders amid evolving global threats. We engaged leaders, operators, and employees in dedicated trainings and learning opportunities to reinforce awareness, understanding, and compliance across our organizations and geographies. Our purpose extends to uplifting the communities where we live and work as we aim to create a more just, fair, and humane world. In 2021, we engaged a third-party partner to conduct an equity audit of our community involvement and investments to identify and proactively address unintentional barriers arising from bias, norms, or systemic structures. Building on the outcomes of this audit, we made a public declaration to center our community investments in equity, evolving how we approach grantmaking, employee engagement, and personal and professional development. Leading with purpose means putting our core values at the center of our actions and decisions as we Make Possible a Better Future. Lead with Purpose KEY HIGHLIGHTS > Committed to put equity at the center of Applied’s community involvement > Awarded nearly $13.7 million in direct corporate contributions and Applied Materials Foundation grants > Raised $3.8 million for Fight Against Hunger—including $1.9 million raised by Applied employees > Advocated for economic incentives to strengthen the U.S. semiconductor innovation ecosystem > Established regional compliance committees across Applied’s global operations > Refined our privacy policies and procedures in accordance with evolving global privacy laws Sustainability Report 2021 10 INTRODUCTION PURPOSE Corporate Governance Ethics & Compliance Public Policy Data & IP Security Personal Data Privacy Community Impact PEOPLE PLANET PROGRESS
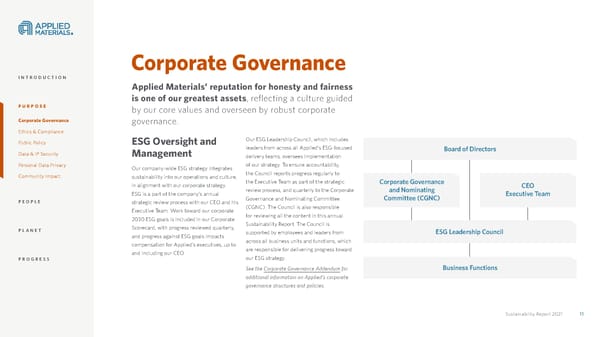
Sustainability Report 2021 11 Sustainability Report 2021 11 Applied Materials’ reputation for honesty and fairness is one of our greatest assets , reflecting a culture guided by our core values and overseen by robust corporate governance. Corporate Governance ESG Oversight and Management Our company-wide ESG strategy integrates sustainability into our operations and culture, in alignment with our corporate strategy. ESG is a part of the company’s annual strategic review process with our CEO and his Executive Team. Work toward our corporate 2030 ESG goals is included in our Corporate Scorecard, with progress reviewed quarterly, and progress against ESG goals impacts compensation for Applied’s executives, up to and including our CEO. Our ESG Leadership Council, which includes leaders from across all Applied’s ESG-focused delivery teams, oversees implementation of our strategy. To ensure accountability, the Council reports progress regularly to the Executive Team as part of the strategic review process, and quarterly to the Corporate Governance and Nominating Committee (CGNC). The Council is also responsible for reviewing all the content in this annual Sustainability Report. The Council is supported by employees and leaders from across all business units and functions, which are responsible for delivering progress toward our ESG strategy. See the Corporate Governance Addendum for additional information on Applied’s corporate governance structures and policies. Board of Directors Business Functions CEO Executive Team Corporate Governance and Nominating Committee (CGNC) ESG Leadership Council INTRODUCTION PURPOSE Corporate Governance Ethics & Compliance Public Policy Data & IP Security Personal Data Privacy Community Impact PEOPLE PLANET PROGRESS
Sustainability Report 2021 12 Sustainability Report 2021 12 Environmental, Social, and Governance (ESG): On a quarterly basis, our Corporate Governance and Nominating Committee (CGNC) receives in-person and written updates from our head of ESG, Corporate Sustainability, and Reporting. The CGNC also reviews the company’s ESG strategy on a regular basis. Environmental Health and Safety (EHS): On a quarterly basis, the CGNC receives updates from our head of EHS, as well as more in-depth annual updates on sustainability, environment, health and safety. Supply Chain and Conflict Minerals: Our Board reviews material supply chain issues and the Board’s Audit Committee reviews the annual Conflict Minerals Report we file with the SEC. Our People and Workplace: The Board’s Human Resources and Compensation Committee (HRCC) oversees corporate culture and human capital management programs, including our Culture of Inclusion practices and initiatives. Community Engagement: Much of our community engagement and grantmaking is led by the Applied Materials Foundation, which has its own board and is independently audited on an annual basis. Applied Materials corporate governance documents are publicly available here . Our 2022 Proxy Statement is available here . Reporting on our ESG efforts is segmented by focus area: INTRODUCTION PURPOSE Corporate Governance Ethics & Compliance Public Policy Data & IP Security Personal Data Privacy Community Impact PEOPLE PLANET PROGRESS
Sustainability Report 2021 13 Sustainability Report 2021 13 Each member of our workforce plays a part in this commitment by conducting their professional duties with responsibility and integrity, and we expect our executives and managers to lead by example. To continually reinforce integrity across our culture, Applied maintains a Global Ethics and Compliance Program with strong leadership and engagement from senior management. Our Board’s Audit Committee oversees the program’s overall design and implementation, including mechanisms for reporting potential violations of law or policy and investigating potential integrity violations by executive officers. The Audit Committee receives quarterly reports covering investigations, program development initiatives, and key trends and indicators. Employee engagement efforts include ethics training, awareness campaigns, and our annual Responsibility and Integrity Week, along with employee ethics surveys and road shows. Throughout our business units, designated Compliance Champions promote ethics and compliance, intellectual property protection and mandatory training completion, and serve as trusted local contacts employees can approach with questions or concerns. In 2021, we established regional compliance committees across our global operations, comprised of local leaders from the Legal and Compliance Organization (LCO), Finance, HR, and business units. These committees enable local implementation of initiatives, provide regional feedback and recommendations, and further drive our culture of integrity. In 2022, we are launching a cross-functional Global Compliance Oversight Committee (GCOC) to enable the business with global compliance procedures, training and controls calibrated to Applied’s business and evolving risk profile. Sponsored by our Chief Legal Officer, Chief Financial Officer, and Chief Human Resources Officer, the GCOC includes senior representatives from each Applied business unit and department and meets quarterly. In 2022, we aim to complete our compliance management systems documentation, which details regional, global and cross-functional compliance policies and procedures. See the Corporate Governance Addendum for additional details about our ethics policies and governance structures. Click here for information on our mechanisms for reporting ethics concerns. Applied is committed to being a good corporate citizen and a trusted partner to our customers, suppliers and shareholders. Ethics and Compliance INTRODUCTION PURPOSE Corporate Governance Ethics & Compliance Public Policy Data & IP Security Personal Data Privacy Community Impact PEOPLE PLANET PROGRESS
Sustainability Report 2021 14 Standards of Business Conduct Applied Materials’ Standards of Business Conduct communicate our values, set expectations for our global workforce and network of trusted partners, and provide guidance designed to promote the highest ethical standards in our interactions with customers, suppliers, colleagues, communities and other stakeholders. The Standards are designed to promote trust in management’s commitment to our values, empower employees to speak up without fear of retaliation, and provide comprehensive guidance about risks, laws, policies and reporting processes, including key concerns such as conflicts of interest, bribery and corruption. Over the past two years we’ve been working on updates to our Standards and associated policies, procedures, controls and trainings, tying them closer to our core values and emphasizing relevance to today’s dynamic risk environment, everywhere we do business. We will complete our Standards update in 2022, along with the release of a new set of standards for business partners. In 2021, we updated our global Anti-Corruption Policy and our Gifts, Meals, Entertainment and Travel (GMET) Policy. We also updated our Conflict of Interest (COI) new-hire process and added anti-corruption controls to our intern recruitment process. To enable real-time data analytics and insights regarding compliance with our Standards, we maintain a global dashboard for tracking conflict-of-interest disclosures, corporate donation approval requests and GMET approvals. We are currently in the process of building out and automating key elements of our third-party anti-corruption due diligence procedures, and in 2021 we transitioned to conducting regular third-party audits. Our Core Values Most valued partner Winning team Responsibility and integrity World-class performance Sustainability Report 2021 14 INTRODUCTION PURPOSE Corporate Governance Ethics & Compliance Public Policy Data & IP Security Personal Data Privacy Community Impact PEOPLE PLANET PROGRESS
Sustainability Report 2021 15 Sustainability Report 2021 15 Responsible Business Alliance Code of Conduct Applied Materials sets clear expectations for social responsibility in our supply chain, requiring our vendors and suppliers to comply with both our own Standards and the Responsible Business Alliance (RBA) Code of Conduct. The RBA Code provides standards related to labor, health and safety, environment, ethics and management systems, including responsible minerals sourcing. Ethics Compliance and Training Applied Materials provides all our employees with training and reinforcement to support their ongoing obligations around ethics and compliance. Newly hired employees are assigned a Standards of Business Conduct training and certification course that covers our policies on conflicts of interest, intellectual property protection, anti-corruption, gifts, insider trading, supplier selection and treatment, speaking up and non-retaliation. Employees renew their training and certification to the Standards each year. Employees also have access to ongoing training in specific areas of ethics and compliance. In 2021, those included live localized anti-corruption training across our APAC region and micro-learning and awareness campaigns designed to provide process refreshers and support ethical decision-making. Responsibility and Integrity Week In April 2022, we held our annual Responsibility & Integrity Week to show Applied’s values in action. Conducted virtually, the week included events designed to raise awareness of themes, resources and best practices supporting our core value of Responsibility and Integrity, and featured insights from regional leaders and a fireside chat with Chief Legal Officer Teri Little and CFO Brice Hill. Over the course of the week, the programming attracted over 38,560 views and included cross-functional presenters from across our teams. In early 2022, we launched a new Inside Compliance channel on our internal Applied4You social media platform. INTRODUCTION PURPOSE Corporate Governance Ethics & Compliance Public Policy Data & IP Security Personal Data Privacy Community Impact PEOPLE PLANET PROGRESS
Throughout 2021, Government Affairs engaged on proposed changes to corporate and international tax policy to ensure a level playing field for Applied in all the jurisdictions where we operate. We also dedicated considerable effort to proposed U.S. economic incentives to strengthen the U.S. semiconductor innovation ecosystem. Other policy areas of focus included the ongoing pandemic response, international trade, technology regulation, Research and Development (R&D), human resources and labor, and sustainability. These include advocating for immigration reform that embraces the valuable role of immigrants in the U.S. economy; advocating for fairness, diversity and inclusion, including LGBTQ rights; and working on policies, partnerships and R&D incentives to develop and advance next-generation technologies. Sustainability Report 2021 16 Sustainability Report 2021 16 Public Policy Applied Materials participates in efforts to inform policymakers about issues and challenges critical to our company, our customers and our end users, typically via meetings, hearings and trade association advocacy efforts. INTRODUCTION PURPOSE Corporate Governance Ethics & Compliance Public Policy Data & IP Security Personal Data Privacy Community Impact PEOPLE PLANET PROGRESS
Sustainability Report 2021 17 Sustainability Report 2021 17 Business and Trade Associations Applied Materials maintains memberships in various business and trade associations that advance issues aligned with our corporate strategy and the needs of our company, industry, employees, and communities. Our membership in a group does not imply that we endorse the entirety of that group’s policy positions. In 2021, Applied paid approximately $578,000 in trade association membership dues, 18% of which were specified by the associations as non-deductible lobbying expenditures. This total does not include conference or event sponsorships, programming activities or similar costs. Applied Materials reports on federal lobbying through the Lobbying Disclosure Act Database, and files periodic reports with federal and state agencies as appropriate. Our U.S. Trade and Business Associations membership list can be found here . Political Contributions The Applied Materials, Inc. Political Action Committee (AMPAC) contributes to federal candidates, political action committees and party committees supporting issues of strategic importance to Applied, consistent with all legal requirements. Our State Contributions Committee oversees corporate political spending to advance those strategic issues at the state and local levels. While Applied pays the administrative expenses for AMPAC, AMPAC is funded entirely through voluntary contributions from eligible employees, and does not make any contributions using Applied Materials corporate funds. AMPAC’s activities are overseen, and its contributions reviewed and approved, by the AMPAC Board of Directors. Contributions are based solely on corporate objectives, without regard for the private political preferences of either the employees who contribute to AMPAC or individual committee members. During 2021, political contributions made by AMPAC totaled $24,600. See the Corporate Governance Addendum for additional details on Applied’s political donation policies, mechanisms, and compliance practices. Political Spending FY 2021 FY 2020 FY 2019 POLITICAL CONTRIBUTION DATA Total value of financial contributions to political parties, candidates, and related institutions by Applied Materials $0 $0 $0 Total value of financial contributions to political parties, candidates, and related institutions by AMPAC $24,600 $53,500 $84,000 INTRODUCTION PURPOSE Corporate Governance Ethics & Compliance Public Policy Data & IP Security Personal Data Privacy Community Impact PEOPLE PLANET PROGRESS
Sustainability Report 2021 18 Sustainability Report 2021 18 Recognizing that cyber-attacks long ago moved from being a matter of if to when, we maintain both a robust defense framework and the capacity for rapid detection and response. We conduct 24/7 monitoring and weekly vulnerability assessments and continuously update our mitigation practices to stay ahead of threats. Among other efforts, we: > Maintain response procedures and escalation protocols > Employ third parties for external threat monitoring, penetration testing and phishing exercises > Maintain enhanced email security controls > Provide robust training for our employees on recognizing security threats to enable compliance with applicable data security laws, regulations, industry practice and our internal policies > Partner with industry groups, government agencies and outside experts for information exchange and peer benchmarking > Engage third-party auditors to help assure the effectiveness of internal controls Our efforts extend across our supply chain via enhanced security controls embedded in the supplier onboarding process, protocols for assessing supply chain cyber-breaches and ransomware incidents, a playbook for restoring business continuity and continuous assessment and control enhancement for high-impact suppliers. To enhance customer trust, we provide virus-free certifications with all sales of Applied semiconductor systems. Applied Materials has undergone a National Institute of Standards of Technology (NIST) Cybersecurity Framework assessment and currently maintains one of the best BitSight security scores among our industry peers. We’ve also achieved ISO 27001 certification for information security at 45 of our business sites, in order to align our data security management systems and programs with global best practices. Our Chief Information Security Officer reports at least quarterly to the Board’s Audit Committee on our data and IP security programs, policies, controls, key risks and notable incidents. Applied Materials considers data security one of our top strategic priorities. In a threat landscape highlighted by massive data breaches, rising ransomware attacks, increasing availability of hacking tools and incursions by state-sponsored actors, we devote all necessary resources toward making Applied a safe data choice for our global stakeholders. Data and IP Security INTRODUCTION PURPOSE Corporate Governance Ethics & Compliance Public Policy Data & IP Security Personal Data Privacy Community Impact PEOPLE PLANET PROGRESS
Sustainability Report 2021 19 Sustainability Report 2021 19 We maintain a privacy policy that describes our procedures regarding the collection, use, storage and disclosure of information collected through these channels, and a dedicated email address to streamline questions, concerns and reporting issues around privacy. In 2021, we began a full overhaul and expansion of our policies and procedures to adapt to evolving global privacy laws, including China’s Personal Information Protection Law. We also launched a technology platform to semi-automate the creation and maintenance of records of personal data processing activities and a map of personal data in our systems. Throughout the year, we conducted instructor-led virtual trainings on compliance policies and practices, targeted to: > Roles and responsibilities related to new and updated privacy laws > Human Resources, Information Technology and other functions that process high volumes of personal data > Regional compliance committees, including their most senior country leadership We anticipate rolling out global required trainings for all employees by summer 2022. Applied Materials respects the privacy of all individuals with whom we communicate and interact , whether directly or via our software or website. Personal Data Privacy INTRODUCTION PURPOSE Corporate Governance Ethics & Compliance Public Policy Data & IP Security Personal Data Privacy Community Impact PEOPLE PLANET PROGRESS
Sustainability Report 2021 20 Sustainability Report 2021 20 We turn our values into local action through community engagement efforts driven by our belief that equity-centered engagement contributes to a more just, fair and humane world. We are committed to working collaboratively to address historical inequities and to learning from leaders who understand the issues we hope to help solve. Applied Materials and the Applied Materials Foundation focus funding on nonprofits working to advance education, civic engagement, arts and culture, the environment, and girls’ empowerment—the latter primarily through the Generation Girl® initiative, a signature Foundation program. We also pivot in response to societal need, as we have over the past two years to support community service organizations and first responders during critical periods of the COVID-19 pandemic. At Applied Materials, making a positive contribution to the world around us is the foundation of our culture. We respect each individual, welcome diversity and embrace different perspectives as a key component of innovation—valuing our differences is our greatest strength. Community Impact Breakdown of Contributions by Category “Working at Applied Materials allows me to enjoy all my passions— growing my technical skills and having ownership of projects that drive key business outcomes, while at the same time working with my community and peers through volunteering and outreach opportunities. I love that I can grow and learn in all aspects through Applied’s initiatives, employee groups, and technology experts. Erika Process Engineer $1,299,057 $2,828,701 $3,029,760 $666,942 $962,400 $145,549 $4,794,230 $13,726,640 DISASTER RESPONSE ENVIRONMENT GIRLS’ EMPOWERMENT ARTS & CULTURE EDUCATION CIVIC DEVELOPMENT EMPLOYEE MATCHING TOTAL INTRODUCTION PURPOSE Corporate Governance Ethics & Compliance Public Policy Data & IP Security Personal Data Privacy Community Impact PEOPLE PLANET PROGRESS
Sustainability Report 2021 21 In 2021, Applied Materials and the Foundation awarded $13,726,640 in direct corporate contributions and Foundation grants, benefiting 330 recipients in 10 countries. The total represents a decrease from 2020 as the Foundation’s COVID-19 response downshifted to recovery efforts. At the same time, we enabled our employees to achieve greater impact on community issues through the Foundation’s matching grant program, which doubles individual employee giving up to $3,000 annually— aligning our support behind the causes our people care about. During large, culturally significant celebrations such as Black History Month and Pride Month, our employee communications highlight local and national charities working for social justice and equity, suggesting ways to make a positive impact. We believe our role as leaders is to make the world a better place, and we are committed to taking meaningful action. “I have been both a recipient and supporter of food programs... I am proud to be part of a company that gives back to our communities in such a meaningful way. I am so incredibly grateful for the opportunities I have here at Applied, the position our company is in, and the ability to continue to help others.” Ann Enterprise Enablement Group Community Impact con t. INTRODUCTION PURPOSE Corporate Governance Ethics & Compliance Public Policy Data & IP Security Personal Data Privacy Community Impact PEOPLE PLANET PROGRESS
Sustainability Report 2021 22 Evolving Engagement to Center Equity As part of a multi-year journey to evaluate and improve the Applied Materials Foundation and Applied Materials’ U.S.- based engagement in communities of color, our Community Affairs team partnered with Black-owned consulting firm Frontline Solutions in 2021 to conduct an equity assessment examining Foundation and company programs and practices. The team dedicated time to listening, learning, and reflecting on issues of equity, prejudice, power, and privilege, seeking to identify and proactively address unintentional barriers arising from bias, norms, or systemic structures. We also surveyed recent grantees on the degree to which company and Foundation programs and practices center equity. Based on audit results and feedback, we made a public declaration of commitment to equity-centered community involvement focused across three core areas: > Grantmaking: Applied and the Foundation will make data-driven assessments of how organizations include the voice of the community in the issue they seek to address, to ensure we are funding organizations with the deep community trust required to achieve their goals. To increase transparency, we will post grant recipients of both Foundation and company grants on our website beginning in 2022. > Employee Engagement: The Community Affairs team will work with community leaders, our Employee Resource Groups, and an outside vendor to identify high-impact nonprofits led by and serving people of color to promote a greater variety of volunteer and other community engagement opportunities for Applied employees. > Personal and Professional Development: To ensure that company and Foundation decision-making structures and Community Affairs operations are centered in equity, we will conduct internal team learning activities to address biases and norms that negatively impact communities and organizations of color. 2021 Excellence in Corporate Social Responsibility Award Top 15, Foreign Enterprise Category CommonWealth magazine, Taiwan Sustainability Report 2021 22 INTRODUCTION PURPOSE Corporate Governance Ethics & Compliance Public Policy Data & IP Security Personal Data Privacy Community Impact PEOPLE PLANET PROGRESS
Sustainability Report 2021 23 Sustainability Report 2021 23 Responding to Acute Community Need Applied Materials, the Applied Materials Foundation, and our 27,000 employees remain flexible in providing funding for communities severely impacted by the COVID-19 pandemic, natural disasters, and systemic racism. For the past two-plus years, Applied and the Foundation have stepped up to help those most impacted by the COVID-19 pandemic. These efforts have included providing financial support to U.S. food banks and global relief organizations, delivering Personal Protective Equipment (PPE) and other supplies to frontline medical personnel, providing hand sanitizer to senior programs and homeless shelters, and ensuring disadvantaged children and their families have access to nutritious meals. In 2021, the Foundation partnered with the Indian- American Friendship Alliance to deliver oxygen concentrators to India during that country’s deadly Delta variant surge. As Asian-Americans faced a wave of racist violence across the U.S. inspired by COVID-19 misinformation and anti-Asian rhetoric, the Foundation donated to Asian Americans Advancing Justice to support their efforts to document hate and demand action. In the wake of the February 2021 ice storms that disrupted power grids across Texas, the Foundation provided funding to Caritas of Austin and the American Red Cross to aid community relief efforts. Promoting Civic Development In 2021, the COVID-19 pandemic continued to adversely affect nonprofit organizations and the way they provide services. Applied and the Foundation responded by providing infrastructural support to 94 community organizations, helping them become more efficient and grow their capacity to serve local needs, including through advocating for affordable housing and helping families in need access housing and income assistance. Through joint support from Applied and the Foundation, we hope to prevent families from becoming homeless and to fund supportive services and shelter for those who are already without a home. The following examples illustrate this approach in 2021: > In response to high numbers of homeless youth in Portland, Oregon, and Austin, Texas, the Foundation funded organizations such as New Avenues for Youth and LifeWorks, which help transition homeless youth to stable and safe housing. > In Silicon Valley, the Foundation provided financial support for the expansion of the Sunnyvale Community Services facility. With three times more space, the new building allows improvements in the management and delivery of current services and the opportunity to offer new support services to individuals and families. > In Arizona, the Foundation supported House of Refuge, Inc. and UMOM New Day Centers, Inc., which serve families in transition, provide safe housing and offer wrap-around services that help families become financially stable. > In India, Applied supported SOS Children’s Villages, an organization providing homes, nurturing care and educational support for children who have been abandoned or orphaned. INTRODUCTION PURPOSE Corporate Governance Ethics & Compliance Public Policy Data & IP Security Personal Data Privacy Community Impact PEOPLE PLANET PROGRESS
Sustainability Report 2021 24 Sustainability Report 2021 24 Fight Against Hunger The ongoing COVID-19 pandemic has exacerbated longstanding societal inequities, with historically excluded communities experiencing the most severe impact. In the first year of the pandemic, organizations working to alleviate food insecurity at the community level reported a 100% increase in demand for their services. While demand decreased slightly in 2021, it remained above historical norms, and food banks had to contend with additional pressures from high food and transportation costs, supply chain delays, and a lack of volunteers. To do our part in addressing these challenges, Applied employee teams across North America closed out the year with our annual Fight Against Hunger fundraising effort. During the campaign, which remained primarily virtual to prioritize health and safety, our employees raised $1.9 million, our most generous employee donation total ever. Adding a dollar-for- dollar match from the Applied Materials Foundation, we were able to distribute over $3.8 million to 52 food banks across the U.S. and Canada. Global Fight Against Hunger efforts continued throughout the year, often aligned with cultural and seasonal holidays in different countries. In Belgium, the Netherlands, Japan, and Taiwan, employee efforts benefited food banks. In Greece, our people supported The Smile of the Child’s work providing meals to children living in poverty. In India, employee giving targeted mid-day meals for students through the Akshaya Patra Foundation, as well as year- round support for orphans living in group homes. In China, our people filled and distributed food packages, and in Israel they supported the delivery of meals to Holocaust survivors. All these efforts reflect Applied’s values and purpose, aligning who we are with what matters to our employees and what’s needed in our communities. INTRODUCTION PURPOSE Corporate Governance Ethics & Compliance Public Policy Data & IP Security Personal Data Privacy Community Impact PEOPLE PLANET PROGRESS
Sustainability Report 2021 25 25 Generation Girl ® Initiative In a time of renewed focus on diversity and empowerment across industry and society, the Applied Materials Foundation’s Generation Girl ® initiative continued its efforts to ensure that girls have the opportunity to reach their full potential. The Generation Girl initiative works with nonprofit organizations throughout the United States to help girls gain the confidence, skills, and opportunities they need to succeed. In recognition of the fact that women of color remain the tech industry’s most underrepresented group, the program prioritizes funding for organizations serving Black, Latinx, and Indigenous girls as well as girls from low-income backgrounds. By working to break down societal and systemic barriers and develop talent in underrepresented communities, we can help make our future workplaces more vibrant, equitable and effective. During the grant period that began in September 2020 and ran through August 2021, the Generation Girl initiative provided close to $1 million to 28 nonprofit organizations serving girls in six U.S. regions where Applied maintains facilities, with 89% of funded programs focusing on girls in middle and high school. Foundation funding enabled grantees to deliver virtual, hybrid, and/or in-person after-school and summer programming and connect girls and their caregivers to local community service agencies to address need. All told, grantees were able to serve almost 6,000 girls, 69% of whom identify as Black, Latinx, or Indigenous and 64% of whom come from low-income backgrounds. While girls continued to face barriers to program participation—including cancellation of large in-person events, increased caregiving responsibilities, and virtual learning burnout—impact on the girls served remained strong, with over 75% of participants reporting growth in research- based girls empowerment outcomes, STEM interest, and STEM confidence. T Sustainability Report 2021 INTRODUCTION PURPOSE Corporate Governance Ethics & Compliance Public Policy Data & IP Security Personal Data Privacy Community Impact PEOPLE PLANET PROGRESS
Throughout 2021, the Foundation continued to facilitate learning through bimonthly meetings of the Community of Practice (CoP), in which representatives from the 30 grantee organizations met virtually to discuss common challenges, share success stories, and pursue partnership opportunities. In 2021, the group focused on the pandemic’s impact on girls, strategies for supporting girls who have experienced trauma, delivering service to hard-to- reach communities and plans to resume in-person services in various regions. All of the participating organizations gave these meetings high marks for fostering collaboration and a community of support during difficult times. Applied employee volunteers remain a vital component to the Generation Girl initiative, teaching girls about careers in the semiconductor industry and inspiring them to dream big. In 2021, Applied employees across the U.S. volunteered more than ever with girl-serving organizations such as the Society of Women Engineers–Santa Clara Valley, GirlStart, Girls on the Run Silicon Valley, Latinitas and the Girls Empowerment Network—conducting virtual career exploration sessions, serving as volunteer mentors, and leading online activities that introduce girls to microchips and more. The virtual environment helped break down regional barriers to volunteerism, connecting women engineers in Montana with high school girls in New Jersey, female technical project managers in Silicon Valley with aspiring coders in Austin, and remote college recruiting staff with young women pursuing computer science degrees across the U.S. In October, employees came together in celebration of International Day of the Girl to listen to leaders from Alliance for Girls and TechBridge Girls speak about the impact of the pandemic on girls in the U.S. They then turned that knowledge into action through participation in a mentorship forum with female high school students participating in the YesSheCan Campaign. A complete list of 2021 Generation Girl initiative grantees is available here . Generation Girl Initiative con t. #ChooseToChallenge In March 2021, Applied Materials employees responded to the year’s International Women’s Day theme #ChooseToChallenge by raising women’s voices and providing resources to help girls become confident leaders and innovators. From the U.S. to India, China, Taiwan, Japan, Korea, Singapore, and Israel, the company, our employees, and our Women’s Professional Development Network Employee Resource Group (ERG) hosted activities such as panel discussions on further cultivating Applied’s Culture of Inclusion, a working mom’s conversation, networking sessions, virtual volunteering opportunities, informational videos telling the stories of women at Applied, and daily stories and calls to action. 26 Sustainability Report 2021 INTRODUCTION PURPOSE Corporate Governance Ethics & Compliance Public Policy Data & IP Security Personal Data Privacy Community Impact PEOPLE PLANET PROGRESS
Sustainability Report 2021 27 27 Promoting Education Access To inspire young minds, prepare the next generation of innovators, and pave the way to more promising futures, Applied Materials and the Applied Materials Foundation work continuously to give students worldwide equitable access to high-quality education. In FY2021, Applied Materials and the Foundation provided $2,828,701 in funding to 63 educational initiatives. Throughout the year, as COVID-19 waves forced many schools to cycle between distance, hybrid and in-person learning, we remained flexible in our funding decisions. We listened to school and community leaders, and Applied and the Foundation jointly provided needed tools to reach kids where they are, address learning loss challenges and bolster teacher enthusiasm. Applied and the Foundation funded programs to address the mental health needs of kids returning to classrooms and supported high- quality STEM education programs so kids from all backgrounds and income levels can envision future careers in technology. Highlights at the local level included: > Flexible support in East San José, California. The Foundation worked closely with school districts and education nonprofits serving the predominantly working-class, immigrant families of East San José, who have been disproportionately impacted by the pandemic. Foundation grantees City Year San José/Silicon Valley and Catholic Charities offered in-person learning pods for children of essential workers and others while most students learned remotely. When schools reopened onsite, these organizations maintained their commitment to student learning through in-school support and after- school enrichment programs. > Professional development for teachers in Austin, Texas. In the Manor Independent School District, the Foundation funded a program that trains teachers in new strategies for equitably and effectively engaging students during distance learning. > Illuminating career pathways in Massachusetts. Foundation grantees including Leap for Education and Gloucester Marine Genomics Institute were able to offer in-person experiential learning and career exploration projects that introduced youth to career pathways while complying with public health guidelines. > Taking science programs online in Korea. Applied expanded our relationship with ChildFund Korea, providing funding to convert experimental science lessons to an online format for distance learning. > Improving online STEM access in Taiwan. Applied supported efforts by the Association of Taiwan Online Education Development to improve access to online STEM programs by creating science experiments and other online resources for 5th to 9th graders, all available free to teachers. Sustainability Report 2021 Austin Partners in Education Recognizes Applied Materials Foundation In Texas, Austin Partners in Education, a nonprofit organization working in partnership with the Austin Independent School District, named the Applied Materials Foundation as its Donor Champion of the Year for 2021, for its support of organizations promoting college readiness. Nicole Wayman, a 26-year Applied employee, was also named Volunteer of the Year for leading efforts to build an outdoor theater for McCallum High School, allowing students to conduct rehearsals and performances, attend lectures, and schedule club meetings safely during the pandemic. INTRODUCTION PURPOSE Corporate Governance Ethics & Compliance Public Policy Data & IP Security Personal Data Privacy Community Impact PEOPLE PLANET PROGRESS
Sustainability Report 2021 28 Sustainability Report 2021 28 Engaging Communities on the Environment Applied’s commitment to the environment goes beyond business practices and policies. Together with the Applied Materials Foundation, we leverage philanthropy to engage youth in the natural world and help communities build a more sustainable future for all. In FY2021, Applied Materials and the Foundation awarded $666,942 in grants to 37 nonprofits in this focus area. Together, Applied and Foundation grantee organizations pursued a mix of environmental advocacy and youth education and outreach activities, many of the latter conducted outdoors or virtually for COVID safety. > In Silicon Valley, the Foundation- supported organization Environmental Volunteers created “Walkable Field Trips,” designed to introduce school classes to nature in city parks and other open spaces without the need to use buses or public transportation. > In Israel, Applied supported an organic vegetable garden on the Pardesanut Museum grounds, which serves as an environmental education classroom for at-risk children. > In Germany, Applied supported the youth-led nonprofit Plant for the Planet in its reforestation work and efforts to teach children and adults about climate change and global justice. > Throughout the year, the Foundation continued to support teacher development in sustainability, urban forestry, citizen science and ecology. Through organizations like the National Wildlife Federation and Wild Basin in Austin, Texas; the Arizona Sustainability Alliance in Tempe, Arizona; and the Flathead Lake Biological Station in Montana, teachers were invited to explore, learn and take back meaningful experiences to their classrooms. In April, Applied’s annual EarthWorks campaign aimed to educate and inspire our global employees about ways to adopt sustainable practices and technologies in their daily lives, homes, and communities. Globally, Applied employees make those messages a reality year-round. INTRODUCTION PURPOSE Corporate Governance Ethics & Compliance Public Policy Data & IP Security Personal Data Privacy Community Impact PEOPLE PLANET PROGRESS
Sustainability Report 2021 29 Sustainability Report 2021 29 Funding Arts and Culture During COVID-19 The COVID-19 pandemic has had a devastating impact on arts organizations whose mission depends heavily on in-person programming. Following a year in which organizations pivoted with varying success to streaming and on-demand programming, 2021 saw many evolving to meet our greater understanding of COVID-19 transmission by offering experiential, often family-oriented and culturally diverse programming in a safer outdoor environment. To support those and other efforts, Applied Materials and the Applied Materials Foundation awarded $1,299,057 in grants to 67 nonprofits. Foundation-funded projects included: > The Waterloo Greenway Creek Show, which transformed a new, 11-acre public greenspace in downtown Austin, TX, through original, light-based artworks designed to evoke the natural environment of Waller Creek, the park’s centerpiece. > Alight on MARS, which transformed the grounds of Gloucester, MA’s Manship Artists Residency and Studios via site-specific sculpture and light works inspired by the area’s threatened firefly population. > The ICA San José (CA) Facade Project, which transformed the face of San José’s contemporary art gallery into art itself via monumental murals and artworks, with initial displays by Iranian-American artist Amir H. Falla and Detroit-based Ghanaian artist Conrad Egyir. > Centuries in the Making, an immersive light and sound installation, brought Gloucester, MA’s Fishermen’s Wives Memorial to life through recorded stories illuminating the wives’ strength and resilience over the centuries. Volunteering Virtually in Our Communities To promote civic engagement while simultaneously improving our people’s overall sense of engagement and purpose, Applied offered mostly virtual volunteering opportunities in 2021. From workshops where employees could learn about an issue, to virtual hands-on kit-building projects, to offering virtual career advice to youth, these opportunities were open to all Applied employees worldwide. By listening to community organizations about their real needs, we help assure that activities are truly meaningful and impactful for both the nonprofit and our people. INTRODUCTION PURPOSE Corporate Governance Ethics & Compliance Public Policy Data & IP Security Personal Data Privacy Community Impact PEOPLE PLANET PROGRESS Recognizing U.S. First Responders, Veterans, and Healthcare Workers Inspired by the 20th anniversary of 9/11, the Applied Materials Foundation joined with World Central Kitchen and 9/11 Day to deliver thank-you meals to first responders, healthcare workers, and veterans throughout the country.
Sustainability Report 2021 30 Invest in People We are building a deep-rooted Culture of Inclusion and fostering a diverse and skilled talent pipeline. INTRODUCTION PURPOSE PEOPLE Recruiting and Hiring Our Culture of Inclusion Learning and Development Employee Safety and Support During COVID-19 Occupational Health and Safety Human Rights PLANET PROGRESS
We are a diverse team of problem solvers. We embrace challenges, break barriers and work together to make the world a better place. We value diversity of thought, experience, culture and expertise because they strengthen our business and power the innovations that define our enterprise. At Applied Materials, our inclusive culture starts with each of us, from the boardroom to the cleanroom. We work hard to be a place where employees across every geography and discipline feel supported personally and professionally and have the resources to empower continuous learning and career growth. At Applied, our employees define their career paths with support from their managers and the organization, and we help provide the tools to amplify their impact—both as individuals and as managers and leaders. We value our people not just as employees, but as human beings, and support them in creating their best lives and focusing on what matters most. We provide access to benefits that promote health, wellness, financial security and workplace flexibility, and are absolutely committed to workplace and employee safety. Before, during, and after the COVID crisis, we take care of our people. Sustainability Report 2021 31 Sustainability Report 2021 31 We cultivate a culture where every person knows they belong, feels empowered to contribute to their full potential and is inspired to grow their career at Applied Materials. Invest in People KEY HIGHLIGHTS > Introduced a virtual onboarding process to ease new emplo yees’ glidepath onto the Applied team > Engaged 2,800 global employees and contingent workers in our virtual Global Culture of Inclusion Summit > Enlisted 87% of the Applied Leadership Group in an inclusive leadership program that raises consciousness, strengthens cultural competency and promotes courageous action > Implemented an alternate workplace location process to give employees greater flexibility > Provided all employees with supplemental sick time hours to respond to COVID-related issues > Received a 2022 Training APEX Award from Training Magazine, ranking sixth out of 95 companies Sustainability Report 2021 31 INTRODUCTION PURPOSE PEOPLE Recruiting and Hiring Our Culture of Inclusion Learning and Development Employee Safety and Support During COVID-19 Occupational Health and Safety Human Rights PLANET PROGRESS
Sustainability Report 2021 32 Sustainability Report 2021 32 Goals and Progress GOAL PROGRESS UN SDG Invest in People Increase women’s representation at Applied globally Increased representation from 17.8% to 18.1% (+0.3pp) Increase women’s representation at Applied in the U.S. to 21% by calendar year 2021 Increased representation to 21% in calendar year 2021 (20.8% in FY21), achieving our goal. Increase underrepresented minorities’ (URM) representation in our U.S. workforce Increased representation from 14.2% to 16.4% (+2.2pp) Maintain occupational health and safety total case incident rate (TCIR) of 0.42 or below Achieved a TCIR of 0.45 (industry TCIR was 0.70, based on U.S. Department of Labor Bureau of Labor Statistics 2018 Injury and Illness Rates) Our 2021 referral bonus increase contributed to a 4.4% increase in referral hires, rising from 17.4% (FY20) to 21.8% (FY21). “Engineers at Applied are encouraged to think the way others think cannot be done. So we dream big, think outside the box to make the impossible possible. We appreciate the difference of background, perspectives and experience. That diversity inspires engagement, creativity, and invention. People feel valued and respected and feel comfortable to contribute.” Cher, Senior Mechanical Engineer Manager Sustainability Report 2021 32 INTRODUCTION PURPOSE PEOPLE Recruiting and Hiring Our Culture of Inclusion Learning and Development Employee Safety and Support During COVID-19 Occupational Health and Safety Human Rights PLANET PROGRESS
Sustainability Report 2021 33 Sustainability Report 2021 33 Diverse Talent Recruitment Our diverse talent recruiting seeks candidates from the technology industry and related fields and attracts talented new college graduates (NCGs) from universities with strong engineering and science programs—including U.S. schools with large Black and Hispanic student populations. Through STEM education initiatives with colleges, universities and nonprofit partners serving middle and high school students, we are also building a pipeline of future talent. Over the past two years, we’ve pursued a range of initiatives and technologies to help us achieve our diversity goals: > Introducing a Diverse Talent Sourcing Platform that enables searches for diverse candidates > Rolling out a global Talent Selection Playbook that helps managers define their talent needs, then assess and select the most appropriate candidates > Doubling our referral bonus program to reward employees for recommending successful candidates for customer engineering and other technical roles > Expanding talent searches beyond our physical operating regions to broaden our potential talent pool > Recruiting military talent as they exit the U.S. services These initiatives and others have contributed to an increase in the representation of global women, U.S. women and U.S. URM employees at Applied. As leaders in the technology industry, our total commitment to inclusion and diversity informs and enables all our practices for attracting, recruiting, hiring and onboarding a top-performing workforce. In 2021, continuing pandemic challenges and a hyper-competitive labor market complicated the task of meeting our growing skill needs, especially in semiconductor technologies. Recruiting and Hiring Supporting the Everywhere Workplace In 2021, we implemented a new alternative workplace location process, enabling flexibility for our employees when personal circumstances arise. By supporting remote, flexible models, we are better able to recruit and retain the best talent for our teams. INTRODUCTION PURPOSE PEOPLE Recruiting and Hiring Our Culture of Inclusion Learning and Development Employee Safety and Support During COVID-19 Occupational Health and Safety Human Rights PLANET PROGRESS
Sustainability Report 2021 34 For the fourth year, Applied Materials was given the Excellence Employer award by China’s #1 jobs board, 51Job, recognizing our achievements in diversity and inclusion. “Applied Materials constantly seeks ways to improve as a company. Whether it’s addressing environmental and sustainability challenges, shrinking gender equity discrepancies, or promoting a more inclusive workplace, these efforts make me love working at a global company that listens to employees and leverages the various talents and diverse backgrounds that make up Applied’s culture.” Hadley Sales Account Manager Recruiting and Hiring in Challenging Times Throughout 2021, we adapted and expanded our recruiting, hiring and onboarding practices for a challenging labor and work environment. Our efforts included: > Applied New Hire Experience. As part of our MY HR portal, we introduced a virtual onboarding process that orients new hires to our values, mission, business organization, locations and other essentials, all via modules and notifications that promote better engagement and information retention. The system coordinates with the employee’s manager and a new-hire buddy, simplifying and standardizing the onboarding process. > New College Graduate Rotation Programs. To drive in-depth, cross- functional training, provide access to a global knowledge database and assure optimal placement of new hires, internal organizations including Supply Chain, Finance (Austin and Silicon Valley), and Implant (Gloucester) offered rotation programs that included mentoring, networking, skills development and hands-on experience across various areas of their operation. > Virtual Internships. In North America and globally, our virtual internship programs continued giving students exposure to our diverse and inclusive workplace and introducing them to career paths and roles in both engineering and corporate. In the U.S., we hired a total of 143 interns, 53% of whom were female. > China New Star Program. Spanning 12 Applied locations in China, this NCG program saw 13% female new hires in 2021. INTRODUCTION PURPOSE PEOPLE Recruiting and Hiring Our Culture of Inclusion Learning and Development Employee Safety and Support During COVID-19 Occupational Health and Safety Human Rights PLANET PROGRESS
Sustainability Report 2021 35 Sustainability Report 2021 35 Eliminate systemic barriers to inclusion Identify and break down systemic barriers to inclusion Engage and empower Inclusion Change Teams to break down barriers Leverage data to develop action strategies to inclusion In 2021, we made significant progress in strengthening our COI strategy, targets, training commitments and data disclosure, working toward our goal of moving to a higher level of DEI maturity as structured in the Global Diversity, Equity & Inclusion Benchmarks. At Applied Materials, we believe the future of work is one where diversity, equity and inclusion (DEI) are intrinsic to the organization, helping foster a growth- oriented mindset, build stronger and more resilient teams, and enable Applied Materials to innovate and succeed. Our Culture of Inclusion 35 “Applied Materials is operationalizing a Culture of Inclusion across every aspect of our company—every business group, every function, every process, every region. This is far beyond an HR initiative; it is fully integrated cultural transformation that will inform and drive our business strategy. By engaging leaders as champions of change, eliminating systemic barriers, and inspiring employees, we are creating a Culture of Inclusion where everyone—and hence, Applied—can reach our full potential.” Michelle Cooper Vice President of Culture of Inclusion Engage leaders as champions of change Make inclusion personal for leaders Define metrics and leader accountability for change Operationalize inclusion in all we do Ensure talent practices are inclusive Accelerate strategies for finding, selecting, placing, developing, and retaining talent Measure qualitative and quantitative progress COI Strategy: Foundation and Roadmap INTRODUCTION PURPOSE PEOPLE Recruiting and Hiring Our Culture of Inclusion Learning and Development Employee Safety and Support During COVID-19 Occupational Health and Safety Human Rights PLANET PROGRESS
Sustainability Report 2021 36 Sustainability Report 2021 Applied Inclusion: It Starts with Me While leaders play a central role in driving organizational change, making that change sustainable takes everyone, at every level of our global enterprise. It means embracing change as a philosophy, not just tweaking the tactics and strategies of the past. At its most basic level, it’s about breaking the cycle of looks-like-me hiring, going beyond expectations of background, education and experience to see new possibilities. However, DEI has to be more holistic than just talent, embracing an expansive and empathetic mindset that not only sees but seeks the value in difference and works toward that ideal in everything we do, including: > Identifying more diverse suppliers > Respecting and celebrating all individuals > Creating safe spaces where all voices can be heard > Reinventing our culture to value a healthier work/life balance > Embedding that culture of respect, empathy, and collaboration across our strategy and business processes 2021 Global Culture of Inclusion Summit While the definition of diversity may vary from country to country, the concepts of equity and inclusion are universal and set us up for a future of greater collaboration, innovation, and financial performance. That was the message of our October 2021 virtual Global Culture of Inclusion Summit, which netted the participation of more than 2,800 global employees and contingent workers. Around the world, from the U.S. and Europe to China, India, Singapore, Taiwan, Korea, and Japan, Applied’s teams hosted speakers and local training on topics such as developing an inclusive mindset, learning and operationalizing the traits of Inclusive Leadership, overcoming multi-generational issues, reducing identity-covering in the workplace, and becoming an LGBTQIA+ ally. Featured speakers at the summit included: > Pulitzer-winning journalist and author Isabel Wilkerson (The Warmth of Other Suns, Caste: The Origin of Our Discontents) > Veteran astronaut Dr. Ellen Ochoa, the first Hispanic and second female director of the Johnson Space Center > Retired Army General Stanley McChrystal, former commander of the U.S. Joint Special Operations Command and U.S. forces in Afghanistan > Lori N. McKenzie, lead strategist for Diversity, Equity & Inclusion at Stanford Graduate School of Business and cofounder of the Stanford VMware Women’s Leadership Innovation Lab 36 INTRODUCTION PURPOSE PEOPLE Recruiting and Hiring Our Culture of Inclusion Learning and Development Employee Safety and Support During COVID-19 Occupational Health and Safety Human Rights PLANET PROGRESS
Sustainability Report 2021 37 “Through WE TDP 2 , I gained the confidence to speak up, the courage to say yes to possibilities, and the spirit to lift up others and myself.” Sharon Product Manager Growing a Diverse Workforce In FY2021, as the tight global talent market made our strategic efforts to retain and recruit diverse talent even more imperative, we posted several notable gains: > The percentage of underrepresented minorities in our U.S. workforce increased by 2.2 percentage points (pp) year over year, rising from 14.2% to 16.4%. > Globally, women’s representation in our workforce increased by 0.3pp, rising from 17.8% to 18.1%. > Women’s representation in our U.S. workforce increased by 0.6pp, from 20.2% to 20.8% 1 . > Women’s representation among global leadership increased 1.0pp, from 11.2% to 12.2%. Additionally, we continue to make progress in increasing women’s representation at the customer support and technician level. See Diverse Talent Recruitment earlier in this chapter for additional information. Sustainability Report 2021 37 INTRODUCTION PURPOSE PEOPLE Recruiting and Hiring Our Culture of Inclusion Learning and Development Employee Safety and Support During COVID-19 Occupational Health and Safety Human Rights PLANET PROGRESS 1 We reached the goal of 21% by the end of CY2021 2 Women in Engineering Talent Development Program (WE TPD)
Sustainability Report 2021 38 FY2021 U.S. Workforce Gender, Ethnicity, and Race Representation by Employee Level Executives Vice Presidents and Directors Managers People Managers Professionals Business, Engineering and Sales Career Bands Women Asian Black Hispanic/Latinx Other URMs* White 12.7% 46.0% 1.0% 2.6% 1.10% 48.9% 40.5% 11.3% 1.0% 2.0% 0.80% 55.6% + 1.4% + 5.5% 0% – 6.7% + 0.6% + 0.3% 49.6% 19.0% 34.9% 4.7% 8.2% 2.4% 12.4% 61.7% 29.0% 3.1% 5.3% 0.7% – 12.1% + 6.6% + 5.9% + 1.7% + 1.6% + 2.9% 2.4% 40.9% 26.8% 45.6% 2.9% 7.4% 48.9% 1.1% 24.1% 40.6% 2.9% 6.4% + 1.3% – 8.0% + 2.7% + 1.0% + 5.0% 0% 2021 2016 INTRODUCTION PURPOSE PEOPLE Recruiting and Hiring Our Culture of Inclusion Learning and Development Employee Safety and Support During COVID-19 Occupational Health and Safety Human Rights PLANET PROGRESS * Underrepresented minorities
Sustainability Report 2021 39 2016 2018 2019 2017 2021 18% 10.8% 11.7% 12.2% 12.4% 12.9% 13.2% 12.7% 12.2% 11.6% 11.4% 15.5% 14.6% 14.5% 15.4% 16.5% 15.7% 14.9% 14.8% 15.6% 16.7% 18.8% 19.3% 19.5% 20.2% NA EMEA APAC U.S. Women Global Women 2020 18.3% 15.6% 20.8% 2016 2018 2019 2017 2021 2020 13.5% 13.9% 2016 2018 2019 2017 2021 18% 10.8% 11.7% 12.2% 12.4% 12.9% 13.2% 12.7% 12.2% 11.6% 11.4% 15.5% 14.6% 14.5% 15.4% 16.5% 15.7% 14.9% 14.8% 15.6% 16.7% 18.8% 19.3% 19.5% 20.2% NA EMEA APAC U.S. Women Global Women 2020 18.3% 15.6% 20.8% 2016 2018 2019 2017 2021 2020 13.5% 13.9% Female Representation by Region 2016–2021 Improved Gender Diversity in Engineering Women in Engineering Talent Development Program Our Women in Engineering Talent Development Program (WE TDP) is focused on supporting the career growth of female technical talent at Applied. This two-year development program offers resources to support a select group of high-potential U.S. women in engineering-related roles through networking opportunities, conference participation, professional skill development workshops, career development roundtables, and mentoring programs. Women are nominated by their managers annually. Membership in WE TDP tends to correlate with increased retention, and many WE TDP alumni and year-two members have received promotions. Sustainability Report 2021 39 INTRODUCTION PURPOSE PEOPLE Recruiting and Hiring Our Culture of Inclusion Learning and Development Employee Safety and Support During COVID-19 Occupational Health and Safety Human Rights PLANET PROGRESS
Sustainability Report 2021 40 Engaging Leaders as Champions of Change As our Culture of Inclusion effort intensifies, Applied Materials’ leaders are investing in their own awareness as an essential component of driving change. In 2021, we launched our virtual, half-day Inclusive Leader Summits, experiential learning opportunities designed to reinforce and extend last year’s learnings about leading courageously on race and racial equity. Targeted at the 400 members of our Applied Leadership Group (ALG), the workshops achieved an 87% attendance rate, including leadership from our Europe and Israel operations. Fifteen of our U.S. leaders also participated in a pilot Coaching for Inclusion program through the Berkeley Executive Coaching Institute. Building on previous diversity training that focused on gaining a deeper understanding of inclusion challenges and making inclusion personal, the Berkeley program is designed to give leaders the skills and tools to learn across difference to drive meaningful, sustainable change. Its focus includes: > Building core capabilities and helping leaders develop an authentic leadership presence around DEI > Building empathy and an understanding of how DEI issues affect oneself and others > Becoming more conscious of how personal behaviors can unintentionally reinforce unproductive dynamics The program is delivered via an initial two- day session, coaching, independent study, and a follow-up workshop. For 2022, we intend to take this program global, training three cohorts of 21 leaders apiece, including in our Asia-Pacific operation. Our Inclusive Leader Action Guide, introduced in the first half of 2021, continued to serve as a resource for our executive staff and people managers, providing pragmatic strategies and best practices for becoming more inclusive leaders, partners, and change catalysts. These efforts build on changes introduced in prior years to help our leaders take Applied Materials in the direction we need to go— such as introducing diversity dashboards that allow U.S. leaders to track progress against diversity goals for each organization, and tying executive compensation directly to the achievement of our diversity objectives via our Corporate Scorecard. Our COI progress is shared on a quarterly basis with our Board of Directors. Over the past several years our Board itself has grown more diverse, and now consists of 40% women and 30% people of color. Workforce Diversity Recognition Applied Materials is consistently recognized for our efforts around workforce diversity and military veteran recruitment. Military Friendly Employer 100%-plus overall rating, exceeds every standard U.S. Veterans Magazine Top Veteran-Friendly Company Human Rights Campaign Foundation Corporate Equality Index, 100% overall rating Best Places to Work for LGBTQ+ Equality Woman Engineer Magazine Top 50 Employers INTRODUCTION PURPOSE PEOPLE Recruiting and Hiring Our Culture of Inclusion Learning and Development Employee Safety and Support During COVID-19 Occupational Health and Safety Human Rights PLANET PROGRESS
Sustainability Report 2021 41 2021 Inclusion Highlights Throughout 2021, the majority of our employees participated in DEI learning opportunities, including virtual, on-demand courses focused on three areas: > The Inclusive Manager Toolkit : Explains actions managers can take to increase inclusion, engagement, and team performance, with an emphasis on understanding unconscious bias, awareness of micro-messages, and creating psychological safety. > Inclusive Virtual Meetings: Examines challenges and best practices for facilitating inclusive virtual meetings. > Unconscious Bias and Micro-inequities: Explores the social stereotypes individuals can unintentionally internalize. The training challenges participants to test their automatic assumptions, move from micro- inequities to micro-affirmations, and be mindful of the ARTS of Inclusion: Appreciation, Respect, Trust and Sensitivity. Employee Resource Groups An integral part of the Applied Materials experience since 2001, our ERGs provide forums for learning, exchanging ideas, strengthening bonds across and within our employee communities, and advising our leaders’ efforts to remove systemic barriers to inclusion. Today, our network includes eight ERGs with 25 global chapters: > Applied PRIDE > Asians in Motion > Hispanics in Partnership > Leadership Encouraging Achievement through Diversity and Black Employee Network > Male ERG for Equity > Veterans Employee Team > Women’s Professional Development Network > Young Professionals Network “I am celebrating Hispanic Heritage Month by participating in the various fun and cultural activities we have organized with the Hispanics in Partnership employee resource group. I feel responsible to pay it forward by volunteering as a board member with two nonprofits, the Hispanic Foundation of Silicon Valley and the Montalvo Arts Center, both dedicated to educating and engaging the Latinx community.” Stuardo Senior Director, Strategic Marketing INTRODUCTION PURPOSE PEOPLE Recruiting and Hiring Our Culture of Inclusion Learning and Development Employee Safety and Support During COVID-19 Occupational Health and Safety Human Rights PLANET PROGRESS Sustainability Report 2021 41
Sustainability Report 2021 42 Sustainability Report 2021 42 Applied Materials’ employees also came together virtually for events designed to drive the progress of our Culture of Inclusion and recognize the cultural heritage and diverse experiences of our workforce. Many of these events were presented in partnership with our Employee Resource Groups (ERGs), which represent a range of diverse employees within Applied. LEAD Book Club As part of our 2021 virtual celebration, nearly 350 Applied attendees welcomed activist and diversity educator Jane Elliot for a candid conversation about today’s racial justice issues. Post-event, attendees launched the Leadership Encouraging Achievement through Diversity (LEAD) book club to continue learning and growing together with others in the Applied Materials community. Several books were reviewed and discussed throughout the year. Pride Month Applied Materials stands in solidarity to support LGBTQIA+ rights. In keeping with Applied’s annual recognition of PRIDE month, in 2021, employees again raised the rainbow flag at our headquarters in Silicon Valley and more than a dozen other Applied sites worldwide. With support from our ERGs and regional sites, we also hosted virtual learning sessions on allyship, the dimensions of gender, and “LGBTQIA+ 101,” plus virtual and in-person networking events, lectures, and panel discussions. AIM U.S. Events As part of Asian-American and Pacific Islander (AAPI) Heritage Month and amidst an increase in anti-Asian violence in the U.S., Asians In Motion (AIM) hosted a speaker event on recognizing AAPI bias and promoting inclusion. AIM also hosted a talk with prominent Asian leaders in the company to discuss career development. In 2021, more than 65% of Applied’s managers and employees completed on-demand inclusion training, exceeding our target of 50%. 2021 Inclusion Highlights con t. INTRODUCTION PURPOSE PEOPLE Recruiting and Hiring Our Culture of Inclusion Learning and Development Employee Safety and Support During COVID-19 Occupational Health and Safety Human Rights PLANET PROGRESS
Sustainability Report 2021 43 Sustainability Report 2021 43 WPDN U.S. Events Throughout the year, various chapters of our Women’s Professional Development Network (WPDN) hosted and sponsored events focused on women’s advancement and inclusion and diversity, including National Instruments’ Womens’ Network’s “Defining Your Success” panel discussion, which engaged 214 attendees from seven technology companies. WPDN Israel Events Events to promote workplace equity and support local communities included a “Let’s Talk about Gender in the Workplace” workshop that allowed employees to discuss the main challenges from both male and female perspectives and gave participants advice for leading change. A “Strength Finders” workshop provided an opportunity for participants to discuss their strengths and the challenges that women face in the workplace. WPDN Asia Pacific Events To celebrate International Women’s Day month, WPDN members sponsored a digital engagement series showcasing inspiring professional stories from women at different career stages across Applied Materials Southeast Asia. At Applied Materials India, employees organized week-long speaker sessions focused on disability, gender, and cultural diversity, along with a panel discussion on moving beyond tokenism at the workplace. Our WPDN India chapter launched a talent development program and one-on-one coaching exclusively for women employees. Veterans Community Service Through the nonprofit Rebuilding Together Silicon Valley (RTSV), our Veterans ERG brought together a group of employees to help repair and revitalize the home of a local veteran in need. | Applied Materials Confidential The Homeowners & Crew – After 2021 Inclusion Highlights con t. INTRODUCTION PURPOSE PEOPLE Recruiting and Hiring Our Culture of Inclusion Learning and Development Employee Safety and Support During COVID-19 Occupational Health and Safety Human Rights PLANET PROGRESS
Sustainability Report 2021 44 Sustainability Report 2021 44 Applied Materials creates growth and development opportunities that support an engaged and inclusive workforce that can propel our business into the future. All training is coordinated centrally and aligned with common objectives through Applied Global University (AGU), with business units and functions providing technical and job-specific training and the corporate level providing more general professional, management, and leadership training. Since the onset of the pandemic in 2020, the vast majority of our training has been virtual. Our training and development capabilities also include state-of-the- art training modalities such as AI-based simulations and Augmented and Virtual Reality (AR/VR) learning capabilities. In- person, instructor-led training is offered when there is significant benefit, consistent with applicable COVID safety protocols. At every level, assessment and development is conducted in the context of both current and future role requirements. Our PATHWAY program helps our employees create personalized learning journeys, while our technical talent receives additional specialized opportunities to develop knowledge and skills. Training programs for managers and executive leadership facilitate preparation for progressive roles and support our leadership pipeline. New College Graduate Mentorship Program In 2021, we piloted our New College Graduate (NCG) Mentorship Program to accelerate NCGs’ early-career development, broaden their professional networks, and provide a beyond-content-knowledge learning experience. The pilot program paired 180 participants, matched based on their professional profiles, program goals, skills, and interest across multiple business units and job families. Throughout the six- month program, mentors and mentees were enrolled in a self-guided course in which they planned, engaged with, and reflected on their mentorship sessions. With a program effectiveness rating of 87%, the mentorship pilot has generated meaningful conversations on career goal setting and Applied’s vision, mission, and leadership, and has furthered our culture of coaching and professional development. Using the takeaways from the pilot, our next phase will be working with stakeholders to design custom mentorship programs for various internal organizations and regions. Learning and Development “As a recent graduate, I enjoy being in an engineering role that directly aids new product development. At Applied Materials, I get to work with a diverse group of very talented individuals and have access to many educational resources. Both have been instrumental to growing my interpersonal and technical skills.” Sonia Semiconductor Products Group INTRODUCTION PURPOSE PEOPLE Recruiting and Hiring Our Culture of Inclusion Learning and Development Employee Safety and Support During COVID-19 Occupational Health and Safety Human Rights PLANET PROGRESS
Sustainability Report 2021 45 PATHWAY: Personalized Employee Development Applied Materials recognizes continuous learning and skills development as an essential component of growth and success, for both our employees and our company. The integrated PATHWAY learning program helps drive that growth and success by empowering employees to create a personalized learning journey to fine-tune their existing skills and build capacity for the future. By letting our people browse and select courses mapped to their role- related skills, development plan, and skill topics critical to the company, and by giving recommendations for role-based self- directed learning, PATHWAY helps foster our culture of continuous improvement and employee support. To meet their requirement of completing 40 learning hours in each fiscal year, employees may supplement required and elective PATHWAY coursework with university-level coursework, professional accreditation or continuing-education workshops, or independent study of research papers. In early 2022, we added a skill goal feature to PATHWAY designed to increase employee engagement and motivation around skill-building. During 2021, 15,762 Applied employees accessed and participated in PATHWAY training, and we held our second annual Virtual Learning Summit, designed to bring together our learning community and spotlight the importance we place on learning. During the two-day event, over 3,500 employees attended sessions focused on building skills with purpose, intention, determination, and action. #6 in Training Magazine’s 2022 Top 100 Rankings PATHWAY Vision and Development Guidance Transparency Proficiency • Skill Goal feature to increase motivation and engagement through learning new skills • Skill Journeys for focused, in-depth skill learning • Appraise and track employee proficiency with new skills • Dashboards that support skill development through more in-depth and precise learning and skill progress SKILL BUILDING LEARNING STRATEGY INTRODUCTION PURPOSE PEOPLE Recruiting and Hiring Our Culture of Inclusion Learning and Development Employee Safety and Support During COVID-19 Occupational Health and Safety Human Rights PLANET PROGRESS
Sustainability Report 2021 46 Manager Development Our required manager development curriculum equips our people for more complex challenges and requirements as they move up the management chain. For example, First-Time Manager development includes facilitated workshops and guided implementations covering both general and company-specific knowledge and skills, including relationship- and team-building strategies, coaching tools, HR systems and processes, and techniques for managing conflict, facilitating decision-making, and influencing up and across the organization. In addition to the enterprise-wide core curriculum, targeted programs support regional and business-specific development needs. In 2021, we continued our successful Manager Capability Forums, conducting multiple virtual sessions that supported managers in implementing key company change initiatives, including our voluntary retirement program and Paid Time Off to Flexible Time Off transition. We also completed our inaugural Manager Team Effectiveness (MTE) pilot program, a four- to six-month program of training, coaching, and practice where managers learn what makes a great team, how to diagnose what their team needs, and how to implement tangible improvements. Executive Leadership Development We apply a powerful, research-based, role- relevant, and globally applicable framework and tool set to serve as the foundation for leadership pipeline assessments, selection, placement, development, and coaching. Executive development plans place priority on situational leadership and inclusive leadership, and key framework metrics include: > Diversity among our leadership team and pipeline of future leaders > Percentage of executive leadership successors with development plans > Percentage of executive leadership roles with more than one ready-now successor Our Applied Leadership Group (ALG) provides our senior leaders (Managing Directors, VPs) with learning and development opportunities around strategic thinking, communication/networking, and tools and techniques to support company scaling and growth. These opportunities expose leaders to key strategic and execution opportunities and challenges and position them to make faster and better business decisions. The ALG meets on a quarterly cadence. Technical Talent Development Applied provides ongoing opportunities for our technical talent to build greater skills and knowledge related to their roles and interest areas, including: > Technical skill training for a given role or area of interest > Product training hosted by the product business units > Deep-dive technical reviews and webinars facilitated by internal and external experts Technical talent may also attend and present at virtual and in-person conferences. Our own Engineering and Technology (ET) Conference, the company’s longest-running tech learning and development event, brings together Applied engineers from our global locations to exchange ideas on processes, equipment, and support services and collaborate to solve high-value problems with differentiated solutions. Held annually, the global ET Conference is preceded by regional conferences across our global geographies. Learn more about our Learning and Development program here . INTRODUCTION PURPOSE PEOPLE Recruiting and Hiring Our Culture of Inclusion Learning and Development Employee Safety and Support During COVID-19 Occupational Health and Safety Human Rights PLANET PROGRESS
Sustainability Report 2021 47 2021 Learning Hours Using the efficient virtual training tools we developed and deployed in response to COVID-19 (supplemented with in-person training where necessary and safe), we were able to meet our corporate training objectives and goals for 2021. One hundred percent of our leaders, executive-level vice presidents, and managers completed training in 2021, and 99% of full-time employees completed role-related and additional training. Our new-hire completion rate for Standards of Business Conduct training was 98%, with the remaining 2% receiving reminders until they fulfill their obligation. Information on ethics and compliance training is provided here . For additional details and breakdowns, see the Report Annex . FY 2021 Total Individual Learners (regular full-time employees) 27,335 Total Individual Learners (total workforce) 42,223 Total Learning Hours 1,740,492 COMPLETED TRAINING BY ROLE (UNIQUE LEARNERS) Executive-Level Vice Presidents 170 Executive-Level Directors 1,703 Manager Level 2,708 Individual Contributors 22,649 Interns 105 2021 Learning Hours INTRODUCTION PURPOSE PEOPLE Recruiting and Hiring Our Culture of Inclusion Learning and Development Employee Safety and Support During COVID-19 Occupational Health and Safety Human Rights PLANET PROGRESS
Sustainability Report 2021 48 Sustainability Report 2021 48 With our business deemed essential, the majority of our global manufacturing, lab, and customer-focused employees continued to work in person at Applied locations or customer sites. To keep our employees healthy and informed, we maintained elevated on-site safety protocols and proactively communicated the evolution of those protocols as the Delta and Omicron variants surged and waned. We offered a suite of health and wellness benefits to address our people’s physical and mental needs and maintained programs to support work-from- home employees through the complexities of melding work and home life, such as caring for school-age children and elders. At our sites in Austin, Gloucester, and Kalispell, we worked with local health departments to host multiple COVID-19 vaccination opportunities. In a November 2021 employee survey, 87% of respondents reported high satisfaction with Applied Materials’ response to the challenges created by COVID-19, nearly 90% gave positive marks on role expectation clarity, and nearly 80% reported positively on receiving regular manager check-ins and recognition. Throughout 2021, we evolved a number of programs and added new benefits based on our people’s needs during COVID: > Announced an expansion of our 100% paid family care and parental leave policies to 12 weeks, effective January 1, 2022 > Began defaulting all U.S. employees to short-term disability insurance to assure wage replacement in case of illness > Implemented supplemental sick time hours to support employees with COVID-related situations > Implemented virtual healthcare access across the U.S. through Crossover > Allowed carryover of unused childcare funds in flexible spending accounts > Added additional mindfulness, stress- reduction and wellness content to our virtual offerings through Applied Global University > Introduced a virtual Health Fitness 360 program, offering content on nutrition, fitness, yoga and stress management, as well as livestreamed classes led by trainers from our Austin gym > Added a stipend to cover tech expenses for our work-from-home employees These policy changes add to efforts begun in year one of the pandemic, which included standardized sick time across U.S. exempt and nonexempt categories, additional support for working parents, a suite of health and wellness benefits, and a pay-continuity policy for employees unable to work on-site due to compromising health conditions. For more details on Applied’s standard benefits, see here . Helping Our People Clear Student Debt In 2021, we announced a new program that offers up to $2,000 in student debt repayment assistance annually to non–highly compensated employees (NHCEs). The first payments from this program were disbursed to over 200 employees’ student loan debt lenders in February 2022. INTRODUCTION PURPOSE PEOPLE Recruiting and Hiring Our Culture of Inclusion Learning and Development Employee Safety and Support During COVID-19 Occupational Health and Safety Human Rights PLANET PROGRESS Employee Safety and Support During COVID -19 In year two of the COVID-19 pandemic, the safety of our employees and their families remained one of our top priorities.
Sustainability Report 2021 49 Sustainability Report 2021 49 Safety Training Rate For FY2021, Applied Materials met our target for 97% of relevant employees to complete safety training by year-end. Weekly safety training penetration reports, across all business units, are sent to all members of executive management as part of the weekly EHS Update Report. Safety Targets and Performance Applied Materials maintains global programs and monitoring to promote a safety culture and safe work practices, minimize workplace risks, and support continuous improvement in our safety performance. We use the definitions set by the U.S. Department of Labor’s Occupational Safety and Health Administration (OSHA) for recordable, lost-time, and restricted-day injuries. These definitions are implemented globally for data gathering and analysis, and we set targets and objectives both at the corporate and site level, which are embedded into annual performance objectives. At the end of each year, we analyze results and reset targets for the coming year. To prioritize safety, many of our factories employ 6S, a lean manufacturing concept that empowers employees to assess and enhance functionality and safety in their work areas. After introducing 6S in 2019, injury rates fell by 35% in our semiconductor manufacturing operations. Applied Materials places high priority on the safety of our workforce, suppliers, and customers. We are committed to complying with or exceeding all regulatory requirements relevant and applicable to the health and safety performance of our operations, processes, and products. Occupational Health and Safety INTRODUCTION PURPOSE PEOPLE Recruiting and Hiring Our Culture of Inclusion Learning and Development Employee Safety and Support During COVID-19 Occupational Health and Safety Human Rights PLANET PROGRESS
The main types of work-related injury accidents are strains, sprains, and fall-related incidents. TCIR is calculated as (total number of OSHA Recordable injuries and illnesses x 200,000) / total hours worked by employees. DART rate is calculated as (total number of DART incidents x 200,000) / total hours worked by employees. LTSR is calculated as (total number lost workdays x 200,000) / total hours worked by employees. Work-Related Injury Rates Health and Safety Violations In 2021, Applied received three notices of violations worldwide. Find additional information on Applied’s Occupational Health and Safety Program here . Total Case Incident Rate (TCIR) In FY2021, Applied achieved a TCIR of 0.45, well below the industry benchmark of 0.60, but just above our goal of 0.42. Sustainability Report 2021 50 INTRODUCTION PURPOSE PEOPLE Recruiting and Hiring Our Culture of Inclusion Learning and Development Employee Safety and Support During COVID-19 Occupational Health and Safety Human Rights PLANET PROGRESS FY 2021 FY 2020 FY 2019 Total Case Incident Rate (TCIR) 0.45 0.33 0.43 Days Away, Restricted, or Transferred Rate (DART) 0.35 0.23 0.29 Lost Time Severity Rate (LTSR) 4.44 3.70 3.63 Fatalities 0 0 0
Sustainability Report 2021 51 Sustainability Report 2021 51 > Publishing our first Human Rights Statement of Principles > Forming a cross-functional Human Rights Working Group within our larger ESG governance structure to lead our Corporate Human Rights Program > Partnering with a third party to begin our first human rights salience assessment, as recommended by the UN Guiding Principles on Business and Human Rights At this writing, we are in the process of completing the salience assessment, which combines desk research with internal and external stakeholder engagement to identify and prioritize potential human rights risks, impacts, and opportunities related to our business, and provide recommendations for a future roadmap for human rights management. We look forward to sharing the outcome of this assessment and our roadmap in next year’s sustainability report. See the Occupational Health and Safety section of this report for additional information on employee working conditions and policies. See Supply Chain Responsibility for our commitment to protecting human rights in our supply chain. Non-Discrimination Policy Applied Materials is committed to providing a workplace that is free of discrimination, harassment, and retaliation. We do not tolerate harassment based on race, color, national origin, ancestry, religion, age, sex, sexual orientation, gender identity, marital status, physical disability, mental disability, medical condition, genetic information, family care leave status, union membership, veteran status, or any other basis prohibited by law. Our Non-Discrimination Policy protects employees who have lodged good-faith reports of possible ethical issues or policy violations, or participated in any investigation, proceeding, or hearing. The policy addresses conduct, complaint procedure, supervisory responsibilities, responsive action, and supplemental state-specific rules. Beginning in June, 2021 and proceeding into 2022, Applied Materials took several significant steps toward formalizing our commitment to protect human rights wherever we do business. These included: Human Rights Sustainability Report 2021 51 INTRODUCTION PURPOSE PEOPLE Recruiting and Hiring Our Culture of Inclusion Learning and Development Employee Safety and Support During COVID-19 Occupational Health and Safety Human Rights PLANET PROGRESS
Sustainability Report 2021 52 Protect our Planet We respect the planet as we shape the future. INTRODUCTION PURPOSE PEOPLE PLANET Climate and Energy Environmental Health and Safety PROGRESS
Sustainability Report 2021 53 Sustainability Report 2021 53 The latest report from the United Nations Intergovernmental Panel on Climate Change (IPCC) advises that our window to keep global warming well below 2° Celsius in pursuit of 1.5° is closing rapidly, and the current trajectory for global emissions reductions is not going to get us there. At Applied, we recognize we have a unique opportunity to accelerate the transformation to a sustainable digital economy. At the same time, we embrace our responsibility to significantly reduce our own environmental impacts. In 2021, we gained a more holistic picture of those impacts by quantifying our Scope 3 emissions inventory. This paves the way for setting validated science-based targets in alignment with the Paris Agreement. We also completed Phase 2 of our Climate Risk Assessment, giving us more insight into climate-related risks to our business. These insights help inform the strategic investments and operational improvements to grow our resilience for a rapidly evolving climate. In alignment with the Task Force on Climate Related Financial Disclosures (TCFD), we are sharing insights from this analysis below and in our 2021 Report Annex , along with insights from the physical risk assessment we completed in 2020. As our energy demands increase with the expansion of our facilities and increasing production demands, we continue to drive strong progress against our global 100% renewable electricity goal. We are 80% of the way toward our goal in the U.S., primarily through leveraging partnerships with community choice aggregators (CCAs) and purchasing renewable energy certificates (RECs) through our utility providers. Now, with our White Mesa Wind Virtual Power Purchase Agreement (VPPA) operational, we are well positioned to reach our U.S. renewable electricity sourcing goal and offset a large portion of our U.S. footprint. We are working to reduce our footprint as we advance technology to accelerate a sustainable digital economy. Protect our Planet KEY HIGHLIGHTS > Reported our carbon impact and risks in line with TCFD recommendations > Quantified our 2019 Scope 3 emissions inventory baseline. Conducted and achieved third-party assurance > Reduced Scope 1 and Scope 2 (market-based) emissions by 28%, progress that was accelerated by a Virtual Power Purchase Agreement with White Mesa Wind, Texas > Generated more than 286 MWh of renewable electricity on-site at our facilities in Singapore, Texas, India, and China Sustainability Report 2021 53 INTRODUCTION PURPOSE PEOPLE PLANET Climate and Energy Environmental Health and Safety PROGRESS
Sustainability Report 2021 54 Goals and Progress GOAL PROGRESS UN SDG Protect our Planet 100% of our electricity globally comes from renewable sources by 2030, with an interim goal of 100% in the U.S. by 2022 57% of our global and 80% of our U.S. electricity comes from renewable sources 50% reduction in Scope 1 and Scope 2 CO 2 e emissions by 2030, from 2019 baseline Scope 1 and Scope 2 CO 2 e emissions declined 28% in 2021, contributing to a 31% total reduction from our 2019 baseline Sustainability Report 2021 54 “Applied is delivering against bold, industry- leading goals with 3x30 and SuCCESS2030. Now, with the quantification of our Scope 3 emissions inventory for semiconductor products, we have an even more complete picture of our carbon footprint to help inform and deliver on our commitment to set science- based targets for Scope 1, 2, and 3 emissions reductions, in line with what the latest climate science shows is necessary to limit global warming well below 2° Celsius in pursuit of 1.5°C.” Scott Hambleton Managing Director of EHS at Applied Materials INTRODUCTION PURPOSE PEOPLE PLANET Climate and Energy Environmental Health and Safety PROGRESS
Sustainability Report 2021 55 Sustainability Report 2021 55 Climate Risks Applied Materials monitors current and emerging climate-related risks on an annual basis. Responsibility for identifying company- wide and site-specific risks rests with a core team of global emergency response, crisis management, and business continuity personnel, as well as local facilities teams and Environmental Health and Safety (EHS) and Sustainability teams. Our risk identification, mitigation and management plans help ensure our ability to recover quickly from climate-related events and effectively support our customers’ and suppliers’ operations. For the past two years, we have engaged a third party to conduct a Climate Risk Assessment to identify key physical and transition risks and opportunities in line with TCFD recommendations. In 2020 we completed Phase 1, which assessed Applied Materials’ physical risks utilizing three different Representative Concentration Pathways (RCPs) representing low-, moderate-, and high-risk climate change scenarios for 2019 (baseline), 2030, and 2050. The assessment considered Applied’s risk exposure across our global operations by identifying our highest-risk assets and operations based on various chronic and acute geographical climate hazard indicators. Phase 2 of the Climate Risk Assessment concluded in March 2022, providing insights on Applied’s projected transition risks associated with the shift to a low- carbon economy between 2025 and 2050. Benchmarked against our industry peers, the assessment gauges relative risk levels across four key areas in which climate risk mitigation/adaptation strategies may shift asset values and raise business and compliance costs: policy and legal, market, reputation and technology. See the TCFD Index in our Report Annex for assessment results. INTRODUCTION PURPOSE PEOPLE PLANET Climate and Energy Environmental Health and Safety PROGRESS Climate and Energy Although our overall energy use rose by approximately 7% in 2021, driven by both the addition of new facilities and increased production at our existing sites, we still managed to reduce our overall Scope 1 and 2 emissions footprint by 28%. Given the strong and increasing demand for our products, we anticipate continued robust growth over the coming decade and are taking steps to limit the environmental impacts of that growth.
Sustainability Report 2021 56 Scope 1 and 2 Emissions The largest part of our Scope 1 and 2 footprint is traceable to the power needs of our factories and labs, which represent our primary opportunity for change. To keep us on track toward our 100% renewable electricity commitments (U.S. by 2022, global by 2030), we are partnering with an energy consultant to develop a renewable energy strategy and expand our renewable energy portfolio. In 2021, Applied Materials’ Scope 1 and 2 emissions totaled 93,272 metric tons of carbon dioxide equivalent (CO 2 e), a 28% decline from 2020 driven primarily by our new VPPA for wind energy in west Texas. Our Scope 2 (market-based) emissions fell to 49,290 CO 2 e in 2021, a 38% decrease from 2020. However, our location-based emissions rose, primarily due to the opening of new Applied office buildings in California, new manufacturing facilities in Singapore, production expansion in Taiwan and overall production and business growth to meet unprecedented demand in the semiconductor industry. Air emissions from our R&D processes are treated with point-of-use abatement units and facility scrubbers before being discharged to the atmosphere, consistent with local or regional air permit requirements. EPA Green Power Partnership > National Top-100 User of Green Power > Top-30 Tech and Telecom > Fortune 500® Partners INTRODUCTION PURPOSE PEOPLE PLANET Climate and Energy Environmental Health and Safety PROGRESS
Sustainability Report 2021 57 Powering Growth with Renewables The accelerating digitization of the global economy is creating urgent demand for semiconductors, and Applied Materials is mobilizing our enterprise to deliver the equipment and expertise to meet that demand. At the same time, we understand our success as a business must not come at the expense of the climate and environment. That’s why we are continually seeking new opportunities in the low-carbon economy, such as entering into a Virtual Power Purchase Agreement with White Mesa Wind, a new, 500-megawatt wind project in Crockett County, Texas. Combining the generating power of 180 turbines, White Mesa began commercial operations on October 22, 2021, delivering clean power to offset a large percentage of our U.S. footprint. As our business grows, we will continue innovating operational efficiencies and seeking new renewable energy projects to fulfill our climate commitments. Sustainability Report 2021 Renewable Energy In 2020, Applied Materials committed to 100% renewable electricity use in the U.S. by 2022 and globally by 2030. Our global renewable energy strategy enables achievement of those targets via three complementary approaches: > On-site solar power generation: Applied Materials maintains on-site solar generating capacity at our facilities in Singapore; Austin, TX; Bangalore, India; and Xi’an, China. Combined, these arrays generated 286 MWh of clean power in 2021. > Utility green procurement programs: Direct purchase of renewable energy from a utility provider. > Virtual Power Purchase Agreements: Financial contracts with external solar, wind, and other renewable energy generating projects reduce our Scope 2 emissions inventory by delivering clean power to the grid. Each Renewable Energy Certificate (REC) provided by project owners represents the environmental benefits of 1MWh of electricity generated from renewable sources. In 2021, Applied used over 245,000 MWh of green power from a combination of these sourcing strategies, representing 80% of our total U.S. and 57% of our total global electricity needs for the year. We continue to evaluate further renewable energy projects and in 2021 began partnering with sustainability consultant 3Degrees to define a roadmap for expanding our renewable electricity supply globally and reaching our 2030 100% renewable electricity goal. Renewable Electricity Use Over Time 57 2019 2020 2021 42% 41% 80% 37% 37% 57 % % Global Renewable % US Renewable INTRODUCTION PURPOSE PEOPLE PLANET Climate and Energy Environmental Health and Safety PROGRESS
Sustainability Report 2021 58 Scope 3 Emissions In early 2022, we completed our 2019 Scope 3 emissions inventory baseline. Among the 15 categories defined by the Greenhouse Gas Protocol, Category 11, Use of Sold Products, represents by far our largest share of Scope 3 emissions. This category denotes the combined total emissions from all Applied semiconductor products sold during a reporting year (including emissions from both the technology’s energy draw in customer fabs and the chemicals and gases used in operational processes), estimated over the average lifetime of those products. Category 1, Purchased Goods and Services, represents a large portion of Applied’s estimated supply chain emissions and is the second largest contributor to our Scope 3 footprint. There is no semiconductor industry standard for measuring Category 11 emissions, but we have chosen to build on the SEMI S23 standard (related to energy, utilities, and material use efficiency) to model our tools’ energy consumption and estimate Category 11 emissions. For the purposes of our assessment, we include emissions not only from sold products but also from certain non-Applied ancillary and sub-fab equipment required for the tools’ operation, such as pumps, cooling systems, and point- of-use abatement systems. Our calculation assumes an average 10-year product lifespan across all Applied tools and technologies. However, because customers and third parties frequently extend the life of Applied products through refurbishment (a plus for circularity and reuse, but a complication for GHG accounting), we will continue to review and refine our estimates and assumptions. Semiconductor products represent the vast majority of Applied’s annual product sales. In next year’s report we will expand our Category 11 calculations to include our sale of Display products’ emissions. Calculating our 2019 Scope 3 baseline inventory was just the beginning. Applied will continue to review our Scope 3 methodology each year to continuously refine the calculations, emissions factors, data, estimates and underlying assumptions aiming to replace Environmentally Extended Input–Output (EEIO) with primary data wherever possible, and we will report any resulting changes and implications. A complete overview of our Scope 3 methodology can be found here . Though strategies adopted in pursuit of our 3x30 and SuCCESS30 goals are already driving reductions across our largest Scope 3 categories, we are currently evaluating science-based targets (SBTs) across Scope 1, 2, and 3 emissions to align our goals with the latest climate science. To achieve the greatest impact in reducing emissions from the use of sold products, we will pursue collaboration across the semiconductor industry to (a) align on standards for measuring semiconductor product emissions and (b) collectively implement initiatives to drive down emissions in line with SBTs. INTRODUCTION PURPOSE PEOPLE PLANET Climate and Energy Environmental Health and Safety PROGRESS
Using Remote Tools to Reduce Emissions COVID-19 limitations on travel have sped the adoption of distance-collaboration technologies, enabling both efficiencies and emissions reductions. In addition to videoconferencing and online training, Applied Materials is employing tools like Microsoft’s HoloLens mobile holographic device to enable remote testing and troubleshooting. Using HoloLens, customer site personnel and our remote technicians can collaborate instantaneously to address issues, reducing air travel and its associated time, expense, and emissions—not to mention potential weeks spent in quarantine. As a company, we traveled 86% less by mileage in 2021 compared to 2019. Scope 3 Emissions: 2019 Baseline MT CO 2 e % OF TOTAL SCOPE 3 (2019 BASE YEAR) 1. Purchased goods and services 1,862,516 15% 2. Capital goods 61,953 1% 3. Fuel- and energy-related activities 36,012 0% 4. Upstream transportation and distribution 155,478 1% 5. Waste generated in operations 531 0% 6. Business travel 97, 9 5 3 1% 7. Employee commuting 76,751 1% 8. Upstream leased assets 2,601 0% 9. Downstream transportation and distribution 191,577 2% 10. Processing of sold products NA 0% 11. Use of sold products 9,610,156 79% 12. End-of-life treatment of sold products 713 0% 13. Downstream leased assets NA 0% 14. Franchises NA 0% 15. Investment 5,584 0% Scope 3 Total 12,101,823 100% Sustainability Report 2021 59 INTRODUCTION PURPOSE PEOPLE PLANET Climate and Energy Environmental Health and Safety PROGRESS
Sustainability Report 2021 60 Sustainability Report 2021 60 Environmental Health and Safety Our emissions reduction efforts are only one part of Applied Materials’ overall commitment to reducing our environmental impacts. Throughout our global operations, we also work continuously to reduce waste, conserve resources, promote safe and healthy work environments for our people and demonstrate environmental leadership in our communities. Our labs and manufacturing facilities account for the largest share of our global energy and water consumption. Throughout 2021, new conservation, efficiency, and recycling/reuse programs at individual Applied facilities complemented our existing corporate-level initiatives. To help reduce consumption within the semiconductor industry, we are working with our customers on our ambitious 3x30 goals, which include boosting manufacturing efficiency and driving a 30% reduction in equivalent energy consumption for our semiconductor products. EHS Policies, Systems, and Governance Applied Materials’ Environmental Health and Safety (EHS) policy commits our company to protect the environment. The policy is signed by our President and CEO, distributed to all Applied locations globally, and referenced often during site team and management meetings. Our EHS organization is an integrated entity with teams responsible for EHS in on-site operations (including construction, fire and life safety, and contractor safety), hazard and risk identification, customer site support operations, emergency preparedness, environmental management and product safety. These efforts are supported by company management and guided by our EHS policy. The Board’s Corporate Governance and Nominating Committee receives a report on EHS and sustainability matters each quarter and a more in-depth environmental and sustainability update annually. We implement our EHS policy through our Environmental Health and Safety Management System (EHSMS), which conforms with international management system standards such as ISO 14001, ISO 45001, the U.S. Department of Labor’s Occupational Safety and Health Administration (OSHA) Voluntary Protection Program (VPP), and EHS documentation to the requirements of ISO 9000. See here for more information on ISO certifications for our manufacturing sites. “Applied is a company where everyone is equal to express themselves and there are many opportunities to expand your unique skills. In my role I enjoy working with my colleagues to understand the technology advances we are making and to help us all stay safe along the way, ultimately achieving an incident- and injury-free company culture.” Shin Environmental, Health & Safety INTRODUCTION PURPOSE PEOPLE PLANET Climate and Energy Environmental Health and Safety PROGRESS
Sustainability Report 2021 61 EHS Management System MAXIMIZING ENERGY EFFICIENCY AND REDUCING EMISSIONS > Conserving energy > Supporting renewable energy ENSURING SAFE WORK ENVIRONMENTS > EHS policies and procedures > Safe chemicals policy > Appropriate engineering controls DESIGN FOR SAFETY AND THE ENVIRONMENT > Improving resource efficiency > Designing durable / reusable / recyclable products > Designing efficient facilities > Designing safe products REDUCING WASTE > Minimizing product and packaging materials > Reuse and recycling CONSERVING NATURAL RESOURCES > Using recycled materials > Using process water INTRODUCTION PURPOSE PEOPLE PLANET Climate and Energy Environmental Health and Safety PROGRESS
Sustainability Report 2021 62 Sustainability Report 2021 Energy Management Applied Materials is committed to maximizing energy performance and minimizing consumption through: > Continuously monitoring energy use and conducting energy audits > Building optimal energy efficiency into all new facility construction, such as through LEED or Green Mark certification > Purchasing energy-efficient new equipment > Optimizing the temperature of chilled water used in our operations > Transitioning to 100% renewable electricity in the U.S. by 2022 and worldwide by 2030 After several years of relatively flat energy usage, Applied’s energy use increased approximately 7% in 2021 over 2020 as both our operational footprint and demand for our products grew. See the Climate and Energy section of this report for more on Applied’s emissions and renewable power commitments. Conservation, Efficiency, Renewables, and Reuse Projects, Worldwide In 2021, energy and waste reduction efforts produced significant results at multiple Applied Materials sites around the world: > In Gloucester, MA, energy saving measures including air-flow, chiller, and boiler optimizations and LED lighting retrofits saved 1,379,213 kWh in 2021, while the site’s wind turbine delivered 5,801,148 kWh of energy. > Our facility in Xi’an, China, converted 180 light panels in newly reopened offices to LED, saving up to 41k kWh per year, and the facility’s installed solar capacity generated 39,836 kWh in clean electricity. > In Taichung City, Taiwan, replacement of T5 fluorescent tubes with LED lighting produced a savings of 26,700 kWh in 2021. Reuse of wooden crate packaging is preventing half a ton of wood per month from going to landfill. Installation of a new pipeline and flow meter is reclaiming 1 ton of cooling tower water daily for reuse in flush toilets. > Our Israel facilities made efficiency improvements to lighting, air handling units, chillers, and variable speed drives (for pumps). Two cafeterias replaced disposable cups and spoons with reusables, saving approximately 1.2 million cups per year. > At our Santa Clara, CA and Austin, TX facilities, our COVID protocols included replacing manual restroom fixtures with sensor-activated models, reducing touchpoints while also optimizing water use. Sustainability Report 2021 62 INTRODUCTION PURPOSE PEOPLE PLANET Climate and Energy Environmental Health and Safety PROGRESS
Sustainability Report 2021 63 Waste Management Applied is committed to minimizing waste across our locations and logistics operations, with a special focus on non-recyclable, landfill-bound waste. Waste reduction, reuse, and recycling programs are managed at the site level and have been successful in minimizing waste generation (for example, by reducing printed documentation), increasing reuse and recycling of product and packaging materials, sorting recyclables at point of disposal, and maximizing composting of organic materials from our cafeteria operations. Waste management targets are set for individual manufacturing sites based on the ISO 14001 framework and are reviewed on an ongoing basis and scored annually. In 2021, we increased our diversion rate from landfill/incineration from 75% in 2020 to 76% in 2021 and achieved a 12% reduction in hazardous waste generation. However, our non-hazardous waste generation increased by 50% due to increased activity at our manufacturing sites and better data reporting. See the Design for Sustainability section for information on our responsible product and packaging initiatives. Hazardous Waste Management: Hazardous waste accounted for 2% of our annual waste output in 2021. We contract with licensed third parties to transport waste (including hazardous waste) for off-site disposal, consistent with applicable laws and regulations. Our EHS organization provides oversight of third-party hazardous material disposal companies and verifies that all disposal sites and methods meet regulatory requirements. We also evaluate potential vendors via the CHWMEG Facility Review Program, which provides environmental, operational, and financial information on waste treatment, disposal, recycling, and storage facilities. Wastewater Management: Applied strives to reduce the negative impacts of wastewater produced by our operations, monitoring to ensure sufficient removal of solids and adherence to permitted parameters (e.g., pH and fluoride content) before discharge to publicly owned treatment works. Each Applied facility is responsible for wastewater monitoring, with problems escalated to the site management team and applicable corporate staff for immediate correction. METRIC TONS TOTAL WASTE GENERATION 22,900 Diversion rate 76% TOTAL NON-HAZARDOUS WASTE 22,500 Diverted non-hazardous waste 12,800 Non-hazardous waste to landfill/incineration 5,400 Compost 4,200 2021 Waste Performance INTRODUCTION PURPOSE PEOPLE PLANET Climate and Energy Environmental Health and Safety PROGRESS
Sustainability Report 2021 64 Water Management Although Applied’s operations are not high- volume water consumers relative to our industry, we strive to optimize our water use. Our R&D labs account for our highest consumption of ultrapure water, followed by our manufacturing operations, routine use at our offices, and landscape irrigation around our properties. In manufacturing, only a few of our toolsets require significant water, with others relying on efficient closed-loop systems. In 2021, our total water withdrawal increased by 23.5% over 2020. The increase is a result of increased groundwater usage due to piping modifications and replacements in our Santa Clara facilities. However, we were able to decrease our use of irrigation water by 25%. Facilities groups are responsible for water use management at specific Applied sites, with oversight from the company’s EHS organization. Our Managing Director of EHS is responsible for ensuring that water-related risks and minimization opportunities are assessed as appropriate. Water reduction is covered under our EHS policy and ISO 14001 EHSMS, which call for our business operations to identify opportunities, make continual improvements on environmental preservation and natural resource conservation, and meet or exceed all relevant regulatory requirements. Our water conservation efforts include: > Designing water-efficient products, following best practices for tool design and specifications for water use outlined in SEMI industry requirements > Water recycling and reuse for non- potable applications, especially cooling and landscape irrigation > Rainwater collection for use in landscaping or non-production needs (at our Singapore Operations Center and Tainan Manufacturing Center 2) > Drought-tolerant landscaping and smart irrigation to reduce the number of watering days Sustainability Report 2021 64 INTRODUCTION PURPOSE PEOPLE PLANET Climate and Energy Environmental Health and Safety PROGRESS Water Performance (ML) 2019 TOTAL WATER WITHDRAWAL (ML) 2020 2021 0 500 1000 1500 2000 2500 3000 1,962 ML 2,035 ML 2,512 ML
Innovate for Progress We empower transformative innovation that improves technology in harmony with resources. INTRODUCTION PURPOSE PEOPLE PLANET PROGRESS Design for Sustainability Promoting the Circular Economy Product Safety Supply Chain Responsibility
Sustainability Report 2021 66 We embrace our unique opportunity to shape and empower a more inclusive and sustainable future by effecting change across the technology industry. Equally, we own our responsibility to lessen our environmental impacts and enable our customers’ and suppliers’ impact reductions. In 2021, global supply chain disruptions coupled with an explosive demand in the semiconductor industry put historic pressures on our business. Yet we continued to deliver on commitments to our customers, suppliers, and the planet, driving solid progress against our 3x30 and SuCCESS2030 goals. Our Design for Sustainability Center of Excellence, now in its second year, is proving to be an invaluable sustainable innovation engine to accelerate energy efficiency improvements and water, waste, and chemicals reductions across our product portfolio. Furthering our commitment to circular innovation, we are expanding our efforts to keep tools in use longer by improving their repairability and growing our portfolio of recovered and refurbished service parts. We invest in innovating better, more sustainable, and right-sized packaging options that use less material and have multiple useful lives. Our suppliers are integral to achieving our sustainability and social impact agenda. We offer training and resources to help our suppliers deliver on our ESG expectations and conduct periodic supplier audits and assessments to verify their compliance. Our commitment to advancing diversity, equity, and inclusion extends to our supply chain. We are expanding our network of suppliers to better reflect the communities we serve and to unleash the power of diversity in all aspects of our innovation. Innovate for Progress KEY HIGHLIGHTS > Partnered with customer TSMC to create a system to verify the efficacy of energy-saving improvements > Conducted 86 webinars in two time zones to help suppliers close gaps across our ESG focus areas > Launched Design for Distribution task force to improve planning and development of smarter packaging strategies using less materials and/or materials that are more reusable and recyclable > Saved 271,000 pounds of crate materials through new, lighter-weight crates (on track to save 1 million pounds by end of 2022) > Piloted Logistics Tracking System to track, collect, and return packaging materials for reuse Sustainability Report 2021 66 INTRODUCTION PURPOSE PEOPLE PLANET PROGRESS Design for Sustainability Promoting the Circular Economy Product Safety Supply Chain Responsibility
Sustainability Report 2021 67 Goals and Progress GOAL PROGRESS UN SDG 3x30 Goals Reduce equivalent energy consumption for semiconductor products by 30% by 2030 Set energy consumption baseline for semiconductor products (2019 basis) and completed key energy use models Reduce chemical consumption for semiconductor products by 30% by 2030 Completed first-in-industry chemical impact analysis and began leveraging results to improve tool and process design Reduce tool footprint per production unit ratio (sqm/wph) for semiconductor products by 30% by 2030 Achieved 10%+ reduction in square foot per wafer pass on selected new and existing semiconductor product platforms GOAL PROGRESS UN SDG SuCCESS2030 Goals* Transition the supply chain to recyclable content packaging, with a target of 80% by end of 2023 In 2021, we achieved approximately 75% recyclable content for targeted plastics and corrugated fiberboard packaging materials Eliminate phosphate-based pretreatment of metal surfaces by 2024 where feasible Pilot trials exploring a process of pretreating metal surfaces for rust protection using zinc oxide were successfully completed in 2021. Increase the percentage of spend with, and representation of, women- and minority-owned businesses by 2024 Met our goal of increasing diverse supplier spend by at least 2% year on year, through new and newly onboarded diverse suppliers Comply with RBA Code of Conduct and Applied Materials’ Standards of Business Conduct Required 33% of our high-risk direct suppliers to undergo an RBA external audit in 2021 (intend to grow to 50% of high-risk direct suppliers and 10% of high-risk indirect suppliers in 2022) * SuCCESS2030 goal regarding shipping was removed due to the unique supply chain challenges faced by the company. Applied will continue to monitor for opportunities to address emission reductions in freight in the future. INTRODUCTION PURPOSE PEOPLE PLANET PROGRESS Design for Sustainability Promoting the Circular Economy Product Safety Supply Chain Responsibility
Sustainability Report 2021 68 Sustainability Report 2021 68 Design for Sustainability A better future needs to be a more sustainable future. Our ten-year 3x30 goals focus on meeting that aspiration in our semiconductor business by working to reduce the high energy and chemical impacts of semiconductor manufacturing industry-wide. Since 2018, all in-development product lines from our Semiconductor Products Group (SPG) have reflected Design for Sustainability (DfSu) methods and principles, starting from the drawing board to innovate longer-lasting systems that consume fewer resources and are more easily reusable or recyclable. Working with our customers, we are continuously improving the efficiency of our existing hardware and software to make their manufacturing operations cleaner and greener. Our comprehensive, industry-leading effort encompasses three core elements: > Our Design for Sustainability Center of Excellence (CoE), which provides design support for more sustainable technologies and processes > A proprietary modeling tool that quantifies the energy, chemical, and footprint impacts of past, present, and future tool designs > Customer partnerships to innovate efficiencies in our tools and processes, boost industry-wide sustainability, and deliver broad benefit to the planet Applied is globally certified to ISO 9001:2015 for quality management. Click here for additional certifications. “Applied Materials provides many opportunities to collaborate with some of the best and brightest in the silicon industry who have driven node advancements for several decades. In my current role, I enjoy building upon that expertise in advancing novel semiconductor device technologies and enabling emerging applications. The way we identify process challenges and innovate to address them makes Applied a unique place where I can thrive.” Shiva Strategic Marketing Manager INTRODUCTION PURPOSE PEOPLE PLANET PROGRESS Design for Sustainability Promoting the Circular Economy Product Safety Supply Chain Responsibility
Sustainability Report 2021 69 Design for Sustainability Center of Excellence Within Applied’s Systems Engineering organization, our Design for Sustainability Center of Excellence (DfSu) analyzes both in-design and existing semiconductor product sets to identify new reduction opportunities for energy, water, waste, and chemicals. This design support expands our product groups’ responsibilities beyond traditional performance attributes to include sustainability performance—adding new features to our existing portfolio of energy- saving product enhancements, passing on substantial energy saving opportunities to our customers, and modeling sustainability leadership industry-wide. In Bengaluru, India, the DfSu concept and prototyping lab works closely with our U.S. product design teams on development work dedicated to improving sustainability performance. The DfSu has developed a library of solutions that contribute to improved sustainability in Applied’s products, created 3x30 metrics to normalize comparisons between tools and business units, and promoted standardized methodologies to drive energy/chemical use reductions. In 2021, these efforts included: > Designing gas panels to reduce exhaust flows by 50% to 80% > Evaluating new chiller and heat- exchanger technologies to reduce energy and water consumption > Modifying process chamber lid designs for reduced coolant flow > Testing and evaluating alternative heat- transfer/cooling fluids to reduce our equipment’s GHG footprint and comply with regulations and restrictions around high global warming potential (GWP) refrigerants > Evaluating next-generation and alternative components created by outside suppliers to quantify their impact on our overall system footprint and drive operational efficiencies > Quantifying the impact of using new green components to drive adoption of more sustainable solutions Growth Technical Advisory Board (GTA B) Led by our CTO and comprised of technology experts from industry, academia, and government, Applied Materials’ GTAB advises on ways our products and technologies can address challenges, create opportunities, and enable a better future. Sustainability Report 2021 69 INTRODUCTION PURPOSE PEOPLE PLANET PROGRESS Design for Sustainability Promoting the Circular Economy Product Safety Supply Chain Responsibility
Sustainability Report 2021 70 Chemical Impact Metric Modeling Sustainability and Efficiency Designed in-house, our web-based modeling tool analyzes design and end-user data to pinpoint sustainability improvements for legacy, in-production, and design- stage semiconductor manufacturing tools. Modeling efforts support our 3x30 goals of reducing energy use, chemical consumption, and the equipment’s physical footprint to increase throughput density per square foot of cleanroom space. By modeling tools early in the design process, our product design engineers gain the data they need to reduce a tool’s projected resource consumption and other environmental impacts before the tool goes into production. Analysis of existing tools supports identification of process efficiency improvements that we can communicate to our customers to boost sustainability performance in their fabs. In 2021, we completed an effort to set energy consumption baselines (2019 basis) for our complete line of SPG semiconductor products, a process that will help drive further improvement and also inform calculation of our Scope 3 emissions in Category 11 (use of sold products). In addition, we completed our first-in- the-industry chemical impact analysis and began leveraging the results to improve tool and process design, including efforts to reduce, eliminate, and/or replace the most negatively impactful chemicals used by our tools. Baselining our chemical impacts in GHG equivalents also contributes to our Scope 3 assessments. UPSTREAM IMPACTS POST- ABATEMENT EMISSIONS CRADLE - TO - GATE GATE - TO - GATE DIRECT PROCESS DRAINS (IF PRESENT) ABATEMENT DRAINS DRAIN IMPACTS By-product Chemicals Abatement Process Chamber Chemical Production & Transportation Sustainability Report 2021 70 Sustainability Report 2021 70 INTRODUCTION PURPOSE PEOPLE PLANET PROGRESS Design for Sustainability Promoting the Circular Economy Product Safety Supply Chain Responsibility
71 ANOMALY DETECTION > Overlay of process & subfab information > Integration of existing sensors Sustainability Report 2021 Customer Partnerships to Drive Industry- Wide Change Through our focus on improving the sustainability performance of new and existing tools, Applied Materials is helping semiconductor manufacturers realize substantial energy savings, meet their own sustainability goals and shrink the industry’s overall energy and chemical footprint. Applied continues to partner with one of our key customers, TSMC, to create a system able to verify the efficacy of energy-saving improvements developed as part of the ISO 50001 standard for energy management. Leveraging our iSystem TM controller, the new software conducts automated measurement of power usage from the operation of semiconductor fabrication tools, gauging actual energy use against a baseline. This system is currently undergoing testing. Earlier TSMC energy-saving measures developed from iSystem TM data have resulted in annual electricity savings of 5.1 million kWh, GHG reductions of 9,700 MT CO 2 e, and cost benefits of US$2.4 million. In 2021, we continued to reduce area per wafer pass on Metal Deposition products (>30%), ALD products (>25%), and Etch products (>15%). As we develop new tools, upgrade existing systems and create advanced service products, we proactively communicate their potential for cost reductions, yield improvements and sustainability benefits to our customers. OLED Displays: Superior Viewing and Efficiency To take next-generation technologies mainstream, manufacturers need the tools to simplify fabrication, drive down production costs, and make consumer prices competitive. That’s what we offered them in the 2000s, when our equipment helped usher in the era of flat-panel LCD displays to replace older CRTs. Now Applied’s advanced manufacturing tool suites are doing it again for revolutionary OLED mobile, TV, and computer displays, which offer superior image quality, cooler running temperatures, and lower energy consumption. iSystem ™ Gas Usage Reporting iSystem ™ Energy Reporting iSystem ™ Energy Savings iSystem ™ Anomaly Detection iSystem ™ Sleep Mode ACHIEVE ENERGY SAVINGS - Idle & sleep modes - Dry pumps & abatement including backup - Continuous improvement ENERGY PERFORMANCE REPORTING - Performance reports & Subfab Equipment KPIs - Baseline & Savings Auto-calculation (ISO50001) - Precisely manage energy usage & sub-fab operation ANOMALY DETECTION - Overlay of process & subfab information - Integration of existing sensors - Detection of trends ENERGY PERFORMANCE REPORTING > Performance reports & Subfab Equipment KPIs > Baseline & Savings Auto-calculation (ISO50001) > Precisely manage energy usage & sub-fab operation ACHIEVE ENERGY SAVINGS > Idle & sleep modes > Dry pumps & abatement including backup > Continuous improvement INTRODUCTION PURPOSE PEOPLE PLANET PROGRESS Design for Sustainability Promoting the Circular Economy Product Safety Supply Chain Responsibility
Sustainability Report 2021 72 Sustainability Report 2021 72 Promoting the Circular Economy Applied Materials works to promote the circular economy vision by eliminating waste through design, creating efficiencies across the product lifecycle, and employing materials that can be reused or recycled at the end of a product’s functional life. Remanufacturing Semiconductor Systems and Parts Our systems are designed to last, to support upgrades and repurposing for new applications, and to be easily repairable if parts fail or performance falls below acceptable standards. All newly manufactured parts are engineered for greater repairability, and we use refurbished parts whenever possible for repair and remanufacture, contributing to sustainability and cost-effectiveness. Expanding repairability: By reviewing all parts for the potential to repair, we’ve grown the percentage of repaired parts we use to service tools under contract from 65% to more than 70% over the past three years. In a cross-functional effort, new parts are identified for potential repairability during new product introductions, and our service engineering group identifies used parts that can be confirmed for repair. We continue to look at parts that come into contact with process chemicals for potential repair or cleaning/reuse solutions. Recovery and reuse: Within AGS, a dedicated team specializes in recovering parts and assemblies from the market and reconditioning them for reuse, thereby reducing our manufacturing operation’s need for virgin materials. Each recovered part goes through an exacting process of inspection, decontamination, refurbishment, and repair, and is then recertified by AGS as “like new” for reuse and recirculation, with a full warranty and the same service level as a new part. On average, 40% of the parts used for servicing Applied Materials tools have been refurbished after previous use in an Applied system. We are constantly improving our refurbishment processes to grow that number by encompassing more part categories—for example, electrostatic chucks, whose reuse rate has increased 11% over the past three years. We maintain one of the industry’s largest global inventories of spare parts, with recovered parts searchable in our inventory management system and ready to be pulled for cleaning and reconditioning. “Coming from a technology startup where you’re able to be extremely entrepreneurial in each of your initiatives, I thought I might face more limitations coming into a large, established corporation. Pleasantly, I found the opposite to be true. Applied has a culture of openness to different perspectives and new ways of tackling challenges.” Amy Marketing Communications INTRODUCTION PURPOSE PEOPLE PLANET PROGRESS Design for Sustainability Promoting the Circular Economy Product Safety Supply Chain Responsibility
Sustainability Report 2021 73 Enabling Recycling of Flexible Packaging At our Flexible Technology Group business unit in Germany, our sales, business development and design functions are working with customers to develop new solutions to increase the recyclability of food packaging materials. Spurred by impending regulatory targets for reducing packaging waste, companies are committing to a full transition to biodegradable, recyclable, or renewable materials within the decade, and leveraging Applied’s expertise with roll-to-roll vacuum coating systems to help them get there. The focus of this work is using our tools to create single-polymer alternatives (e.g., all-polypropylene pouches) to multilayered aluminum-and-polymer films, making food packaging easier to sort and recycle. Through our own innovation and multiple partnerships, we are: > Improving barrier protection on BOPP, CPP, PE, BOPE, and MDOPE films to allow mono-polymer solutions > Using new, advanced BOPP polymers in combination with Applied’s vacuum- coated barrier to achieve results comparable to aluminum foil, with greater recyclability > Exploring new Metacoat and Nexus topcoating and metallization options to gauge their effect on recyclability > Exploring barrier papers that are both renewable and biodegradable > Using our oxide coating technology to enable barrier improvements on pouches made from BOPEF film, a 100% bio-based polyester created from renewable feedstocks Food packaging extends shelf life and prevents food waste, which already accounts for as much as one eighth of global GHG emissions. Through these and other next-generation solutions, we are helping to build a circular economy that retains that embedded value while mitigating packaging’s effects on our land, seas, and resources. Building a Circular Economy for Flexible Packaging Applied Materials is a member of CEFLEX, a collaborative initiative representing the full value chain of flexible packaging. CEFLEX stakeholders have endorsed a five- step roadmap to building a circular economy for flexible packaging, together with needed actions in each part of the value chain to make it happen. In early 2022, CEFLEX proposed some revisions of its framework to align the industry in anticipation of global action on packaging waste. Now many activities are in the implementation phase. 1 2 3 4 5 Drive a collection of all flexible packaging for sorting and recycling Sort and recycle the suitable mono-material fractions Redesign multi-material flexible packaging to mono-materials with existing recycling streams where possible Identify solutions and develop capabilities to sort and recycle the remaining fractions End markets for all recycled flexible packaging materials INTRODUCTION PURPOSE PEOPLE PLANET PROGRESS Design for Sustainability Promoting the Circular Economy Product Safety Supply Chain Responsibility
Sustainability Report 2021 74 Sustainability Report 2021 74 Applied Materials develops and implements comprehensive product design, manufacturing, labeling, and testing policies and programs to ensure our products are safe to use and comply with applicable legal requirements and industry standards and guidelines. Third-party assessments validate that our products meet applicable safety requirements. We follow all relevant country- and region- specific requirements. For example, products distributed in China are marked with a mandatory “China RoHS 25” label to comply with the administrative measure on the control of pollution from electronic information products. Products sold in the European Union comply with regional manufacturing and labeling requirements, including the CE mark affirming conformity with European health, safety, and environmental standards. Products sold in the UK bear the similar UKCA (UK Conformity Assessed) mark. Relevant products sold in South Korea are tested to ensure compliance with KC mark requirements (related to electromagnetic compatibility and electrical safety requirements). Any business unit or group that develops, sells, or distributes products is required to design and engineer those products to protect both the user’s personnel and facilities and the environment from exposure to risks, and that any residual risks remain below a minimum acceptable level when the products are operated, maintained, and serviced in accordance with the instructions and information provided to the user. Our Product Safety group partners with other company functions to oversee the design of products and services, monitors their safety during the product’s lifecycle, and drives compliance with our product safety policy and procedures. Our risk-assessment process follows the applicable SEMI S10 industry risk assessment guideline. In 2021, we enhanced our risk assessment procedure to consider additional risks and address these risks during the product design and manufacturing process. Product Safety INTRODUCTION PURPOSE PEOPLE PLANET PROGRESS Design for Sustainability Promoting the Circular Economy Product Safety Supply Chain Responsibility
Sustainability Report 2021 75 Sustainability Report 2021 75 Supply Chain Responsibility In 2021, the global supply chain crisis, global semiconductor shortage, and ongoing COVID-19 pandemic affected our supply chain operations in ways large and small but did not prevent us from achieving progress on our supply chain goals. Throughout the year, we also saw a significant uptick in employee and team investment, enthusiasm, and shared responsibility around achieving the goals of our SuCCESS2030 initiative, a 10-year roadmap for extending our sustainability vision across the supply chain for our semiconductor and display businesses. Under SuCCESS2030, our assessments of supplier performance and capabilities require shared commitments in five main ESG focus areas, most of which include defined performance targets. > Supplier Responsibility, Engagement, and Assessment: Applied strives to be a partner to our suppliers, providing resources, guidelines, tools, and trainings to build capacity on advancing sustainable practices. We also support our suppliers and sub-tier suppliers in their efforts to conform to the Responsible Business Alliance (RBA) code of conduct. From this baseline, we can better gauge progress using RBA assessments and audits. > Inclusion and Supplier Diversity: Mirroring our own I&D journey, SuCCESS2030 promotes development of robust diversity strategies throughout our supply chain. Our near-term supplier diversity targets include increased representation of women and other underrepresented groups and increased percentage spend with women- and minority- owned businesses, all by 2024. We are also working with our trade associations to significantly grow the pipeline of diverse talent available to the industry by 2030. > Packaging: Our precision tools and products require carefully designed packaging to avoid damage during transport, and we are continuously exploring strategies to reduce packaging waste, including redesigning cases and crates for reuse, using recyclable material such as corrugated fiberboard for boxes, and doing testing and measurement to gauge the feasibility of reducing virgin materials usage. > Transportation and Logistics: To reduce emissions from airfreight, we are exploring the use of intermodal shipping options that can deliver product within a reasonable time frame. > Wastewater: Though our own operations are neither water-intensive nor major emitters of wastewater, we recognize the need to reduce our industry’s large footprint in both areas. At suppliers with the requisite capabilities, we are exploring a process of pre-treating metal surfaces for rust protection using zinc oxide. The new process replaces phosphates, which can damage aquatic systems when released in wastewater. SuCCESS2030 strengthens Applied’s ESG supply chain strategy, building on our foundation of supporting ethical labor practices, environmentally responsible operations, responsible minerals sourcing, and other programs promoting adherence to industry standards and international human rights standards. SuCCESS2030 is managed through our SuCCESS2030 Office, which oversees metrics and compliance audits and conducts training and coordination with participating suppliers. Across our operations, we conduct pilot programs to test new efficiency and waste- reduction processes, with the intention of sharing key learnings with our supplier partners and magnifying positive impacts across the industry. INTRODUCTION PURPOSE PEOPLE PLANET PROGRESS Design for Sustainability Promoting the Circular Economy Product Safety Supply Chain Responsibility
Sustainability Report 2021 76 Sustainability Report 2021 76 Supplier Engagement, Training, and Assessment SuCCESS2030 encompasses a series of best practices for building a more sustainable business, society, and planet. As we raise the bar, we are also building our suppliers’ competencies to reach it. Contract Obligations For direct suppliers, our ESG requirements are incorporated into our Global Supplier Agreements and other supplier agreements via our “Supplier ESG Requirements” attachment. These requirements are also included in the terms and conditions for logistics suppliers and all purchase-order transactions and enumerated in our most commonly used agreements for indirect services. By contract as applicable, these require Applied’s suppliers to: > Implement Applied’s Standards of Business Conduct and the RBA Code of Conduct in their own operations and ensure RBA code compliance among their sub-tier suppliers > Comply with our Responsible Minerals Sourcing Policy and meet related statutory and regulatory requirements > Meet Applied’s other ESG requirements in their own operations and ensure compliance among their sub-tier suppliers > Comply with Applied’s Environmental Health and Safety Policy and “any applicable environmental, health or safety law, rule, regulation, order, decree or ordinance” > Comply with Applied’s minimum product EHS requirements > Provide requested information to enable Applied’s compliance with material content restriction regulations, including but not limited to REACH (EC number 1907/2006) and the U.S. Toxic Substances Control Act > Comply with the California Transparency in Supply Chains Act of 2010, addressing the risk of slavery and human trafficking in supply chains Engagement and Training We want working with Applied to be a partnership, with collaboration driving benefit to all parties. In 2021, we began offering a structured program of webinars, trainings and assistance to help our suppliers close any gaps across our ESG focus areas. These included: > Weekly live webinars discussing key area of ESG focus > Online training on Applied Materials Supply Chain ESG Requirements > Training through the RBA e-Learning Academy and RBA workshops > Ability to contract for social responsibility and sustainability assistance from a consultant at pre- negotiated rates Our Applied commodity business managers are required to complete these trainings, assuring that the people who engage most frequently with our suppliers can knowledgeably communicate the business benefits of our sustainability expectations. INTRODUCTION PURPOSE PEOPLE PLANET PROGRESS Design for Sustainability Promoting the Circular Economy Product Safety Supply Chain Responsibility
Sustainability Report 2021 77 Sustainability Report 2021 Supplier Assessments and Audit Applied Materials employs a metrics-based approach to assessing supply chain ESG risks and reflects these assessments in our supplier scorecards. To secure baseline data, we require subsets of our suppliers (as applicable) to: > Complete annual self-assessment questionnaires to measure their conformance to the RBA Code of Conduct (top 80% of direct suppliers by spend, and 10% of high-risk indirect suppliers) > Complete an RBA Environmental Survey to provide basic data on GHG emissions, energy use, water withdrawal, and waste generation, plus qualitative data on reduction targets and efforts (top 80% of direct suppliers by spend) > Submit conflict minerals reporting templates, as well as an extended minerals reporting template (ERMT) if applicable, as part of our responsible minerals sourcing due diligence > Report on their performance under environmental regulations We conduct detailed evaluations of reported information and assign suppliers risk scores using a weighted risk matrix that encompasses ESG and other risk indicators. We implement our SuCCESS2030 practices holistically, identifying gaps at every level, and provide suppliers the resources and tools they need to comply and thrive, rather than focusing corrective action solely on suppliers identified as posing high ESG risks. For a second year, COVID-19 forced us to employ remote internal ESG audits for certain high-risk direct suppliers rather than going on-site. Consistent with RBA provisions, Applied required 33% of our high-risk suppliers to undergo an RBA external audit in 2021. This percentage is targeted to grow to 50% in 2022. We have contracted with an RBA-approved third-party audit firm to conduct such audits consistent with RBA audit standards. Protecting Human Rights in Our Supply Chain Applied Materials is unequivocally committed to protecting human rights and conducting business in an ethical and responsible manner around the world. We condemn and are committed to ending forced and bonded labor in all its forms, including child labor, indentured labor, slavery, and human trafficking. Our commitment to protecting human rights wherever we do business is detailed in the policies and statements listed on pag e 51 . We communicate our human rights commitments and requirements clearly to our supply chain and business partners to help ensure compliance with our expectations around humane treatment of the workforce and forbidding forced and bonded labor. We conduct due diligence on human rights risk in our supply chain and flag zero-tolerance issues in our supplier scorecards. View our Human Rights Statement of Pri nciples here . Sustainability Report 2021 77 INTRODUCTION PURPOSE PEOPLE PLANET PROGRESS Design for Sustainability Promoting the Circular Economy Product Safety Supply Chain Responsibility
Sustainability Report 2021 78 Responsible Minerals Sourcing Applied Materials is committed to the responsible sourcing of minerals used in our products. Key to this commitment is our policy around tantalum, tin, tungsten, and gold, commonly referred to as 3TG or conflict minerals for their frequent origin in the Democratic Republic of Congo (DRC) and adjoining countries affected by conflict and human rights abuses. Since 2019, Applied Materials has retained Assent Compliance (“Assent”), a third-party service provider, to assist Applied in conducting outreach to suppliers regarding their use of 3TG in products furnished to Applied, and evaluating their responses and smelter engagements. While our products include components manufactured with 3TG, we neither purchase these minerals directly nor maintain any direct relationship with mines, smelters or refiners that process these minerals. Our Responsible Minerals Sourcing Policy communicates our commitment to due diligence and disclosure and guides our direct suppliers’ sourcing of 3TG minerals. To assure the efficacy of our policy, we utilize the Responsible Minerals Initiative (RMI) Responsible Minerals Assurance Process as well as independent third-party audits. In calendar 2021, we reviewed the list of suppliers we surveyed for calendar year 2020 and identified those who for three consecutive years had responded that the products they sold to Applied did not contain conflict minerals. Assent reached out to these suppliers on our behalf and requested that they provide Conflict Minerals Reporting Templates. In addition, in an effort to reach suppliers with lower spend, we directly contacted almost all direct suppliers with a request for conflict minerals information. Together, these two groups of suppliers represent approximately 92% of our total supplier spend in 2021. Approximately 97% of the suppliers surveyed by Assent responded. Due to the unprecedented business growth and changing roles and responsibilities among suppliers, nine surveyed suppliers were unable to provide Templates. Beyond 3TG, we also conduct due diligence on suppliers from whom we source products likely to contain cobalt, a frequently DRC- sourced mineral that has been tied to child labor, unsafe working conditions and adverse environmental impacts. In 2020, Applied worked with Assent to request Cobalt Reporting Templates (CRT) from suppliers expected to have cobalt in the products they furnish to Applied. Starting in 2021, Applied began requesting instead an Extended Minerals Reporting Template (“EMRT”), which covers cobalt and mica. The EMRT replaced the Cobalt Reporting Template and is expected to cover a growing list of minerals as the Responsible Minerals Initiative (RMI) and its partner organizations develop a broader responsible minerals sourcing program. In 2021, this effort garnered a 100% response rate. Looking ahead, we intend to expand due diligence to the copper, nickel, lead, zinc, and mica used in our products, consistent with RMI guidance. In 2021, Applied Materials joined Copper Mark as one of its first partners, along with Ford Motor Company, Google, Intel and Wieland. Copper Mark aims to improve the responsible production practices of the copper industry, in part by developing and supporting criteria for responsible mineral production and sourcing. We participate in their three working groups, with a focus on the Due Diligence Working Group, which aims to support ethical copper sourcing practices. INTRODUCTION PURPOSE PEOPLE PLANET PROGRESS Design for Sustainability Promoting the Circular Economy Product Safety Supply Chain Responsibility
Sustainability Report 2021 79 Packaging Reduction and Reuse Our precision products require carefully designed packaging to avoid damage from shock and vibration during transport. In 2021, we launched a new Design for Distribution task force to encourage up-front planning and develop smarter packaging strategies that meet those demands while improving sustainability via materials reduction, improved recyclability, and reusability. In 2021, approximately 75% of our packaging materials were made from recyclable materials (polyethylene, polypropylene, corrugated fiberboard, steel, and wood), many of which are also reusable. We also enacted new supplier specifications that prohibit the use of certain packaging materials (including polystyrene) and require suppliers to report materials data, improving our ability to track our packaging’s recyclable content. Going forward, we are developing processes to track and enforce compliance with those specifications. Ongoing initiatives are detailed below. Lighter Polyethylene Bags To save materials, we are moving from 6 mil to 4 mil thickness for our low-density polyethylene (LDPE) bags. By year-end FY2022 we anticipate a >75% conversion rate globally for bags purchased directly for final goods. “Just Strong Enough” Crates Where earlier wooden crate designs tended to be overbuilt for most use cases, our new, lighter crates are matched to the precise needs of individual products. In 2021, this strategy saved some 271,000 pounds of crate materials, and continuing efforts are on track to raise that figure to 1 million pounds by year-end FY2022. Hybrid Crate Design For lighter product shipments, we have begun using hybrid crates that pair a wooden base with a corrugated kraft board top and full moisture-barrier bagging inside. Offering a 50% reduction in packaging weight, these designs save the equivalent of 3,917 trees annually, trim transport emissions and packaging material cost, ease recycling and increase safety for freight handlers. Reusable Packaging In 2021, we piloted a program that uses our Logistics Tracking System to track packaging materials (wooden crates, metal fixtures), collect them post-install from customer sites, and return them to the manufacturing location for reuse. Beginning with a domestic loop from Singapore, we tested international loops in Q3 2021. We are also exploring a reusability process for our 500-pound pallets and for crates from our contract manufacturers. Reusable Packaging Labels Labels communicate to the end user that our packaging is reusable and must not be discarded. Waste Reduction To keep our packaging out of landfills, Applied prohibits the use of non-recyclable materials such as Styrofoam. We also plan to restrict the use of non-recyclable and environmentally burdening materials such as PVC and toxic foams in the upcoming revision of Applied’s Supplier Packaging Specification due for release in FY22. Packaging ESG Dashboard An in-progress initiative is using existing SMS and SAP systems to develop measurement dashboards detailing our packaging’s ESG impact. Flexible Solutions for Our Packaging Ecosystem Having real-world impact on packaging waste requires real-world insight—into how much protection individual products need, where we are shipping them, and what the capacities are for recycling and reuse in those locations. Then, we design the most resource-efficient packaging and processes to match. At our TMC factory in Taiwan, we are eliminating some packing crates altogether by trucking products directly to our local customers. INTRODUCTION PURPOSE PEOPLE PLANET PROGRESS Design for Sustainability Promoting the Circular Economy Product Safety Supply Chain Responsibility
Sustainability Report 2021 80 Supplier Diversity To broaden the impact of our inclusion and diversity commitment, Applied Materials works to build diversity in our supply chain, both through onboarding women- and minority-owned suppliers and through encouraging equitable hiring practices across our supply base. Our supplier diversity program is one of the main pillars of our SuCCESS2030 initiative, and in 2021 we met our goal of increasing our diverse spend by at least 2% year on year, through both existing and newly onboarded diverse suppliers. For 2022, our goal is for 2.5% of our total global spend to reside with certified diverse suppliers. In addition, we are partnering with applicable existing suppliers to pursue their diversity certifications through the Women’s Business Enterprise National Council (WBENC) and National Minority Supplier Diversity Council (NMSDC). Beyond expanding our diverse supplier base, we are also working to integrate equity and inclusion across our procurement operations, adding resiliency to our supply chain. In June 2021, we hired a dedicated supplier diversity program manager and began hosting webinars to help our suppliers boost their own supplier diversity efforts. To measure our progress in alignment with other supplier diversity programs, we employ the RGMA Five Levels of Supplier Diversity framework. Near-term objectives include: > Launching trainings for senior executives, procurement professionals, and commodity business managers > Evaluating opportunities to increase diverse spend within our Tier 1 and Tier 2 supplier base Over the long term, we strive to build a true partnership with our suppliers to drive diversity throughout our supply chain and set a positive example for our industry, all while better meeting our business needs. Defining Diversity Applied Materials’ diverse suppliers must be certified by a third-party auditor as being at least 51% diverse owned, controlled, and operated by U.S. minorities (African- American/Black, Hispanic/Latin-American, Native American, Asian-Pacific American, Asian-Indian American), women, minority women, LGBTQ, persons with disabilities, veterans, or service-disabled veterans. Applied Materials also tracks additional diverse suppliers who could potentially be registered as diverse if they proceed with certification. As a founding member of SEMI’s Manufacturing Ownership Diversity (MOD) working group, Applied Materials is working to provide best practices for supplier diversity in the semiconductor industry. Sustainability Report 2021 80 INTRODUCTION PURPOSE PEOPLE PLANET PROGRESS Design for Sustainability Promoting the Circular Economy Product Safety Supply Chain Responsibility
Sustainability Report 2021 81 81 Supplier Spotlight TransPak: Shared Commitment to ESG Founded in Silicon Valley in 1952, TransPak witnessed the birth of the tech epicenter while serving the packaging needs of the world’s top tech brands. A certified woman- owned business, TransPak began working with Applied Materials in 1978, forging a relationship that TransPak Board Chair Arlene Inch describes as “changing the trajectory” of her family’s company. “Having to meet Applied’s standards kept us on our toes and pushed us to be better,” said Inch. “Over time, we developed a partnership that led to our international expansion along the lines of Applied’s needs. Without the strength of that relationship, we would never have had the courage to strike out and establish ourselves in so many other countries, which led to even more strength and diversity, and additional global customers.” The two companies share common core values and a strong commitment to advancing ESG. “Our shared philosophy, environmental consciousness, social initiatives of diversity and inclusion, and our governance model support the leaders of our organizations to create a mutually beneficial relationship,” said Inch. TransPak aims to be carbon neutral by 2025, and in support of that goal now uses electric forklifts and solar power at their manufacturing plants. Inch says TransPak has always tried to use as many sustainable and recyclable materials as it could in its packaging, because “it just seemed like the right thing to do.” “I hate waste and inefficiency, so being careful about materials and waste came naturally,” she said. With a strong commitment to diversity, equity, and inclusion, TransPak is committed to diverse hiring, participating in community events, and supporting local community organizations. “People spend most of their waking hours at their workplace and it should reflect their culture and values. It’s just good business to respect local customs, provide opportunities for people from all backgrounds, and allow everyone in the organization to learn from each other,” said Inch. Applied Wins Intel EPIC Award In 2022, Intel’s EPIC (Excellence, Partnership, Inclusion, and Continuous Improvement) Program awarded Applied Materials its exclusive Outstanding Supplier Award with Supplier Diversity Distinction. In August 2021, Applied hosted Intel during a commodity business manager forum to learn more about their supplier diversity efforts and explore avenues for diversity collaboration. Sustainability Report 2021 INTRODUCTION PURPOSE PEOPLE PLANET PROGRESS Design for Sustainability Promoting the Circular Economy Product Safety Supply Chain Responsibility
Sustainability Report 2021 82 © 2022 Applied Materials, Inc. All rights reserved. Applied Materials, the Applied Materials logo, Make Possible are trademarks of Applied Materials, Inc. in the U.S. and other countries. All other trademarks contained herein are the property of their respective owners. This report builds on Applied’s previous disclosures and expands transparency through: > Reporting our total Scope 3 greenhouse-gas (GHG) inventory for the 2019 baseline year > Disclosing climate-related risks, opportunities, and data in accordance with the Task Force on Climate- related Financial Disclosures (TCFD) in the Annex > Continuing to improve and refine the accuracy of our reported data in the Annex > Expansion of limited third-party assurance to include Scope 3 emissions Applied Materials produces its Sustainability Report on an annual basis and data is reported by fiscal year unless clearly marked otherwise. Report data covers all global operations unless otherwise noted. Reporting Standards > This report has been prepared in accordance with the Global Reporting Initiative Standards: Core option. A GRI Index is included in the report Annex . > Disclosures following the Sustainability Accounting Standards Board (SASB) Semiconductor Standard are also provided in the report Annex . > We continue to enhance our alignment with TCFD by providing a TCFD Index in the report Annex and discussing the results of our climate risk assessment in the Climate and Energy section of the report. > Greenhouse gas (GHG) emissions are calculated following the GHG Protocol using the best available data in the reporting year. Calculation methodology improvements are likely to be implemented annually and will be transparently disclosed in future sustainability reports. > Throughout the report, we demonstrate alignment and contribution to key United Nations Sustainable Development Goals (SDGs). Report Information and Data Assurance Limited assurance of select indicators included in the Sustainability Report and Annex has been conducted by ERM CVS, whose assurance statement is provided on page 83 . Further, all Applied manufacturing sites maintain ISO 14001:2015 and ISO 45001:2018 certifications, which require annual third-party audits of our management systems and processes. This report contains forward-looking statements, including our commitments, targets, and other statements that are not historical facts. These statements are subject to risks and uncertainties, and are not guarantees of future performance. Factors that could cause actual results to differ materially from those expressed or implied by such statements are set forth in the “Risk Factors” of our SEC filings, including our recent Forms 10-K, 10-Q, and 8-K. All forward-looking statements are based on management’s current estimates, projections, and assumptions, and we assume no obligation to update them. About This Report Published on behalf of Applied Materials, Inc. and its subsidiaries (collectively referred to as “Applied Materials,” “Applied,” or “the company”), this report continues the work begun with our first Corporate Social Responsibility (CSR) report in 2015. INTRODUCTION PURPOSE PEOPLE PLANET PROGRESS
Sustainability Report 2021 83 Third-Party Data Assurance Statement INTRODUCTION PURPOSE PEOPLE PLANET PROGRESS Independent Assurance Statement t o Applied Materials ERM Certification and Verification Services , Inc . ( “ ERM CVS ” ) was engaged by Applied Materials, Inc. to provide assurance in relation to the information set out below and presented in the Applied Materials 2021 Sustainability Report. Engagement s ummary Scope of our assurance engagement Environmental indicators GHG Emissions o Total direct (Scope 1) GHG emissions [metric tons CO2e] o Total indirect (Scope 2) GHG emissions market -based and location -based approach [metric tons CO2e] o Total Scope 1 and 2 GHG emissions [metric tons CO2e] o GHG emissions intensity -Total Scope 1 and Scope 2 [ tons CO2e/employee and tons CO2e/million dollars of revenue]* o Total 2019 Scope 3 emissions inclusive of Categories: 1 -Purchased Goods and Services, 2 – Capital Goods , 3- Fuel- and- Energy Related Activities **, 4 - Upstream Transportation and Distribution, 5 -Waste Generated in Operations ** , 6 -Business Travel, 7 -Employee Commuting, 8 – Leased assets, 9 -Downstream Transportation and Distrib ution, 11 -Use of Sold Products; 12 -End of Life Treatment of Sold Products and 15 - Investments [metric tons CO2e] Energy o Total energy consumption [MWh] o Total renewable energy [MWh] o Total electricity consumption [MWh] o Percentage renewable energy consumption [%] o Percentage renewable electricity consumption [%] o Energy intensity [MWh/employee and MWh/million dollars of revenue]* Water o Total water withdrawal [megaliters] o Total water withdrawal from all areas with water stress [megaliters] Workforce Indicators Total workforce and workforce by contract type [r egular full -time employees, temp orary workers and interns] [number] Female representation of the g lobal and U .S. workforce (including New College Graduates, excluding interns) by career lev el and engineering specifically [%] Ethnicity & race r epres entation of the U.S. w orkforce [%] U.S. employee f emale repr esentation of new hires, intern hires and New College Graduate hires [%] Voluntary turnover – global rate and g lobal rate by gender [%] Health & Safety Indicators Total case incident rate (TCIR) Days away, restricted, or transferred (DART) rate Fatalities [number ] Community Impact Indicators Total community investments [million dollars] Total giving through the Foundation Match Program [million dollars] Total Volunteer T ime Grant hours logged 1 [hours] Total contributions issued by Applied Materials Foundation based on Time Grant hours 1 [dollars] 1 Calendar year reporting period * For the assurance of the intensity metrics included in the scope of thi s engagement, ERM CVS has placed reliance on the SEC 10K annual filing stated revenue which has been taken as read. **Underlying waste and energy data for 2019 has not been subject to verification and has been take n as read for the purpose of th e Scope 3 categories . Reporting period October 26, 2020 to October 31, 2021 , except where noted otherwise . Reporting criteria WBCSD/WRI GHG Protocol (2004, as updated January 2015) for the Scope 1, 2 and 3 GHG emissions; OSHA Injury and Illness Recordkeeping and Reporting definitions; GRI Standards version of 2020 for Water and effluents (303) ; Applied Materials’ internal reporting criteria and definitions for community impact and workforce data. Assurance standard ERM CVS’ assurance methodology, based on the International Sta ndard on Assurance Engagements ISAE 3000 (Revised) . Assurance level Limited assurance Respective responsibilities Applied Materials is responsible for preparing the Report and for the collection and presentation of the information within it. ERM CVS’ responsibility is to provide conclusions on the agreed scope based on the assurance activities performed and exercisin g our professional judgement. Our conclusions Based on our activities , as described below, nothing has come to our attention to indicate that the 2021 data and information for the disclosures listed under ‘Scope’ above are not fairly presented, in all material respects, with the reporting criteria . Our assurance activities A multi -disciplinary team of sustainability and assurance specialists performed a range of assurance procedures which varied across the disclosures covered by our assurance engagement , as follows: A review of internal reporting guidelines and procedures , including unit conversion s, estimations , emission factors and assumptions used; A walk -through of the reporting and data management systems used for each indicator group (Workforce, Environmental, Health & Safety and Community Impact data programs); Interviews with data owners at corporate level (e.g. environmental, social, health & safety and community impact) to understand the data consolidation process and internal controls ; An analytical review of fiscal year 202 1 full year data by conducting a year -over -year analysis per site for the selected indicators which included testing the completeness and accuracy of data ; Virt ual site visits to four si tes ( Alzenau in Germany, Xian Campus in China, and Bowers Campus and Harris Branch Campus in the USA) to understand local reporting processes, data management and reporting; Desktop review of underlying source data for site visits , Scope 3 and renewable energy calculations; A review of alignment of indicators with the established reporting criteria; An evaluation of the consistency of definitions used to classify data for the health & safety and workforce -related indicators; Testing of a sample of underlying data on transactions, cases and profiles for the community impact, health & safety and workforce indicators respectively; An in -person head office visit to review outcomes of Applied Ma terials internal QA/QC process, including changes made to fiscal year 2021 data following the findings from the site visits and other assurance testing carried out , and to have in -depth discussions around 2019 Scope 3 GHG emissions calculations methodologies used and Corporate -level source d ata for the categories included ; and Reviewing the presentation of information relevant to the scope of our work in the Report to ensure consistency with our findings. The limitations of our engagement The reliability of the assured performance data is subject to inherent uncertainties, given the available methods for determining, calculating or estimating the underlying information. It is important to understand our assurance conclusion in this context. We do not, in giving this opinion, accept or assume responsibility for any third party using or placing reliance on our opinion in order to make a decisions related to Applied Materials. Force -majeure Prior to our assurance engagement, travel restrictio ns were imposed following the outbreak of COVID -19. As a result of these, we agreed to replace in person site visits with ‘virtual’ visits via conference and video calls for this year’s assurance engagement. While we believe these changes do not affect our limited assurance conclusion above, we draw attention to the possibility that if we had undertaken in person visits, we may have identified errors and omissions in the assured information that we did not discover through the alternative assurance program. Our independence ERM CVS is a member of the ERM Group. The work that ERM CVS conducts for clients is solely related to independent assurance activities and auditor training. Our processes are designed and implemented to ensure that the work we undertake with clients is fre e from bias and conflict of interest. ERM CVS and the staff that have undertaken work on this assurance exercise provide no consultancy related services to Applied Materials in any respect. Our Observations We have provided Applied Materials with a separate management report with our detailed (non -material) findings and recommendations. Beth Wyke Head of Corporate Assurance Services 28 June 2022 ERM Certification and Verification Services, Inc . www.ermcvs.com Email: [email protected]