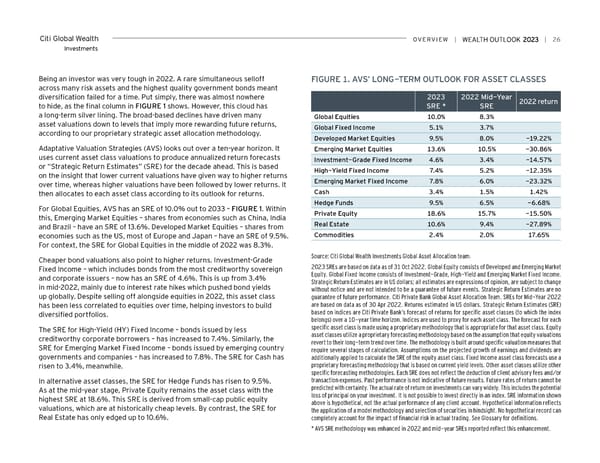
Citi Global Wealth overview | | 26 Investments Being an investor was very tough in 2022. A rare simultaneous selloff FiGUre 1. AvS’ LoNG-TerM oUTLooK For ASSeT CLASSeS across many risk assets and the highest quality government bonds meant diversification failed for a time. Put simply, there was almost nowhere 2023 2022 Mid-Year 2022 return to hide, as the final column in FIGURE 1 shows. However, this cloud has Sre * Sre a long-term silver lining. The broad-based declines have driven many Global equities 10.0% 8.3% asset valuations down to levels that imply more rewarding future returns, Global Fixed income 5.1% 3.7% according to our proprietary strategic asset allocation methodology. Developed Market equities 9.5% 8.0% -19.22% Adaptative Valuation Strategies (AVS) looks out over a ten-year horizon. It emerging Market equities 13.6% 10.5% -30.86% uses current asset class valuations to produce annualized return forecasts investment-Grade Fixed income 4.6% 3.4% -14.57% or “Strategic Return Estimates” (SRE) for the decade ahead. This is based High-Yield Fixed income 7.4% 5.2% -12.35% on the insight that lower current valuations have given way to higher returns over time, whereas higher valuations have been followed by lower returns. It emerging Market Fixed income 7.8% 6.0% -23.32% then allocates to each asset class according to its outlook for returns. Cash 3.4% 1.5% 1.42% Hedge Funds 9.5% 6.5% -6.68% For Global Equities, AVS has an SRE of 10.0% out to 2033 – FIGURE 1. Within Private equity 18.6% 15.7% -15.50% this, Emerging Market Equities – shares from economies such as China, India and Brazil – have an SRE of 13.6%. Developed Market Equities – shares from real estate 10.6% 9.4% -27.89% economies such as the US, most of Europe and Japan – have an SRE of 9.5%. Commodities 2.4% 2.0% 17.65% For context, the SRE for Global Equities in the middle of 2022 was 8.3%. Cheaper bond valuations also point to higher returns. Investment-Grade Source: Citi Global Wealth Investments Global Asset Allocation team. Fixed Income – which includes bonds from the most creditworthy sovereign 2023 SREs are based on data as of 31 Oct 2022. Global Equity consists of Developed and Emerging Market and corporate issuers – now has an SRE of 4.6%. This is up from 3.4% Equity. Global Fixed Income consists of Investment-Grade, High-Yield and Emerging Market Fixed Income. in mid-2022, mainly due to interest rate hikes which pushed bond yields Strategic Return Estimates are in US dollars; all estimates are expressions of opinion, are subject to change without notice and are not intended to be a guarantee of future events. Strategic Return Estimates are no up globally. Despite selling off alongside equities in 2022, this asset class guarantee of future performance. Citi Private Bank Global Asset Allocation Team. SREs for Mid-Year 2022 has been less correlated to equities over time, helping investors to build are based on data as of 30 Apr 2022. Returns estimated in US dollars. Strategic Return Estimates (SRE) diversified portfolios. based on indices are Citi Private Bank’s forecast of returns for specific asset classes (to which the index belongs) over a 10-year time horizon. Indices are used to proxy for each asset class. The forecast for each The SRE for High-Yield (HY) Fixed Income – bonds issued by less specific asset class is made using a proprietary methodology that is appropriate for that asset class. Equity creditworthy corporate borrowers – has increased to 7.4%. Similarly, the asset classes utilize a proprietary forecasting methodology based on the assumption that equity valuations SRE for Emerging Market Fixed Income – bonds issued by emerging country revert to their long-term trend over time. The methodology is built around specific valuation measures that require several stages of calculation. Assumptions on the projected growth of earnings and dividends are governments and companies – has increased to 7.8%. The SRE for Cash has additionally applied to calculate the SRE of the equity asset class. Fixed Income asset class forecasts use a risen to 3.4%, meanwhile. proprietary forecasting methodology that is based on current yield levels. Other asset classes utilize other specific forecasting methodologies. Each SRE does not reflect the deduction of client advisory fees and/or In alternative asset classes, the SRE for Hedge Funds has risen to 9.5%. transaction expenses. Past performance is not indicative of future results. Future rates of return cannot be As at the mid-year stage, Private Equity remains the asset class with the predicted with certainty. The actual rate of return on investments can vary widely. This includes the potential highest SRE at 18.6%. This SRE is derived from small-cap public equity loss of principal on your investment. It is not possible to invest directly in an index. SRE information shown valuations, which are at historically cheap levels. By contrast, the SRE for above is hypothetical, not the actual performance of any client account. Hypothetical information reflects the application of a model methodology and selection of securities in hindsight. No hypothetical record can Real Estate has only edged up to 10.6%. completely account for the impact of financial risk in actual trading. See Glossary for definitions. * AVS SRE methodology was enhanced in 2022 and mid-year SREs reported reflect this enhancement.
 Citi Wealth Outlook 2023 Page 25 Page 27