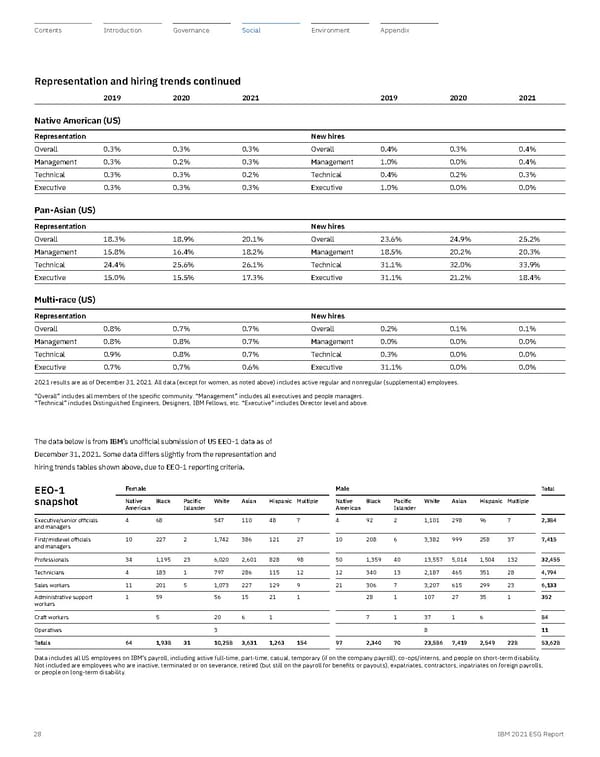
2019 2020 2021 2019 2020 2021 Native American (US) Representation New hires Overall 0.3% 0.3% 0.3% Overall 0.4% 0.3% 0.4% Management 0.3% 0.2% 0.3% Management 1.0% 0.0% 0.4% Technical 0.3% 0.3% 0.2% Technical 0.4% 0.2% 0.3% Executive 0.3% 0.3% 0.3% Executive 1.0% 0.0% 0.0% Pan-Asian (US) Representation New hires Overall 18.3% 18.9% 20.1% Overall 23.6% 24.9% 25.2% Management 15.8% 16.4% 18.2% Management 18.5% 20.2% 20.3% Technical 24.4% 25.6% 26.1% Technical 31.1% 32.0% 33.9% Executive 15.0% 15.5% 17.3% Executive 31.1% 21.2% 18.4% Multi-race (US) Representation New hires Overall 0.8% 0.7% 0.7% Overall 0.2% 0.1% 0.1% Management 0.8% 0.8% 0.7% Management 0.0% 0.0% 0.0% Technical 0.9% 0.8% 0.7% Technical 0.3% 0.0% 0.0% Executive 0.7% 0.7% 0.6% Executive 31.1% 0.0% 0.0% 2021 results are as of December 31, 2021. All data (except for women, as noted above) includes active regular and nonregular (supplemental) employees. “Overall” includes all members of the specific community. “Management” includes all executives and people managers. “Technical” includes Distinguished Engineers, Designers, IBM Fellows, etc. “Executive” includes Director level and above. Representation and hiring trends continued Female Male Total Native American Black Pacific Islander White Asian Hispanic Multiple Native American Black Pacific Islander White Asian Hispanic Multiple Executive/senior officials and managers 4 68 547 110 48 7 4 92 2 1,101 298 96 7 2,384 First/midlevel officials and managers 10 227 2 1,742 386 121 27 10 208 6 3,382 999 258 37 7,415 Professionals 34 1,195 23 6,020 2,601 828 98 50 1,359 40 13,557 5,014 1,504 132 32,455 Technicians 4 183 1 797 286 115 12 12 340 13 2,187 465 351 28 4,794 Sales workers 11 201 5 1,073 227 129 9 21 306 7 3,207 615 299 23 6,133 Administrative support workers 1 59 56 15 21 1 28 1 107 27 35 1 352 Craft workers 5 20 6 1 7 1 37 1 6 84 Operatives 3 8 11 Totals 64 1,938 31 10,258 3,631 1,263 154 97 2,340 70 23,586 7,419 2,549 228 53,628 Data includes all US employees on IBM’s payroll, including active full-time, part-time, casual, temporary (if on the company payroll), co-ops/interns, and people on short-term disability. Not included are employees who are inactive, terminated or on severance, retired (but still on the payroll for benefits or payouts), expatriates, contractors, inpatriates on foreign payrolls, or people on long-term disability. EEO-1 snapshot The data below is from IBM’s unofficial submission of US EEO-1 data as of December 31, 2021. Some data differs slightly from the representation and hiring trends tables shown above, due to EEO-1 reporting criteria. 28 IBM 2021 ESG Report
 ESG Report | IBM Page 27 Page 29