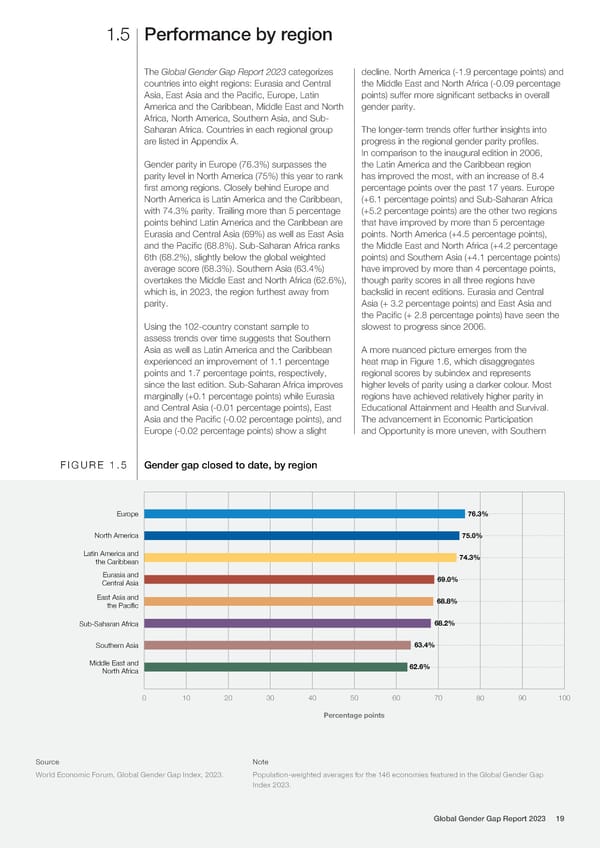
1.5 Performance by region The Global Gender Gap Report 2023 categorizes decline. North America (-1.9 percentage points) and countries into eight regions: Eurasia and Central the Middle East and North Africa (-0.09 percentage Asia, East Asia and the Paci昀椀c, Europe, Latin points) suffer more signi昀椀cant setbacks in overall America and the Caribbean, Middle East and North gender parity. Africa, North America, Southern Asia, and Sub- Saharan Africa. Countries in each regional group The longer-term trends offer further insights into are listed in Appendix A. progress in the regional gender parity pro昀椀les. In comparison to the inaugural edition in 2006, Gender parity in Europe (76.3%) surpasses the the Latin America and the Caribbean region parity level in North America (75%) this year to rank has improved the most, with an increase of 8.4 昀椀rst among regions. Closely behind Europe and percentage points over the past 17 years. Europe North America is Latin America and the Caribbean, (+6.1 percentage points) and Sub-Saharan Africa with 74.3% parity. Trailing more than 5 percentage (+5.2 percentage points) are the other two regions points behind Latin America and the Caribbean are that have improved by more than 5 percentage Eurasia and Central Asia (69%) as well as East Asia points. North America (+4.5 percentage points), and the Paci昀椀c (68.8%). Sub-Saharan Africa ranks the Middle East and North Africa (+4.2 percentage 6th (68.2%), slightly below the global weighted points) and Southern Asia (+4.1 percentage points) average score (68.3%). Southern Asia (63.4%) have improved by more than 4 percentage points, overtakes the Middle East and North Africa (62.6%), though parity scores in all three regions have which is, in 2023, the region furthest away from backslid in recent editions. Eurasia and Central parity. Asia (+ 3.2 percentage points) and East Asia and the Paci昀椀c (+ 2.8 percentage points) have seen the Using the 102-country constant sample to slowest to progress since 2006. assess trends over time suggests that Southern Asia as well as Latin America and the Caribbean A more nuanced picture emerges from the experienced an improvement of 1.1 percentage heat map in Figure 1.6, which disaggregates points and 1.7 percentage points, respectively, regional scores by subindex and represents since the last edition. Sub-Saharan Africa improves higher levels of parity using a darker colour. Most marginally (+0.1 percentage points) while Eurasia regions have achieved relatively higher parity in and Central Asia (-0.01 percentage points), East Educational Attainment and Health and Survival. Asia and the Paci昀椀c (-0.02 percentage points), and The advancement in Economic Participation Europe (-0.02 percentage points) show a slight and Opportunity is more uneven, with Southern FIGURE 1.5 Gender gap closed to date, by region Europe 76.3% North America 75.0% Latin America and 74.3% the Caribbean Eurasia and 69.0% Central Asia East Asia and 68.8% the Pacific Sub-Saharan Africa 68.2% Southern Asia 63.4% Middle East and 62.6% North Africa 0 10 20 30 40 50 60 70 80 90 100 Percentage points Source Note World Economic Forum, Global Gender Gap Index, 2023. Population-weighted averages for the 146 economies featured in the Global Gender Gap Index 2023. Global Gender Gap Report 2023 19
 Global Gender Gap Report 2023 Page 18 Page 20