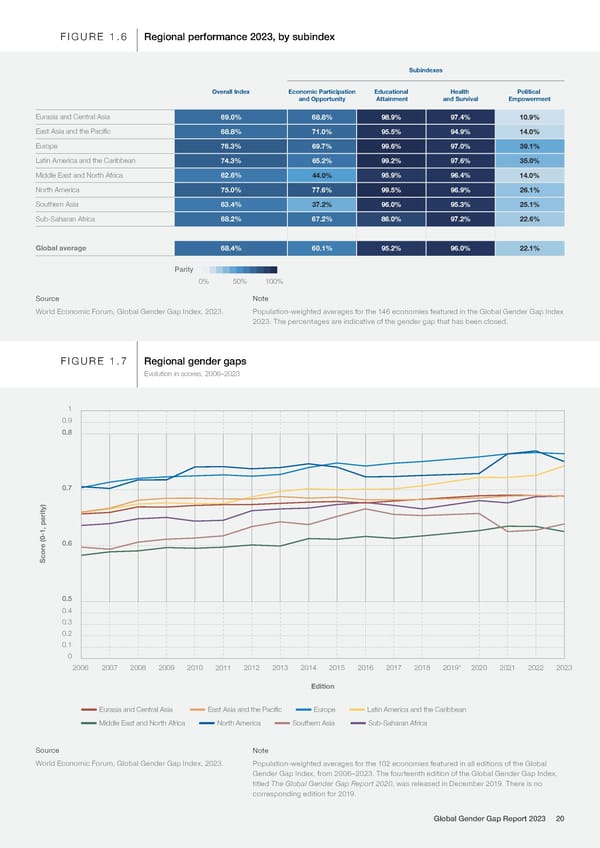
FIGURE 1.6 Regional performance 2023, by subindex Subindexes Overall Index Economic Participation Educational Health Political and Opportunity Attainment and Survival Empowerment Eurasia and Central Asia 69.0% 68.8% 98.9% 97.4% 10.9% East Asia and the Pacific 68.8% 71.0% 95.5% 94.9% 14.0% Europe 76.3% 69.7% 99.6% 97.0% 39.1% Latin America and the Caribbean 74.3% 65.2% 99.2% 97.6% 35.0% Middle East and North Africa 62.6% 44.0% 95.9% 96.4% 14.0% North America 75.0% 77.6% 99.5% 96.9% 26.1% Southern Asia 63.4% 37.2% 96.0% 95.3% 25.1% Sub-Saharan Africa 68.2% 67.2% 86.0% 97.2% 22.6% Global average 68.4% 60.1% 95.2% 96.0% 22.1% Parity 0% 50% 100% Source Note World Economic Forum, Global Gender Gap Index, 2023. Population-weighted averages for the 146 economies featured in the Global Gender Gap Index 2023. The percentages are indicative of the gender gap that has been closed. FIGURE 1.7 Regional gender gaps Evolution in scores, 2006–2023 1 0.9 0.8 0.7 e (0-1, parity)0.6 Scor 0.5 0.4 0.3 0.2 0.1 0 2006 2007 2008 2009 2010 2011 2012 2013 2014 2015 2016 2017 2018 2019* 2020 2021 2022 2023 Edition Eurasia and Central Asia East Asia and the Pacific Europe Latin America and the Caribbean Middle East and North Africa North America Southern Asia Sub-Saharan Africa Source Note World Economic Forum, Global Gender Gap Index, 2023. Population-weighted averages for the 102 economies featured in all editions of the Global Gender Gap Index, from 2006–2023. The fourteenth edition of the Global Gender Gap Index, titled The Global Gender Gap Report 2020, was released in December 2019. There is no corresponding edition for 2019. Global Gender Gap Report 2023 20
 Global Gender Gap Report 2023 Page 19 Page 21