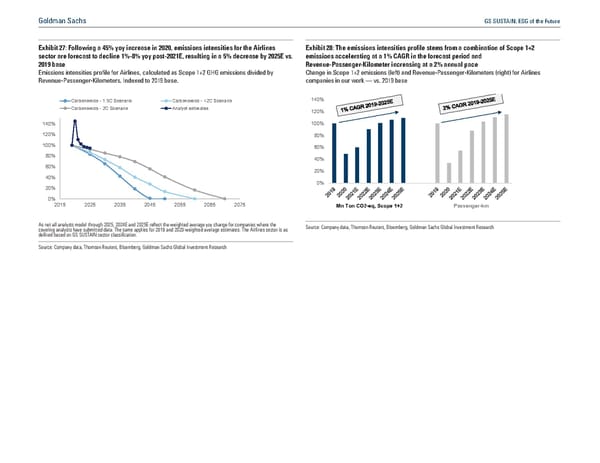
Goldman Sachs GS SUSTAIN: ESG of the Future Exhibit 27: Following a 45% yoy increase in 2020, emissions intensities for the Airlines Exhibit 28: The emissions intensities profile stems from a combination of Scope 1+2 sector are forecast to decline 1%-8% yoy post-2021E, resulting in a 5% decrease by 2025E vs. emissions accelerating at a 1% CAGR in the forecast period and 2019 base Revenue-Passenger-Kilometer increasing at a 2% annual pace Emissions intensities profile for Airlines, calculated as Scope 1+2 GHG emissions divided by Change in Scope 1+2 emissions (left) and Revenue-Passenger-Kilometers (right) for Airlines Revenue-Passenger-Kilometers. Indexed to 2019 base. companies in our work — vs. 2019 base Carbonomics - 1.5C Scenario Carbonomics - <2C Scenario 140% Carbonomics - 2C Scenario Analyst estimates 120% 140% 100% 120% 80% 100% 60% 80% 40% 60% 20% 40% 20% 0% 0% 2015 2025 2035 2045 2055 2065 2075 Mn Ton CO2-eq, Scope 1+2 Passenger-km As not all analysts model through 2025, 2024E and 2025E reflect the weighted average yoy change for companies where the Source: Company data, Thomson Reuters, Bloomberg, Goldman Sachs Global Investment Research covering analysts have submitted data. The same applies for 2019 and 2020 weighted average estimates. The Airlines sector is as de“ned based on GS SUSTAIN sector classi“cation. Source: Company data, Thomson Reuters, Bloomberg, Goldman Sachs Global Investment Research
 GS SUSTAIN: ESG of the Future Page 39 Page 41