Johnson & Johnson ESG Summary
2021 ESG Summary Contents Learn more 2021 Health for Humanity Report, including the ESG Disclosure Index with Sustainability Accounting Standards Board (SASB), Task Force on Climate-related Financial Disclosures (TCFD), Global Reporting Initiative (GRI), and Independent Assurance Statements Corporate Governance materials For queries or feedback, please contact us at the Johnson & Johnson Enterprise ESG Program Office.
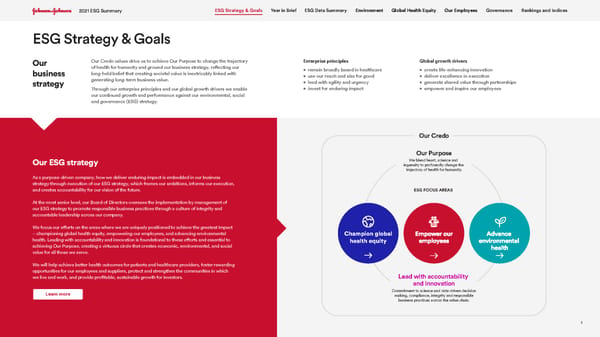
2 ESG Strategy & Goals 2 As a purpose-driven company, how we deliver enduring impact is embedded in our business strategy through execution of our ESG strategy, which frames our ambitions, informs our execution, and creates accountability for our vision of the future. At the most senior level, our Board of Directors oversees the implementation by management of our ESG strategy to promote responsible business practices through a culture of integrity and accountable leadership across our company. We focus our efforts on the areas where we are uniquely positioned to achieve the greatest impact – championing global health equity, empowering our employees, and advancing environmental health. Leading with accountability and innovation is foundational to these efforts and essential to achieving Our Purpose, creating a virtuous circle that creates economic, environmental, and social value for all those we serve. We will help achieve better health outcomes for patients and healthcare providers, foster rewarding opportunities for our employees and suppliers, protect and strengthen the communities in which we live and work, and provide profitable, sustainable growth for investors. Our Credo values drive us to achieve Our Purpose to change the trajectory of health for humanity and ground our business strategy, reflecting our long-held belief that creating societal value is inextricably linked with generating long-term business value. Through our enterprise principles and our global growth drivers we enable our continued growth and performance against our environmental, social and governance (ESG) strategy. Our business strategy Our ESG strategy Enterprise principles • remain broadly based in healthcare • use our reach and size for good • lead with agility and urgency • invest for enduring impact Global growth drivers • create life-enhancing innovation • deliver excellence in execution • generate shared value through partnerships • empower and inspire our employees O u r Cred o ESG FOCUS AREAS Our Purpose We blend heart, science and ingenuity to profoundly change the trajectory of health for humanity. Lead with accountability and innovation Commitment to science and data-driven decision making, compliance, integrity and responsible business practices across the value chain.
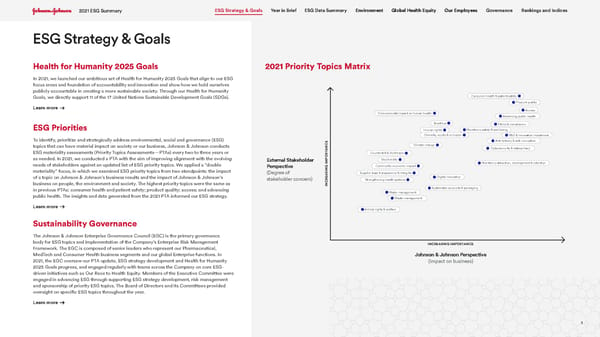
3 ESG Strategy & Goals 3 Health for Humanity 2025 Goals In 2021, we launched our ambitious set of Health for Humanity 2025 Goals that align to our ESG focus areas and foundation of accountability and innovation and show how we hold ourselves publicly accountable in creating a more sustainable society. Through our Health for Humanity Goals, we directly support 11 of the 17 United Nations Sustainable Development Goals (SDGs). ESG Priorities To identify, prioritize and strategically address environmental, social and governance (ESG) topics that can have material impact on society or our business, Johnson & Johnson conducts ESG materiality assessments (Priority Topics Assessments—PTAs) every two to three years or as needed. In 2021, we conducted a PTA with the aim of improving alignment with the evolving needs of stakeholders against an updated list of ESG priority topics. We applied a “double materiality” focus, in which we examined ESG priority topics from two standpoints: the impact of a topic on Johnson & Johnson’s business results and the impact of Johnson & Johnson’s business on people, the environment and society. The highest priority topics were the same as in previous PTAs: consumer health and patient safety; product quality; access; and advancing public health. The insights and data generated from the 2021 PTA informed our ESG strategy. Sustainability Governance The Johnson & Johnson Enterprise Governance Council (EGC) is the primary governance body for ESG topics and implementation of the Company’s Enterprise Risk Management Framework. The EGC is composed of senior leaders who represent our Pharmaceutical, MedTech and Consumer Health business segments and our global Enterprise functions. In 2021, the EGC oversaw our PTA update, ESG strategy development and Health for Humanity 2025 Goals progress, and engaged regularly with teams across the Company on core ESG- driven initiatives such as Our Race to Health Equity. Members of the Executive Committee were engaged in advancing ESG through supporting ESG strategy development, risk management and sponsorship of priority ESG topics. The Board of Directors and its Committees provided oversight on specific ESG topics throughout the year. 2021 Priority Topics Matrix INCREASING IMPORTANCE INCREASING IMPORTANCE External Stakeholder Perspective (Degree of stakeholder concern) Johnson & Johnson Perspective (Impact on business) Environmental impact on human health Consumer health & patient safety Product quality Access Advancing public health Anti-bribery & anti-corruption Bioethics Diversity, equity & inclusion Climate change Human rights R&D & innovation investment Ethics & compliance Workforce safety & well-being Cybersecurity & data privacy Workforce attraction, development & retention Digital innovation Sustainable products & packaging Counterfeit & illicit trade Biodiversity Community economic impact Supplier base transparency & integrity Strengthening health systems Water management Waste management Animal rights & welfare
4 Year in Brief Champion global health equity $5.22 billion 98% 20% spent with small and diverse suppliers, exceeding our Health for Humanity 2025 Goal in year one 87% 34% Empower our employees Advance environmental health of employees would recommend Johnson & Johnson as a great place to work ethnic/racial diversity in management positions within the U.S. OUR VOICE SURVEY 34% reduction in global CO 2 e emissions (Scope 1 + Scope 2) since 2016 campaign signed, aiming to achieve net zero carbon emissions by 2045 Race to Zero/Business Ambition for 1.5°C 180 million >2 billion 159,000 3,200 doses of our COVID-19 vaccine shipped to the African Union, COVAX and South Africa through advanced purchase agreements and country donations doses of VERMOX donated since 2006 to facilitate treatment of intestinal worms U.S. healthcare professionals and researchers provided development and support as part of Our Race to Health Equity commitments * fistula repair surgeries supported through suture donations in 17 countries Lead with accountability and innovation of employees completed Code of Business Conduct training, the highest completion rate to date increase in R&D spend * Funded in part by the Johnson & Johnson Foundation, a registered charity and a company limited by guarantee, and by the Corporation and operating companies across the Johnson & Johnson Family of Companies. The Foundation operates worldwide as Johnson & Johnson Foundation (founded 1953) and Johnson & Johnson Foundation Scotland (founded 2007). 4
5 5 SOCIAL: Global Health Equity Unit 2021 2020 2019 Number of products on the WHO List of Prequalified Medicinal Products and Vaccines as part of its Prequalification of Medicines Programme and Prequalification of Vaccine Programme # 8 6 6 Patients provided access to MDR-TB treatment # 1 3 7, 9 2 7 133,565 105,365 Cumulative doses of VERMOX (mebendazole) donated since the start of the initiative through the WHO and private donations billions 2.0 1.8 1.6 Johnson & Johnson products provided to communities impacted by natural disasters million $ $6.69 $1.86 $36.70 Total products and cash contributed globally million $ $2,738 $2,567 $1,806 ENVIRONMENT: Environmental Health (continued) Unit 2021 2020 2019 GHG emissions intensity (Scope 1 + Scope 2) by revenue MT CO 2 e / million $ 8 9 12 Percentage absolute reduction in GHG emissions – Scope 3 (upstream) vs. 2016 baseline ** % 1% increase Not reported Not reported Total water use in areas of high or extremely high baseline water stress million m 3 4.45 Not reported Not reported Total waste diverted from disposal MT 166,645 158,309 161,530 Total waste directed to disposal MT 2 8 ,1 9 2 25,250 33,744 Manufacturing and R&D sites certified to ISO 14001 % 89% 96% 97% Number of LEED-certified Johnson & Johnson buildings # 67 60 54 GOVERNANCE: Accountability & Innovation Unit 2021 2020 2019 Total tax contribution billion $ $ 1 3.1 $12.0 Not reported R&D investment million $ $14,714 $12,159 $11,355 Women in Board composition % 35.7% 35.7% 28.6% Ethnic/racial diversity in Board composition % 21.4% 21.4% + 21.4% Percentage of active employees who completed biennial Code of Business Conduct training % 98% Not reported 97% Percentage of sales and marketing employees who completed healthcare compliance training % 97% 96% 95% Employees covered by collective bargaining agreements % 30% 23% 20% Total Global Impact Spend ** billion $ $5.22 Not reported Not reported FDA inspections that resulted in zero observations % 56% 80% 76% Percent of invited suppliers participated in CDP Supply Chain Climate program % 82% 80% 84% Product recall rate by business segment Pharmaceutical % 0% 0% 0.002% MedTech % 0.059% 0.034% 0.041% Consumer Health % 0% 0% 0.091% SOCIAL: Our Employees Unit 2021 2020 2019 Total employees # 144,315 136,360 137,701 Total number of new hires # 22,543 13,594 21,948 Gender representation of global employees % women 49% 48.1% 47.8% Women in management positions ** % 48.0% 46.4% 45.8% Ethnic/racial diversity in management positions in the U.S. ** % 34% Not reported Not reported Managers and above moved across functions, country or business segment lines % 45.8% 44.6% 42.6% Overall voluntary turnover % 8% 5% 8% Spend on employee learning and development million $ $150 $108 $98 Total Recordable Injury Rate % 0.30 0.24 0.31 Lost Workday Case rate % 0.06 0.05 0.07 Number of fatalities # 0 0 0 ESG Data Summary * * For full details of our performance and notes on all data points, see our ESG Performance Data. ** Represents progress against a Health for Humanity 2025 Goal. For more information, see Health for Humanity 2025 Goals Scorecard. ENVIRONMENT: Environmental Health Unit 2021 2020 2019 Total energy use TJ 11,947 11,954 12,702 Energy intensity ratio TJ/billion $ 127 145 155 Electricity generated from renewable sources ** % 52% 54% 30% Scope 1 + Scope 2 GHG emissions, total MT CO 2 e 764,760 747,166 968,830 Percentage decrease in GHG emissions intensity (Scope 1 + Scope 2) by revenue compared to 2016 baseline MT CO 2 e / million $ 50% 44% 27%
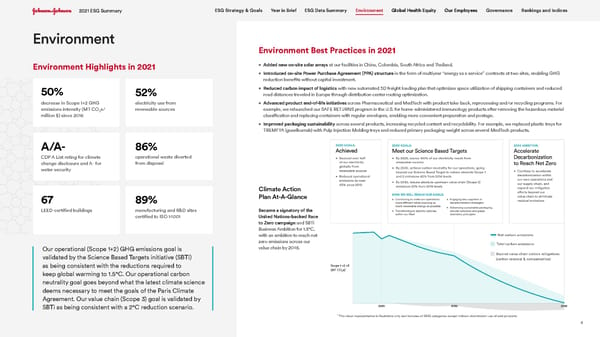
6 Environment Best Practices in 2021 • Added new on-site solar arrays at our facilities in China, Colombia, South Africa and Thailand. • Introduced on-site Power Purchase Agreement (PPA) structure in the form of multiyear “energy as a service” contracts at two sites, enabling GHG reduction benefits without capital investment. • Reduced carbon impact of logistics with new automated 3D freight loading plan that optimizes space utilization of shipping containers and reduced road distances traveled in Europe through distribution center routing optimization. • Advanced product end-of-life initiatives across Pharmaceutical and MedTech with product take-back, reprocessing and/or recycling programs. For example, we relaunched our SAFE RETURNS program in the U.S. for home-administered immunology products after removing the hazardous material classification and replacing containers with regular envelopes, enabling more convenient preparation and postage. • Improved packaging sustainability across several products, increasing recycled content and recyclability. For example, we replaced plastic trays for TREMFYA (guselkumab) with Pulp Injection Molding trays and reduced primary packaging weight across several MedTech products. 6 Environment Environment Highlights in 2021 52% 50% electricity use from renewable sources decrease in Scope 1+2 GHG emissions intensity (MT CO 2 e/ million $) since 2016 A /A- CDP A List rating for climate change disclosure and A- for water security 89% manufacturing and R&D sites certified to ISO 14001 67 LEED-certified buildings 86% operational waste diverted from disposal Our operational (Scope 1+2) GHG emissions goal is validated by the Science Based Targets initiative (SBTi) as being consistent with the reductions required to keep global warming to 1.5°C. Our operational carbon neutrality goal goes beyond what the latest climate science deems necessary to meet the goals of the Paris Climate Agreement. Our value chain (Scope 3) goal is validated by SBTi as being consistent with a 2°C reduction scenario. Climate Action Plan At-A-Glance Became a signatory of the United Nations-backed Race to Zero campaign and SBTi Business Ambition for 1.5°C, with an ambition to reach net zero emissions across our value chain by 2045.
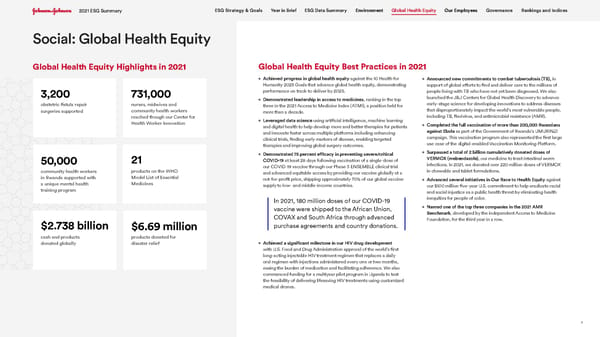
7 Global Health Equity Highlights in 2021 7 Social: Global Health Equity • Achieved progress in global health equity against the 10 Health for Humanity 2025 Goals that advance global health equity, demonstrating performance on track to deliver by 2025. • Demonstrated leadership in access to medicines , ranking in the top three in the 2021 Access to Medicine Index (ATMI), a position held for more than a decade. • Leveraged data science using artificial intelligence, machine learning and digital health to help develop more and better therapies for patients and innovate faster across multiple platforms including enhancing clinical trials, finding early markers of disease, enabling targeted therapies and improving global surgery outcomes. • Demonstrated 75 percent efficacy in preventing severe/critical COVID-19 at least 28 days following vaccination of a single-dose of our COVID-19 vaccine through our Phase 3 ENSEMBLE clinical trial and advanced equitable access by providing our vaccine globally at a not-for-profit price, shipping approximately 70% of our global vaccine supply to low- and middle-income countries. • Achieved a significant milestone in our HIV drug development with U.S. Food and Drug Administration approval of the world’s first long-acting injectable HIV treatment regimen that replaces a daily oral regimen with injections administered every one or two months, easing the burden of medication and facilitating adherence. We also commenced funding for a multiyear pilot program in Uganda to test the feasibility of delivering lifesaving HIV treatments using customized medical drones. Global Health Equity Best Practices in 2021 • Announced new commitments to combat tuberculosis (TB), in support of global efforts to find and deliver care to the millions of people living with TB who have not yet been diagnosed. We also launched the J&J Centers for Global Health Discovery to advance early-stage science for developing innovations to address diseases that disproportionately impact the world’s most vulnerable people, including TB, flavivirus, and antimicrobial resistance (AMR). • Completed the full vaccination of more than 200,000 Rwandans against Ebola as part of the Government of Rwanda’s UMURINZI campaign. This vaccination program also represented the first large use case of the digital-enabled Vaccination Monitoring Platform. • Surpassed a total of 2 billion cumulatively donated doses of VERMOX (mebendazole) , our medicine to treat intestinal worm infections. In 2021, we donated over 220 million doses of VERMOX in chewable and tablet formulations. • Advanced several initiatives in Our Race to Health Equity against our $100 million five-year U.S. commitment to help eradicate racial and social injustice as a public health threat by eliminating health inequities for people of color. • Named one of the top three companies in the 2021 AMR Benchmark , developed by the independent Access to Medicine Foundation, for the third year in a row. In 2021, 180 million doses of our COVID-19 vaccine were shipped to the African Union, COVAX and South Africa through advanced purchase agreements and country donations. 731,000 3,200 nurses, midwives and community health workers reached though our Center for Health Worker Innovation obstetric fistula repair surgeries supported 50,000 community health workers in Rwanda supported with a unique mental health training program $6.69 million products donated for disaster relief $2.738 billion cash and products donated globally 21 products on the WHO Model List of Essential Medicines

This is a modal window.
8 Our Employees Highlights in 2021 8 Social: Our Employees 48.1% 48% women full-time employees women in management positions 34% ethnic / racial diversity in management positions 0.30 Total Recordable Injury Rate $150 million spend on employee learning and development Our Employees Best Practices in 2021 • Expanded learning and development programs across the organization with a focus on first-time and experienced people leader skills and competencies. • Introduced global hybrid working model, J&J Flex, to enable remote working and virtual employee onboarding. • Launched a new Diversity, Equity & Inclusion (DEI) Strategy placing greater emphasis on equity and leadership accountability, with DEI goals for VPs across the organization. • Conducted biennial Our Voice Survey across 77 countries in 36 languages, with a 91% participation rate, an 82% favorability rate, and key select results: - 94% agreed: I am willing to give extra effort to help Johnson & Johnson meet its goals. - 91% agreed: I would like to be working at Johnson & Johnson one year from now. - 87% agreed: I would recommend Johnson & Johnson as a great place to work. • Drove STEM awareness by engaging 317,800 girls through hundreds of events and activities to expose more girls to science and encourage the uptake of science-based careers as part of our Health for Humanity 2025 STEM Goal. • Maintained our Talent for Good programs across the Enterprise, with hundreds of employees taking part in skills-based pro bono programs for our communities. • Maintained COVID-19 safety protection for employees by implementing specific protocols across our sites, administering COVID-19 vaccines to employees and providing a Global Recharge Day to help employees build resilience. • Expanded membership of our enterprise-wide Employee Resource Groups (ERGs) by 16% to 28,100 and added ERG chapters both in the U.S. and internationally to accommodate the increasing engagement and interest of employees. • Introduced new benefits for employee well-being including the extension of paid parental leave from eight weeks to 12 weeks globally; expansion of Global Exercise Reimbursement to include additional virtual subscriptions and at-home equipment; and new Military Spouse Time-Off and Military Leave policies for U.S./Puerto Rico employees. 8% overall voluntary turnover
9 9 Governance $14.7 billion $13.1 billion R&D spend, an increase of 20% compared to 2020 total tax contribution $5.22 billion Global Impact Spend with small and diverse suppliers 82% of invited suppliers participated in CDP Supply Chain Climate program 35.7% women on the Board of Directors Governance Best Practices in 2021 • Announced a significant change to our corporate governance with a new role of Executive Chairman of Johnson & Johnson (Alex Gorsky), effective January 3, 2022, alongside the appointment of a new Chief Executive Officer, Joaquin Duato. • Conducted Health Care Compliance training, completed by 97% of sales and marketing employees, in addition to Code of Business Conduct training across the Enterprise. • Revised Our Credo escalation procedure and communicated it broadly to all employees, emphasizing that every employee is empowered to speak up on any matter relating to ethical conduct or compliance. • Enhanced our strategic approach to human rights by conducting an enterprise-level gap analysis of our human rights approach and held workshops to further develop and define a long-term strategic framework that will shape our human rights focus areas and action plans. • Advanced human rights in our own operations with human rights audits at key Johnson & Johnson sites; reinforcement of fair labor practices in our own operations with our annual living wage analysis and wage adjustments; and a new examination of the potential risk of excessive work hours for employees in our operations. In 2021, we also introduced a Foundational Human Rights Learning and Education Course in 26 languages. • Completed the Transparency International UK Corporate Anti- Corruption Benchmark , which is designed and verified by independent experts and includes meeting the legal requirements of the UK Bribery Act and the U.S. Foreign Corrupt Practices Act. Our overall score ranked highly in the benchmark relative to other industry participants. • Expanded our Supplier Sustainability Program to a total of 29,400 suppliers that includes conformance to our Responsibility Standards for Suppliers and EcoVadis assessments. • Initiated three Partnerships for Good with suppliers to advance innovative solutions in human rights, diversity performance and engagement in the End Workplace TB initiative. • Implemented initiatives to advance diverse supplier spend including expansion of our Buy Diverse digital procurement platform, engaging advocacy organizations in a global virtual procurement matchmaking event, and collaborating with 14 NGO partners outside the U.S., to promote minority business enterprises and social enterprises in Europe. • Began adopting new ways of monitoring and detecting illicit trade through enhanced product security intelligence and analytics with a new mobile app that provides field-based product authentication capabilities to enhance product security. 98% of employees completed Code of Business Conduct training Governance Highlights in 2021
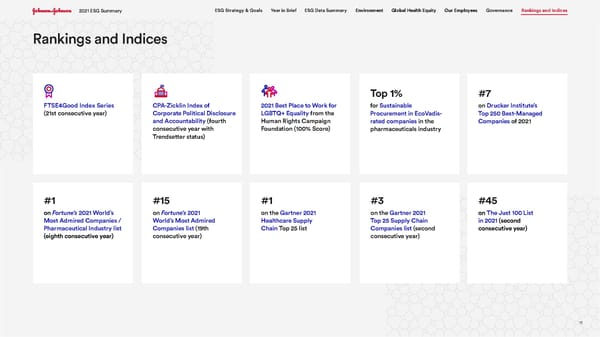
Rankings and Indices FTSE4Good Index Series (21st consecutive year) #1 on Fortune’s 2021 World’s Most Admired Companies / Pharmaceutical Industry list (eighth consecutive year) CPA-Zicklin Index of Corporate Political Disclosure and Accountability (fourth consecutive year with Trendsetter status) #15 on Fortune’s 2021 World’s Most Admired Companies list (19th consecutive year) 2021 Best Place to Work for LGBTQ+ Equality from the Human Rights Campaign Foundation (100% Score) #3 on the Gartner 2021 Top 25 Supply Chain Companies list (second consecutive year) Top 1% for Sustainable Procurement in EcoVadis- rated companies in the pharmaceuticals industry #7 on Drucker Institute’s Top 250 Best-Managed Companies of 2021 #45 on The Just 100 List in 2021 (second consecutive year) 10 #1 on the Gartner 2021 Healthcare Supply Chain Top 25 list
