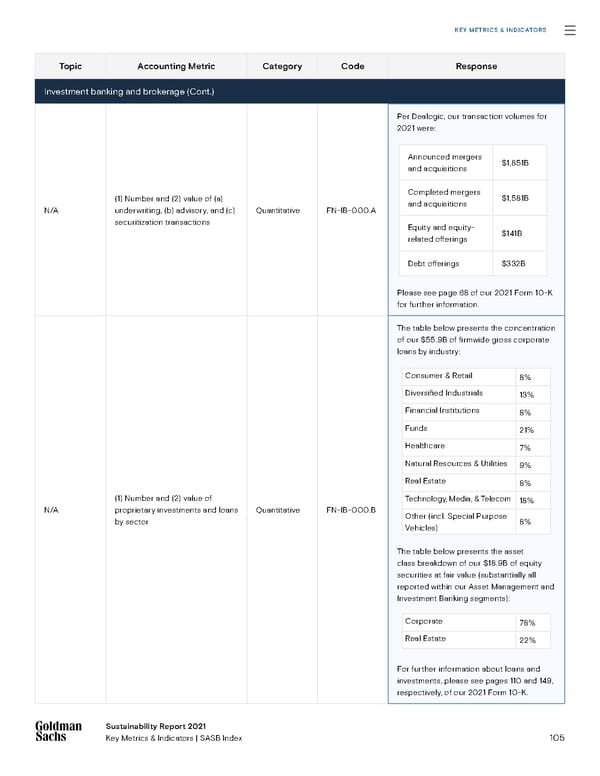
105 Sustainability Report 2021 Key Metrics & Indicators | SASB Index Sustainability Report 2021 Key Metrics & Indicators Topic Accounting Metric Category Code Response Investment banking and brokerage (Cont.) N/A (1) Number and (2) value of (a) underwriting, (b) advisory, and (c) securitization transactions Quantitative FN-IB-000.A Per Dealogic, our transaction volumes for 2021 were: Please see page 68 of our 2021 Form 10-K for further information. N/A (1) Number and (2) value of proprietary investments and loans by sector Quantitative FN-IB-000.B The table below presents the concentration of our $55.9B of firmwide gross corporate loans by industry: The table below presents the asset class breakdown of our $18.9B of equity securities at fair value (substantially all reported within our Asset Management and Investment Banking segments): For further information about loans and investments, please see pages 110 and 149, respectively, of our 2021 Form 10-K. Announced mergers and acquisitions $1,851B Completed mergers and acquisitions $1,581B Equity and equity- related offerings $141B Debt offerings $332B Consumer & Retail 8% Diversified Industrials 13% Financial Institutions 8% Funds 21% Healthcare 7% Natural Resources & Utilities 9% Real Estate 8% Technology, Media, & Telecom 18% Other (incl. Special Purpose Vehicles) 8% Corporate 78% Real Estate 22% KEY METRICS & INDICATORS
 Goldman Sachs Group Sustainability Report Page 104 Page 106