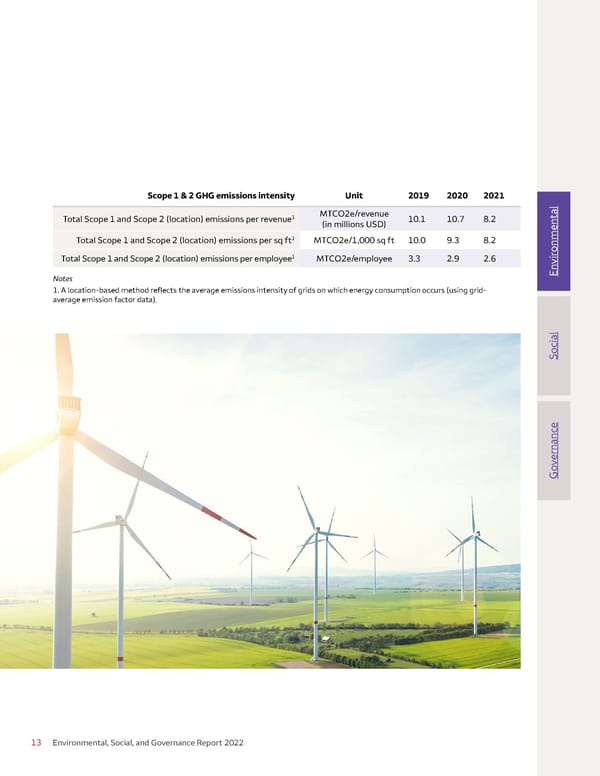
Scope 1 & 2 GHG emissions intensity Unit 2019 2020 2021 Total Scope 1 and Scope 2 (location) emissions per revenue1 MTCO2e/revenue 10.1 10.7 8.2 (in millions USD) Total Scope 1 and Scope 2 (location) emissions per sq ft1 MTCO2e/1,000 sq ft 10.0 9.3 8.2 onmental Total Scope 1 and Scope 2 (location) emissions per employee1 MTCO2e/employee 3.3 2.9 2.6 Notes Envir 1. A location-based method re昀氀ects the average emissions intensity of grids on which energy consumption occurs (using grid- average emission factor data). Social ernance v Go 13 Environmental, Social, and Governance Report 2022
 Environmental, Social, and Governance (ESG) Report Page 12 Page 14