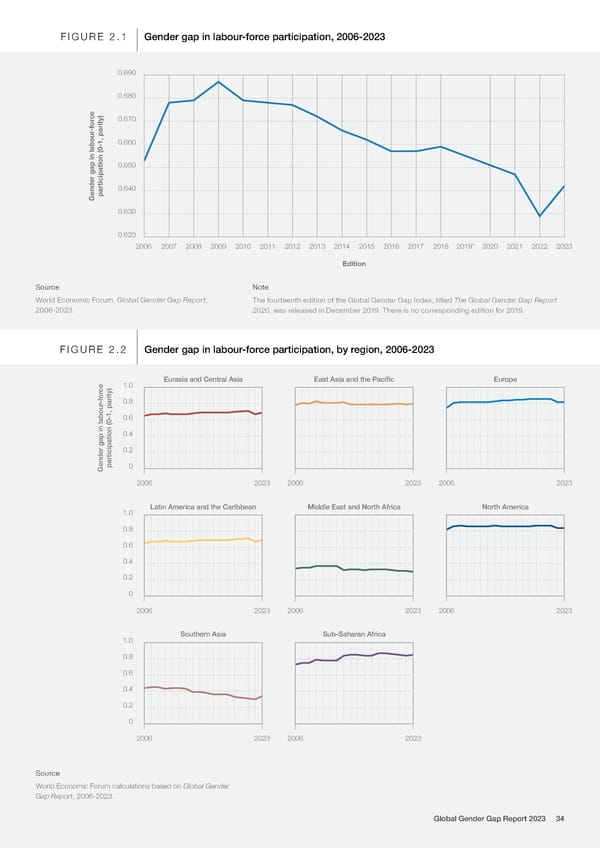
FIGURE 2.1 Gender gap in labour-force participation, 2006-2023 0.690 0.680 ce 0.670 -for 0.660 0.650 participation (0-1, parity)0.640 Gender gap in labour 0.630 0.620 2006 2007 2008 2009 2010 2011 2012 2013 2014 2015 2016 2017 2018 2019* 2020 2021 2022 2023 Edition Source Note World Economic Forum, Global Gender Gap Report, The fourteenth edition of the Global Gender Gap Index, titled The Global Gender Gap Report 2006-2023. 2020, was released in December 2019. There is no corresponding edition for 2019. FIGURE 2.2 Gender gap in labour-force participation, by region, 2006-2023 1.0 Eurasia and Central Asia East Asia and the Pacific Europe ce -for 0.8 0.6 0.4 0.2 Gender gap in labourparticipation (0-1, parity)0 2006 2023 2006 2023 2006 2023 1.0 Latin America and the Caribbean Middle East and North Africa North America 0.8 0.6 0.4 0.2 0 2006 2023 2006 2023 2006 2023 1.0 Southern Asia Sub-Saharan Africa 0.8 0.6 0.4 0.2 0 2006 2023 2006 2023 Source World Economic Forum calculations based on Global Gender Gap Report, 2006-2023. Global Gender Gap Report 2023 34
 Global Gender Gap Report 2023 Page 33 Page 35