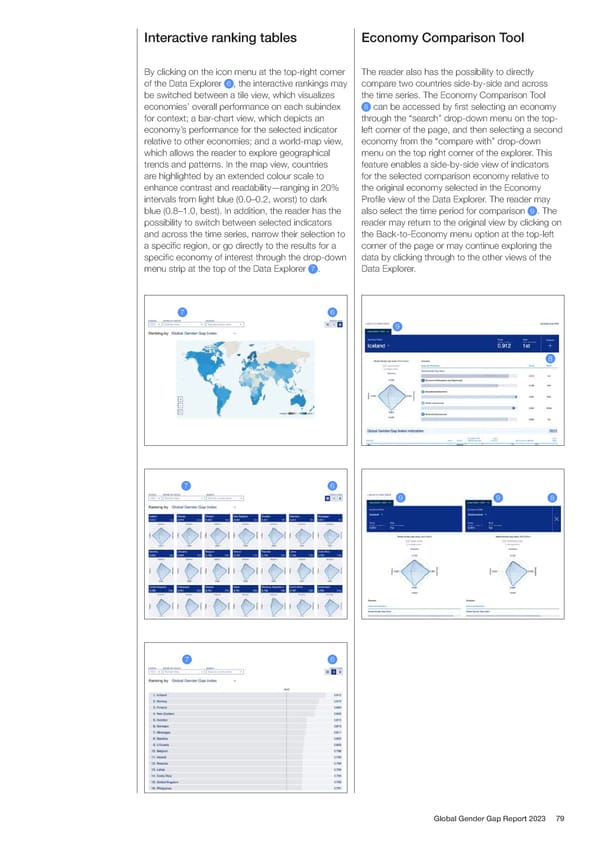
Interactive ranking tables Economy Comparison Tool By clicking on the icon menu at the top-right corner The reader also has the possibility to directly of the Data Explorer 6 , the interactive rankings may compare two countries side-by-side and across be switched between a tile view, which visualizes the time series. The Economy Comparison Tool economies’ overall performance on each subindex 8 can be accessed by 昀椀rst selecting an economy for context; a bar-chart view, which depicts an through the “search” drop-down menu on the top- economy’s performance for the selected indicator left corner of the page, and then selecting a second relative to other economies; and a world-map view, economy from the “compare with” drop-down which allows the reader to explore geographical menu on the top right corner of the explorer. This trends and patterns. In the map view, countries feature enables a side-by-side view of indicators are highlighted by an extended colour scale to for the selected comparison economy relative to enhance contrast and readability—ranging in 20% the original economy selected in the Economy intervals from light blue (0.0–0.2, worst) to dark Pro昀椀le view of the Data Explorer. The reader may blue (0.8–1.0, best). In addition, the reader has the also select the time period for comparison 9 . The possibility to switch between selected indicators reader may return to the original view by clicking on and across the time series, narrow their selection to the Back-to-Economy menu option at the top-left a speci昀椀c region, or go directly to the results for a corner of the page or may continue exploring the speci昀椀c economy of interest through the drop-down data by clicking through to the other views of the menu strip at the top of the Data Explorer 7 . Data Explorer. 7 6 9 8 7 6 9 9 8 7 6 Global Gender Gap Report 2023 79
 Global Gender Gap Report 2023 Page 78 Page 80