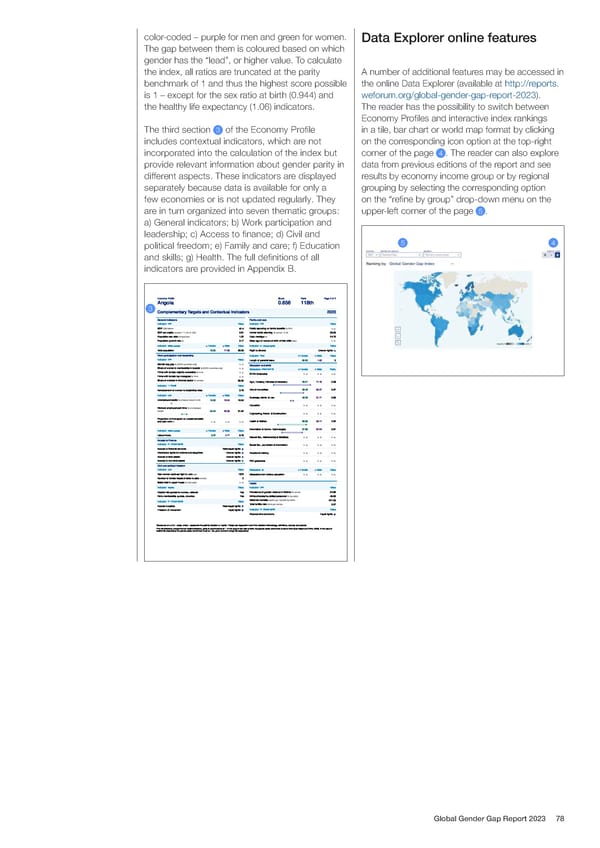
color-coded – purple for men and green for women. Data Explorer online features The gap between them is coloured based on which gender has the “lead”, or higher value. To calculate the index, all ratios are truncated at the parity A number of additional features may be accessed in benchmark of 1 and thus the highest score possible the online Data Explorer (available at http://reports. is 1 – except for the sex ratio at birth (0.944) and weforum.org/global-gender-gap-report-2023). the healthy life expectancy (1.06) indicators. The reader has the possibility to switch between Economy Pro昀椀les and interactive index rankings The third section 3 of the Economy Pro昀椀le in a tile, bar chart or world map format by clicking includes contextual indicators, which are not on the corresponding icon option at the top-right incorporated into the calculation of the index but corner of the page 4 . The reader can also explore provide relevant information about gender parity in data from previous editions of the report and see different aspects. These indicators are displayed results by economy income group or by regional separately because data is available for only a grouping by selecting the corresponding option few economies or is not updated regularly. They on the “re昀椀ne by group” drop-down menu on the are in turn organized into seven thematic groups: upper-left corner of the page 5 . a) General indicators; b) Work participation and leadership; c) Access to 昀椀nance; d) Civil and political freedom; e) Family and care; f) Education 5 4 and skills; g) Health. The full de昀椀nitions of all indicators are provided in Appendix B. Economy Profile Score Rank Page 2 of 2 3 Angola 0.656 118th Complementary Targets and Contextual Indicators 2023 General indicators Family and care Unit Unit Indicator Indicator Value Value GDPUS$ billions Public spending on family benefits % GPD 67.4 n. a. GDP per capita constant '17, intl. $ 1000 5.91 Unmet family planning % women 15-49 38.00 Population sex ratio female/male 1.02 Early marriage % 24.70 Population growth rate % Mean age of women at birth of first child years 3.17 n. a. Indicator Million people Female Male Value Indicator 0-1 (Equal rights) Value Total population 18.00 17.59 35.59 Right to divorce Uneven rights Work participation and leadership Days Indicator Female Male Value Unit Indicator Value Length of parental leave 90.00 1.00 0 Gender pay gap % (OECD countries only) n. a. Education and skills Share of women's membership in boards % (OECD countries only) n. a. Attainment % Graduates Female Male Parity Firms with female majority ownership % firms n. a. STEM Graduates n. a. n. a. n. a. Firms with female top managers % firms n. a. Share of workers in informal sector % workers 90.30 Agri., Forestry, Fisheries & Veterinary 28.21 71.79 0.39 1-7 (best) Indicator Value Arts & Humanities 36.43 63.57 0.57 Advancement of women to leadership roles 3.78 Indicator Unit Female Male Value Business, Admin. & Law 48.29 51.71 0.93 Unemployed adults % of labour force (15-64) 16.33 16.34 16.34 Education n. a. n. a. n. a. Workers employed part-time % of employed people 34.34 28.59 31.52 Engineering, Manuf. & Construction n. a. n. a. n. a. Proportion of time spent on unpaid domestic Health & Welfare 66.83 33.17 2.02 and care work % n. a. n. a. n. a. Information & Comm. Technologies 37.96 62.04 0.61 Million people Indicator Female Male Value Labour-force 5.02 4.77 9.79 Natural Sci., Mathematics & Statistics n. a. n. a. n. a. Access to finance 0-1 (Equal rights) Indicator Value Social Sci., Journalism & Information n. a. n. a. n. a. Access to financial services Near-equal rights Inheritance rights for widows and daughters Uneven rights Vocational training n. a. n. a. n. a. Access to land assets Uneven rights Access to non-land assets Uneven rights PhD graduates n. a. n. a. n. a. Civil and political freedom Unit Indicator Value Graduates % Female Male Value Year women received right to vote year 1975 Graduates from tertiary education n. a. n. a. n. a. Number of female heads of state to date number 0 Seats held in upper house % total seats n. a. Health Unit Indicator Value Indicator Yes/No Value % women 34.80 Prevalence of gender violence in lifetime Election list quotas for women, national Yes Party membership quotas, voluntary Yes Births attended by skilled personnel % live births 49.60 Maternal mortality deaths per 100,000 live births 241.00 0-1 (Equal rights) Indicator Value Total fertility rate births per woman 5.37 Access to justice Near-equal rights 0-1 (Equal rights) Indicator Value Freedom of movement Equal rights Reproductive autonomy Equal rights *Scores are on a 0 to 1 scale, where 1 represents the optimal situation or “parity”. Please see Appendix A and B for detailed methodology, definitions, sources and periods. **For all indicators, except the two health indicators, parity is benchmarked at 1. In the case of sex ratio at birth, the gender parity benchmark is set at 0.944 (see Klasen and Wink, 2003). In the case of healthy life expectancy the gender parity benchmark is set at 1.06, given women's longer life expectancy. Global Gender Gap Report 2023 78
 Global Gender Gap Report 2023 Page 77 Page 79