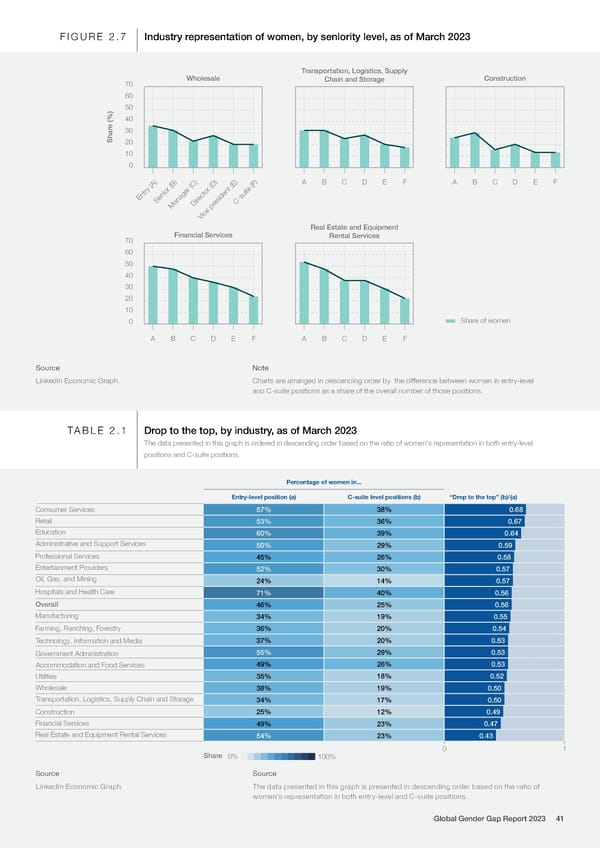
FIGURE 2.7 Industry representation of women, by seniority level, as of March 2023 Transportation, Logistics, Supply 70 Wholesale Chain and Storage Construction 60 50 e (%)40 30 Shar 20 10 0 A B C D E F A B C D E F Entry (A) ector (D) Senior (B) C-suite (F) Dir esident (E) Manager (C) Vice pr Real Estate and Equipment 70 Financial Services Rental Services 60 50 40 30 20 10 0 Share of women A B C D E F A B C D E F Source Note LinkedIn Economic Graph. Charts are arranged in descending order by the difference between women in entry-level and C-suite positions as a share of the overall number of those positions. TABLE 2.1 Drop to the top, by industry, as of March 2023 The data presented in this graph is ordered in descending order based on the ratio of women's representation in both entry-level positions and C-suite positions. Percentage of women in... Entry-level position (a) C-suite level positions (b) “Drop to the top” (b)/(a) Consumer Services 57% 38% 0.68 Retail 53% 36% 0.67 Education 60% 39% 0.64 Administrative and Support Services 50% 29% 0.59 Professional Services 45% 26% 0.58 Entertainment Providers 52% 30% 0.57 Oil, Gas, and Mining 24% 14% 0.57 Hospitals and Health Care 71% 40% 0.56 Overall 46% 25% 0.56 Manufacturing 34% 19% 0.55 Farming, Ranching, Forestry 36% 20% 0.54 Technology, Information and Media 37% 20% 0.53 Government Administration 55% 29% 0.53 Accommodation and Food Services 49% 26% 0.53 Utilities 35% 18% 0.52 Wholesale 38% 19% 0.50 Transportation, Logistics, Supply Chain and Storage 34% 17% 0.50 Construction 25% 12% 0.49 Financial Services 49% 23% 0.47 Real Estate and Equipment Rental Services 54% 23% 0.43 0 1 Share 0% 100% Source Source LinkedIn Economic Graph. The data presented in this graph is presented in descending order based on the ratio of women's representation in both entry-level and C-suite positions. Global Gender Gap Report 2023 41
 Global Gender Gap Report 2023 Page 40 Page 42