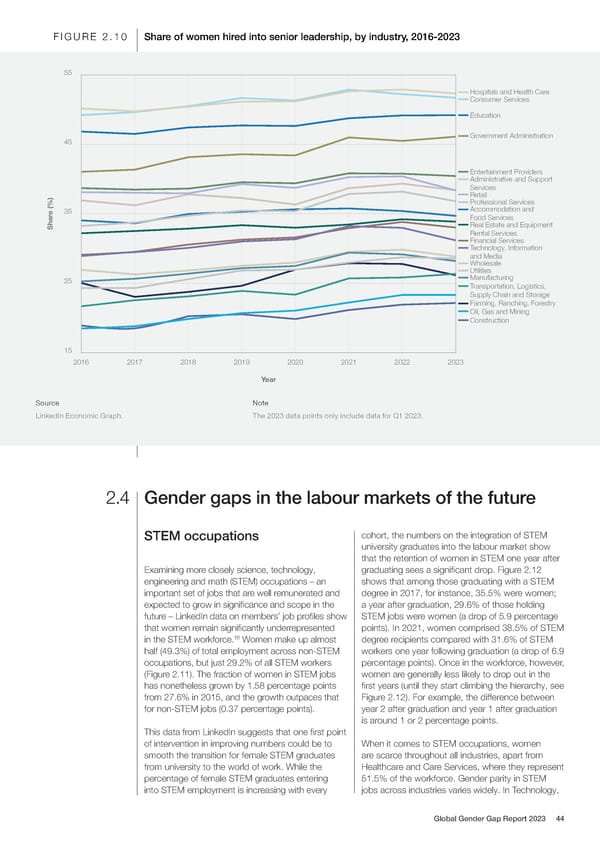
FIGURE 2.10 Share of women hired into senior leadership, by industry, 2016-2023 55 Hospitals and Health Care Consumer Services Education 45 Government Administration Entertainment Providers Administrative and Support Services Retail Professional Services e (%)35 Accommodation and Food Services Shar Real Estate and Equipment Rental Services Financial Services Technology, Information and Media Wholesale Utilities 25 Manufacturing Transportation, Logistics, Supply Chain and Storage Farming, Ranching, Forestry Oil, Gas and Mining Construction 15 2016 2017 2018 2019 2020 2021 2022 2023 Year Source Note LinkedIn Economic Graph. The 2023 data points only include data for Q1 2023. 2.4 Gender gaps in the labour markets of the future STEM occupations cohort, the numbers on the integration of STEM university graduates into the labour market show that the retention of women in STEM one year after Examining more closely science, technology, graduating sees a signi昀椀cant drop. Figure 2.12 engineering and math (STEM) occupations – an shows that among those graduating with a STEM important set of jobs that are well remunerated and degree in 2017, for instance, 35.5% were women; expected to grow in signi昀椀cance and scope in the a year after graduation, 29.6% of those holding future – LinkedIn data on members’ job pro昀椀les show STEM jobs were women (a drop of 5.9 percentage that women remain signi昀椀cantly underrepresented points). In 2021, women comprised 38.5% of STEM 16 in the STEM workforce. Women make up almost degree recipients compared with 31.6% of STEM half (49.3%) of total employment across non-STEM workers one year following graduation (a drop of 6.9 occupations, but just 29.2% of all STEM workers percentage points). Once in the workforce, however, (Figure 2.11). The fraction of women in STEM jobs women are generally less likely to drop out in the has nonetheless grown by 1.58 percentage points 昀椀rst years (until they start climbing the hierarchy, see from 27.6% in 2015, and the growth outpaces that Figure 2.12). For example, the difference between for non-STEM jobs (0.37 percentage points). year 2 after graduation and year 1 after graduation is around 1 or 2 percentage points. This data from LinkedIn suggests that one 昀椀rst point of intervention in improving numbers could be to When it comes to STEM occupations, women smooth the transition for female STEM graduates are scarce throughout all industries, apart from from university to the world of work. While the Healthcare and Care Services, where they represent percentage of female STEM graduates entering 51.5% of the workforce. Gender parity in STEM into STEM employment is increasing with every jobs across industries varies widely. In Technology, Global Gender Gap Report 2023 44
 Global Gender Gap Report 2023 Page 43 Page 45