Future Load Scenarios for Southwest Power Pool
This document explores projected electricity demand scenarios for the Southwest Power Pool region as of September 2024.
FUTURE LOAD SCENARIOS FOR SOUTHWEST SEPTEMBER 2024
ABOUT THIS REPORT Southwest Power Pool commissioned Evolved Energy Research to produce future load Scenarios for use in the Future Energy and Resource Needs Study (FERNS). These Scenarios explore varying levels of electrification and examine potential load growth from data centers and hydrogen production. This report summarizes the work and documents assumptions. PREPARED BY Ryan Jones Jonathan Kadish Ben Preneta Trevor Kann Ben Haley ABOUT EVOLVED ENERGY RESEARCH Evolved Energy Research (EER) is a research and consulting firm focused on questions posed by transformation of the energy economy. Its consulting work and insight, supported by sophisticated technical analyses of energy systems, is designed to support strategic decision-making for policymakers, stakeholders, utilities, investors, and technology companies. Copyright © 2024 Evolved Energy Research LLC. All rights reserved.
TC TABLE OF CONTENTS GLOSSARY OF KEY TERMS 2 I EXECUTIVE SUMMARY 3 II MODELING METHODOLOGY 5 SPP Load Scenarios 6 EnergyPATHWAYS Modeling 7 EnergyPATHWAYS: SPP Customization 12 III RESULTS 22 IV DISCUSSION & CONCLUSIONS 30 V APPENDIX 32 EnergyPATHWAYS 32
GLOSSARY OF KEY TERMS Curtailment The reduction of renewable energy generation (wind, solar, etc.) output due to an oversupply or grid constraints. Data Centers Facilities that house computer systems, storage systems, and telecommunications equipment, supporting large-scale computing and data processing needs. Data centers consume significant amounts of electricity, especially for cooling and running servers. With the growth of technologies like cloud computing, artificial intelligence (AI), and cryptocurrency mining, data centers have become critical loads in electricity grids, often requiring high reliability and low latency. Demand A system where consumers or businesses reduce their electricity use during peak periods Response in response to signals from grid operators. Decarbonization The process of reducing carbon dioxide emissions from energy production, primarily through transitioning to low-carbon energy sources. Electrification The process of replacing technologies that rely on fossil fuels with electric alternatives, such as electric vehicles or electric heating systems. Electrolysis A process that uses electricity to split water into hydrogen and oxygen. Load Shape Time-varying electricity demand, oftentimes represented with hourly data. Load Shedding An emergency strategy to reduce electricity demand by temporarily turning off the supply to certain areas or consumers. Non-Coincident The highest level of electricity demand that occurs at different times for different end-uses Peak Demand rather than the overall peak demand for the system as a whole. Peak Demand The highest amount of electricity used at any given time for the system as a whole. Random Forest A machine learning technique used to predict continuous variables, such as energy Regression demand, by averaging the results from multiple decision trees. Vehicle-to-Grid A system in which plug-in electric vehicles (EVs) interact with the power grid to either (V2G) supply power back to the grid or manage charging in response to grid demand. SPP FUTURE LOAD SCENARIOS | EVOLVED ENERGY RESEARCH | 2
I EXECUTIVE SUMMARY Evolved Energy Research (EER) was contracted by Southwest Power Pool (SPP) in September 2023 to produce hourly electricity load shapes for the SPP territory that reflect three electrification technology adoption Scenarios: low (Baseline), modest (Moderate Electrification), and aggressive (Full Electrification). Understanding the potential evolution of these load shapes is crucial for understanding when and how energy is being used and can help in generation capacity and transmission planning, efforts to manage grid stability, and optimizing the integration of renewable energy sources. Rapid increases from electric technologies that are only minimally represented in current electricity loads will create unique challenges and opportunities for grid operators like SPP. For instance, demand by passenger electric vehicles (EVs) may set new peaks, especially during evening charging, requiring upgrades to grid infrastructure. However, smart charging and vehicle-to-grid (V2G) technologies can provide flexibility by shifting demand and supporting grid stability. Commercial trucks transitioning to battery (direct electrification) and hydrogen fuel cells (electrification of fuel production) will represent new electricity demands entirely, with additional spatial and temporal planning implications beyond historical commercial customers. Proper siting of these loads with regards to both travel patterns and grid topology, and their potential employment as SPP FUTURE LOAD SCENARIOS | EVOLVED ENERGY RESEARCH | 3
This is a modal window.
flexible loads, can reduce new infrastructure needs. Electrification of space heating may represent a relatively small share of annual electricity demand but contribute towards changing peaks from summer to winter. Finally, new data center and electrolysis loads have the potential to further increase loads in SPP’s service territory and are loads that may have higher (data center) or lower (electrolysis) reliability expectations than that of typical industrial customers. This study represents an important planning step in illustrating the potential scale of these new demands across SPPs territory as well as their spatial and temporal characteristics which may drive new insights into rational grid planning in an electrifying world. To this end, EER produced load shapes for each of SPP’s 59 demand groups for economic years 2023, 2025, 2029, 2034, 2040, and 2050. The exhaustiveness of this dataset was required to serve the principal purpose of this analysis as inputs into the 1 SPP Future Energy and Resources Needs Study (FERNS). Some key insights EER determined from a review of both the Moderate Electrification and Full Electrification Scenarios included: ƒ Opportunistic Loads The scale of uncertainty for new loads from data centers and hydrogen electrolysis is massive due to the overall sector growth uncertainty combined with locational uncertainty. This locational uncertainty is somewhat unique because they are potentially competitive loads, i.e., their growth in a service territory will be partly a function of electricity price and resource availability competition. SPPs high-quality renewable resources may be a significant draw. This makes them unlike other loads where future load growth is not determined by relative competition between regions but by fixed served demands within a region (i.e., vehicle miles traveled). Additionally, their potential scale is unlike other loads; a single facility can be hundreds of MWs. ƒ Electric Vehicle Growth Even a moderate penetration of EVs will increase electricity demands significantly, and, partially depending on charging behavior, could necessitate large investments in wires and generation capacity. ƒ Seasonal Peaks Electrification of heating and will lead to higher winter peaks with notable regional variations across SPPs territory. The impacts of this for planning purposes will depend on comparative winter and summer peaks (winter peaking/summer peaking/dual peaking) and seasonal resource performance. This technical report details the modeling methodology to project future loads Scenarios, discusses the results of these Scenario analyses, and suggests future areas of study to address the uncertainties of renewable energy integration and load management in these new electricity load growth paradigms. 1 Brattle Group. “SPP Future Energy and Resource Needs Study (FERNS): Capacity Expansion Modeling Approach, Feb. 2024. SPP FUTURE LOAD SCENARIOS | EVOLVED ENERGY RESEARCH | 4
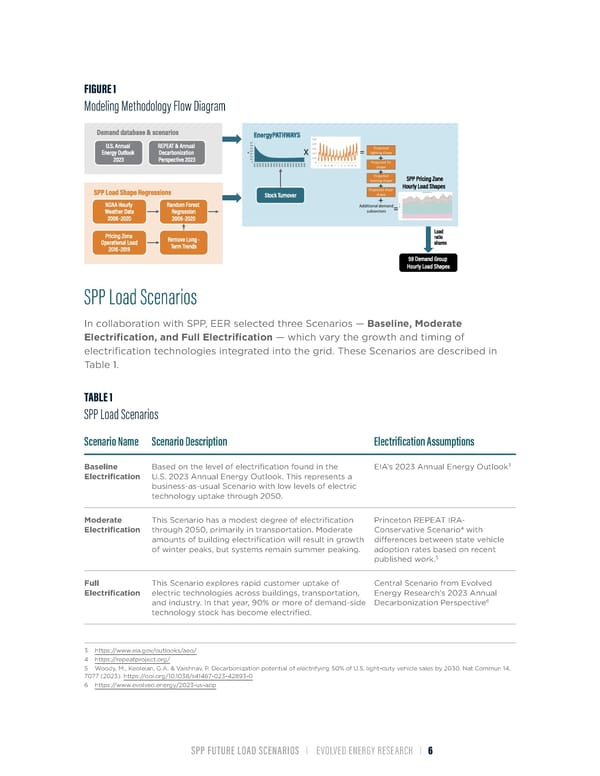
II MODELING METHODOLOGY Evolved Energy Research (EER) created the EnergyPATHWAYS (EP) model to build bottom-up projections of future energy demand on both an aggregate annual basis as well as the hourly fidelity necessary in electricity planning. This energy demand spans not just electricity but all energy carrier demand, which is critical when modeling Scenarios where current fuel demand may become future electricity demand. This model has been used in dozens of engagements across the U.S. and abroad to model different prospective energy pathways including the National Renewable Energy Laboratory’s 2 Electrification Futures Study , one of the first and most detailed studies of end-use electrification to date. The U.S. model is built on a proprietary EER database that allows us to downscale to any geographic representation, like utility service territory or RTO boundaries. In this case, the model was run for each of SPP’s Pricing zones. To develop the electrification Scenarios for these regions EP takes two categories of inputs (Figure 1). The first is a set of Scenario inputs, which take the form of different levels of presumed electrification penetration across various sectors (e.g., transportation, buildings, industry). These inputs leverage EP’s stock turnover functionality to project electricity demand annually to 2050 by electricity end-use. The second set of inputs is SPP- specific load shapes, expanded from available 2016-2019 data to cover a broader range of weather events over 2006-2020 using a random forest regression methodology, a machine learning technique used to predict continuous variables, such as energy demand, prices, or production, based on various input features or parameters (described in further detail below, in 3. Regression Specifications). Combining the annual energy projections, technology-specific load-shapes, and SPP’s historical hourly load data, the model synthesizes hourly load shapes for each SPP Pricing Zone. This is then spatially disaggregated further to SPP’s 59 Demand Groups based on load ratio shares. A complete description of the EP model and its underlying functionality can be found in the Appendix. 2 https://www.nrel.gov/analysis/electrification-futures.html SPP FUTURE LOAD SCENARIOS | EVOLVED ENERGY RESEARCH | 5
FIGURE 1 Modeling Methodology Flow Diagram SPP Load Scenarios In collaboration with SPP, EER selected three Scenarios — Baseline, Moderate Electrification, and Full Electrification — which vary the growth and timing of electrification technologies integrated into the grid. These Scenarios are described in Table 1. TABLE 1 SPP Load Scenarios Scenario Name Scenario Description Electrification Assumptions 3 Baseline Based on the level of electrification found in the EIA’s 2023 Annual Energy Outlook Electrification U.S. 2023 Annual Energy Outlook. This represents a business-as-usual Scenario with low levels of electric technology uptake through 2050. Moderate This Scenario has a modest degree of electrification Princeton REPEAT IRA- 4 Electrification through 2050, primarily in transportation. Moderate Conservative Scenario with amounts of building electrification will result in growth differences between state vehicle of winter peaks, but systems remain summer peaking. adoption rates based on recent 5 published work. Full This Scenario explores rapid customer uptake of Central Scenario from Evolved Electrification electric technologies across buildings, transportation, Energy Research’s 2023 Annual 6 and industry. In that year, 90% or more of demand-side Decarbonization Perspective technology stock has become electrified. 3 https://www.eia.gov/outlooks/aeo/ 4 https://repeatproject.org/ 5 Woody, M., Keoleian, G.A. & Vaishnav, P. Decarbonization potential of electrifying 50% of U.S. light-duty vehicle sales by 2030. Nat Commun 14, 7077 (2023). https://doi.org/10.1038/s41467-023-42893-0 6 https://www.evolved.energy/2023-us-adp SPP FUTURE LOAD SCENARIOS | EVOLVED ENERGY RESEARCH | 6
The Baseline Scenario represents a business-as-usual approach, based on the Annual Energy Outlook, with low levels of electric technology uptake through 2050. This Scenario assumes slower electrification rates, driven by conservative assumptions about customer adoption of new technologies. Compared to the Moderate Electrification and Full Electrification Scenarios, it reflects the least ambitious pathway, with limited progress toward meeting EPA regulations on greenhouse gas emissions from passenger cars and trucks. The Moderate Electrification Scenario projects a modest degree of electrification through 2050, primarily in transportation, under the assumption that EV costs, including IRA tax credits, will reach parity with internal combustion engine vehicles by the late 2020s or early 2030s. It assumes that 40% of new vehicles sold in 2030 will be plug-in vehicles, with adoption tapering off in later years. Building electrification is also modest, leading to some winter peak growth but maintaining most of the system as summer peaking overall. Compared to the Baseline Scenario, this scenario assumes greater technological uptake, but it still falls short of the aggressive electrification targets in the Full Electrification Scenario. The Full Electrification Scenario envisions rapid adoption of electric technologies across buildings, transportation, and industry. By 2040, 100% of vehicle sales are expected to be electric, with over 90% of the vehicle stock becoming electric or fuel cell vehicles by 2050. This Scenario also includes wholesale electrification in buildings (space heating, water heating, and cooking) and industrial processes (heating, machine drives, etc.) aimed at achieving deep cuts in greenhouse gas emissions by mid-century. This Scenario also assumes higher rates of electric efÏciency in buildings and industry, which reflecting the extensive efforts needed to meet stringent climate targets as well as higher costs of delivered energy resulting in additional conservation efforts. EnergyPATHWAYS Modeling To model future energy demand, EER uses EnergyPATHWAYS (EP), a bottom-up stock accounting model. EP characterizes energy demand, beginning with assumed penetration trajectories for end-use technologies (e.g., heat pump adoption) and using those trajectories to develop the corresponding demand for electricity and various fuels. EP focuses on detailed and explicit accounting of energy system decisions. The model produces demand-side Scenarios that define fuel demand, hourly electricity demand, and flexible load, which can then be mapped to capacity expansion models as shown in Figure 2. SPP FUTURE LOAD SCENARIOS | EVOLVED ENERGY RESEARCH | 7
FIGURE 2 EnergyPATHWAYS Inputs and Outputs Example for Passenger Vehicles *GGE– Gallon of gas equivalent EP simulates a detailed bottom-up representation of all the energy-consuming technologies (e.g., water heaters, air conditioning units, gasoline vehicles, EVs), and how they will change over time. As electrified applications in heat and transportation replace their fuel consuming counterparts, the model estimates how electricity and fuel demands change. EP enables the development of a comprehensive picture of electricity and fuel demands across buildings, transportation, and industry, comprising 65 subsectors of the economy, shown in Figure 3. Energy use by government, sometimes tracked as a separate sector in other SPP work, is contained within the commercial sector as one of the 12 building types. These projections, coupled with designated demand pathways (such as proportions of Full Electrification with air-source heat pumps, hybrid heating systems, or ongoing fossil fuel use), yield insights into the evolving energy needs categorized by fuel types over time. This includes detailed estimations for electricity on an hourly basis and the varying utilization of clean and fossil fuels throughout the projected period. SPP FUTURE LOAD SCENARIOS | EVOLVED ENERGY RESEARCH | 8
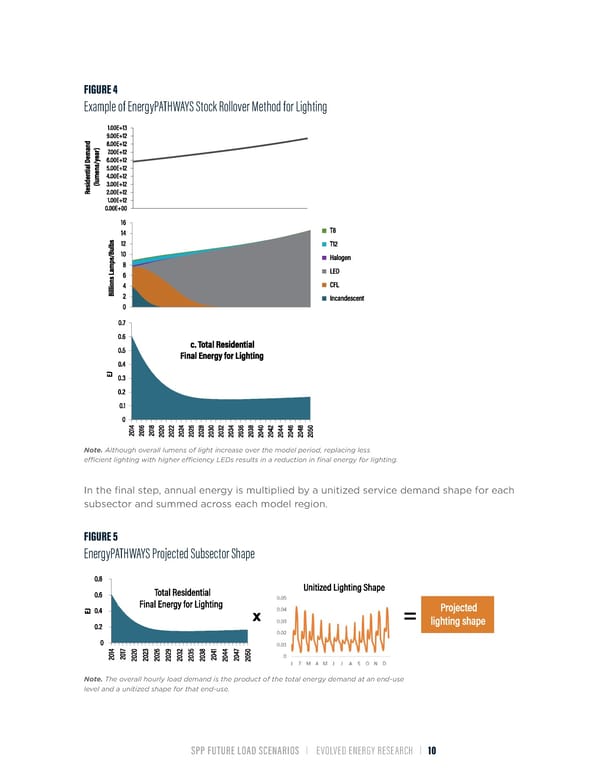
FIGURE 3 EnergyPATHWAYS Economic Subsectors Figure 4 demonstrates the final energy calculations employed in EP using residential lighting as an example subsector. Overall service demand for lighting follows a Scenario growth trajectory. Meanwhile, different bulbs make up the overall lighting stock, and as those bulbs reach the end of their lifetime, they can be replaced with more efÏcient lightbulb technologies. Here, LEDs replace existing stocks of CFLs and incandescent, for example. SPP FUTURE LOAD SCENARIOS | EVOLVED ENERGY RESEARCH | 9
FIGURE 4 Example of EnergyPATHWAYS Stock Rollover Method for Lighting Note. Although overall lumens of light increase over the model period, replacing less efÏcient lighting with higher efÏciency LEDs results in a reduction in final energy for lighting. In the final step, annual energy is multiplied by a unitized service demand shape for each subsector and summed across each model region. FIGURE 5 EnergyPATHWAYS Projected Subsector Shape Note. The overall hourly load demand is the product of the total energy demand at an end-use level and a unitized shape for that end-use. SPP FUTURE LOAD SCENARIOS | EVOLVED ENERGY RESEARCH | 10
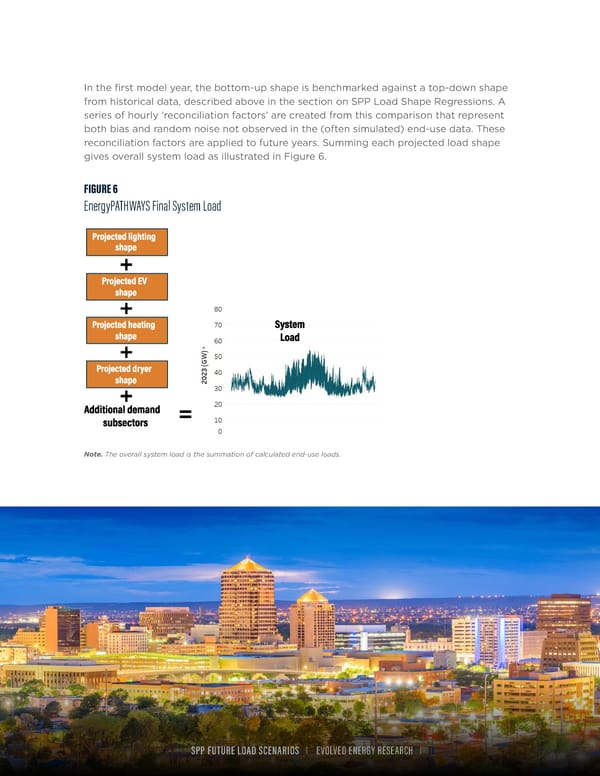
In the first model year, the bottom-up shape is benchmarked against a top-down shape from historical data, described above in the section on SPP Load Shape Regressions. A series of hourly ‘reconciliation factors’ are created from this comparison that represent both bias and random noise not observed in the (often simulated) end-use data. These reconciliation factors are applied to future years. Summing each projected load shape gives overall system load as illustrated in Figure 6. FIGURE 6 EnergyPATHWAYS Final System Load Note. The overall system load is the summation of calculated end-use loads. SPP FUTURE LOAD SCENARIOS | EVOLVED ENERGY RESEARCH | 11
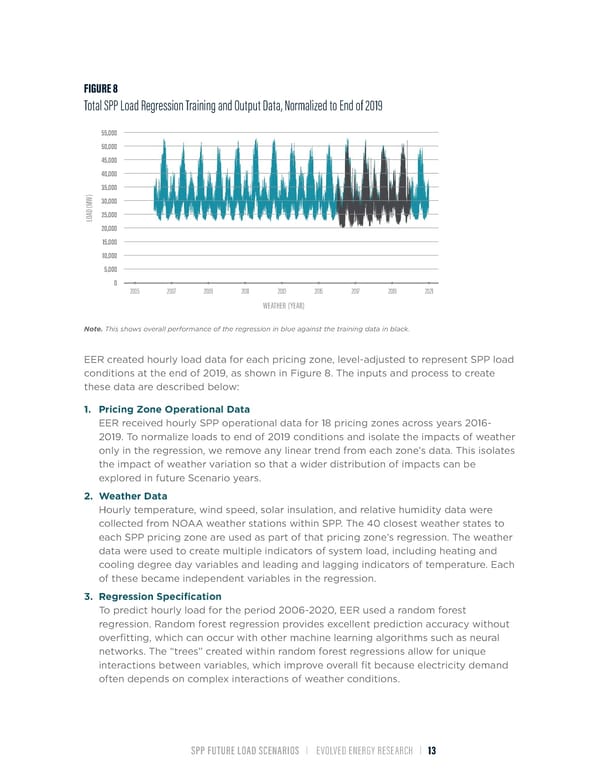
EnergyPATHWAYS: SPP Customization SPATIAL RESOLUTION For this study, SPP provided a shapefile of the pricing zones shown in Figure 7. EER spatially merged this data with county-level geographies (the finest geographic granularity carried in the standard U.S. database) to create input data for EnergyPATHWAYS. This data layer is used to disaggregate any input energy demand on a coarser geography (i.e., state or census division) down to the level of SPP pricing zone. FIGURE 7 SPP Pricing Zone Spatial Geographies LOAD SHAPE REGRESSIONS The other SPP-specific input into the model was a combination of historical and predicted load shapes of SPP pricing zones. While operational data from SPP was available from 2016-2019 (the black line in Figure 8), EER augmented this data to represent a longer period of weather, simulating load shapes using a regression from 2006-2020 for further granularity (the blue line in Figure 8). SPP FUTURE LOAD SCENARIOS | EVOLVED ENERGY RESEARCH | 12
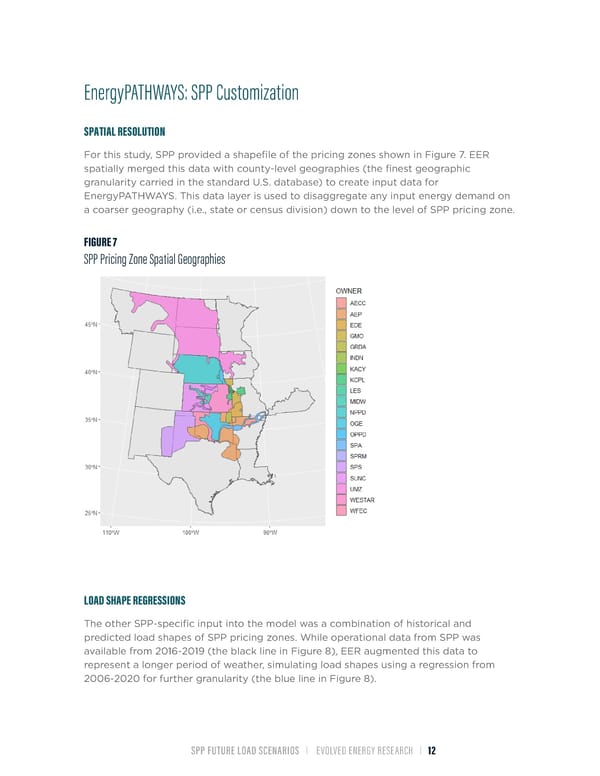
FIGURE 8 Total SPP Load Regression Training and Output Data, Normalized to End of 2019 55,000 50,000 45,000 40,000 35,000 ) W30,000 M ( D A25,000 O L 20,000 15,000 10,000 5,000 0 2005 2007 2009 2011 2013 2015 2017 2019 2021 WEATHER (YEAR) Note. This shows overall performance of the regression in blue against the training data in black. EER created hourly load data for each pricing zone, level-adjusted to represent SPP load conditions at the end of 2019, as shown in Figure 8. The inputs and process to create these data are described below: 1. Pricing Zone Operational Data EER received hourly SPP operational data for 18 pricing zones across years 2016- 2019. To normalize loads to end of 2019 conditions and isolate the impacts of weather only in the regression, we remove any linear trend from each zone’s data. This isolates the impact of weather variation so that a wider distribution of impacts can be explored in future Scenario years. 2. Weather Data Hourly temperature, wind speed, solar insulation, and relative humidity data were collected from NOAA weather stations within SPP. The 40 closest weather states to each SPP pricing zone are used as part of that pricing zone’s regression. The weather data were used to create multiple indicators of system load, including heating and cooling degree day variables and leading and lagging indicators of temperature. Each of these became independent variables in the regression. 3. Regression Specification To predict hourly load for the period 2006-2020, EER used a random forest regression. Random forest regression provides excellent prediction accuracy without overfitting, which can occur with other machine learning algorithms such as neural networks. The “trees” created within random forest regressions allow for unique interactions between variables, which improve overall fit because electricity demand often depends on complex interactions of weather conditions. SPP FUTURE LOAD SCENARIOS | EVOLVED ENERGY RESEARCH | 13
Each tree in the random forest is then trained on 2/3 of the available data. This allows for an out-of-bag prediction to be made using the 1/3 of data that was not used in the training of each tree. This “cross-validation” increases confidence on predictions made in other weather years. The model was trained using 500 estimators, and independent variables included weather data (mentioned above), as well as month, hour, day-of-week, and holiday indicator variables that remove variation unrelated to weather. The final regression performed within predicted parameters, both within and outside the training sample, as shown in Table 2. TABLE 2 Random Forest Regression Fit Regression Zone Training data R2 Out-of-bag R2 CSWS 0.998 0.982 EDE 0.997 0.978 GRDA 0.993 0.951 GRDAN1 0.96 0.708 INDN 0.997 0.981 KACY 0.996 0.972 KCPL 0.997 0.981 LES 0.997 0.98 MPS 0.997 0.978 NPPD 0.997 0.977 OKGE 0.998 0.983 OPPD 0.997 0.98 SECI 0.995 0.962 SPAMKT 0.996 0.971 SPRM 0.998 0.982 SPS 0.997 0.981 WAUE 0.997 0.977 WFEC 0.997 0.976 WR 0.997 0.982 SPP FUTURE LOAD SCENARIOS | EVOLVED ENERGY RESEARCH | 14
2 Prediction within sample, measure by R was over 0.99 for all SPP zones except GRDAN1 (0.960), meaning the model fits the training data with extremely high accuracy. Testing on the 1/3 sample set that is held out of the training provides additional confidence 2 in the prediction additional years. This out-of-bag R is also very high and consistent, above 0.95 for all zones except GRDAN1. The GRDAN1 pricing zone is small relative to all other zones and had significant variation between years in the training data unrelated to weather, which decreased the performance of the regression. However, because of the size of the zone relative to the rest of SPP, this was not a major concern for the study. OPPORTUNISTIC LOADS Scenario electricity growth from EnergyPATHWAYS provides separate projections for data centers and hydrogen electrolysis. These loads are given special attention because of their potential magnitude and a step-change in expected growth in the past several years. Projections for both have significant long-term uncertainties, and the proportion of this growth that will occur within SPP is even more uncertain. Both data centers and electrolysis have a need for clean electricity due to corporate commitments and tax credit restrictions, respectively. We refer to these as opportunistic loads because they are economically opportunistic with regards to their location based on electricity prices and available supply. This makes SPP a relatively attractive place for these loads to relocate from a cost of energy perspective, since SPP has some of the best wind resources in the world. On the other hand, siting difÏculties, water availability, transmission constraints, and labor force availability may slow down the deployment of these loads. Data Centers Data centers consumed an estimated 250 TWh in 2024 across the U.S., and the median forecast is that this load will triple by 2030, based on the sources in Table 3. The recent boom in AI is the primary reason cited for the expected data center growth. Large Language Models (LLMs) take an extraordinary amount of computation, both in their training and in their use. Between these, EER estimates the ratio of electricity consumption between training and using LLM requests to be 5:1. This is significant because training LLMs have far lower latency requirements potentially allowing far more flexibility when it comes to siting these loads. Today, major data center hot spots exist in Virgina, Texas, and the Northwest. The development of data centers in these locations was historically driven by their proximity to major population centers, cheap real estate, available workforce, and, secondarily, low-cost electricity. However, if new potential data center loads including LLM training and cryptocurrency mining do not need to be located near population centers, it increases the possibility that SPP could see a disproportionate share of future data- center load growth. While we reflect a single estimate for use in this Scenario analysis, the long-term uncertainty on such a point estimate is large. SPP FUTURE LOAD SCENARIOS | EVOLVED ENERGY RESEARCH | 15
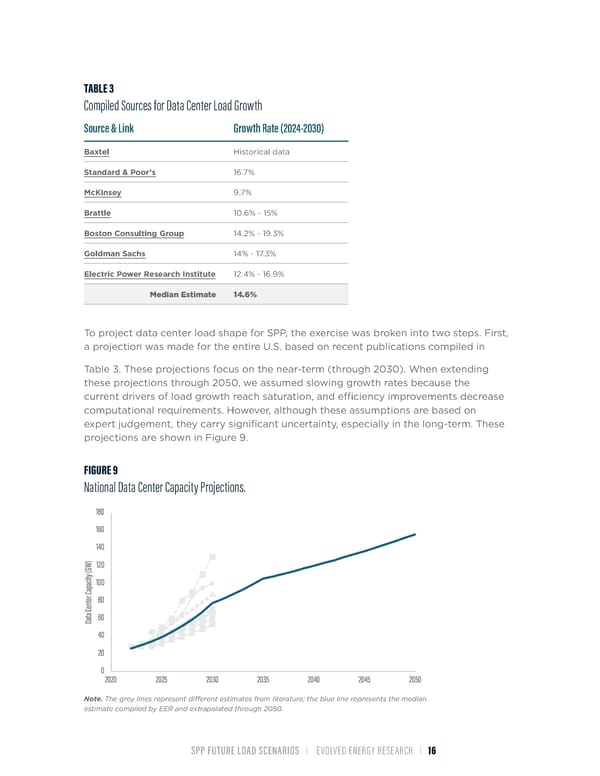
TABLE 3 Compiled Sources for Data Center Load Growth Source & Link Growth Rate (2024-2030) Baxtel Historical data Standard & Poor’s 16.7% McKinsey 9.7% Brattle 10.6% - 15% Boston Consulting Group 14.2% - 19.3% Goldman Sachs 14% - 17.3% Electric Power Research Institute 12.4% - 16.9% Median Estimate 14.6% To project data center load shape for SPP, the exercise was broken into two steps. First, a projection was made for the entire U.S. based on recent publications compiled in Table 3. These projections focus on the near-term (through 2030). When extending these projections through 2050, we assumed slowing growth rates because the current drivers of load growth reach saturation, and efÏciency improvements decrease computational requirements. However, although these assumptions are based on expert judgement, they carry significant uncertainty, especially in the long-term. These projections are shown in Figure 9. FIGURE 9 National Data Center Capacity Projections. Note. The grey lines represent different estimates from literature; the blue line represents the median estimate compiled by EER and extrapolated through 2050. SPP FUTURE LOAD SCENARIOS | EVOLVED ENERGY RESEARCH | 16
The second step in projecting data center load was to estimate what proportion of this load could be located in different parts of SPP. Currently available information suggests that planned data centers have similar spatial distributions to existing data centers. For instance, based on information from Baxtel, we estimate that 6.7% of current U.S. data center load to be located within SPP, shown in Figure 10. Based on planned locations shown in Figure 11, we anticipate 7.3% of data center load to be located within SPP a decade from now. This does not reflect a significant deviation from historical, at least in the near future, but reflects the near-term rush to build data centers and the ease of doing so near existing supply chains and labor force. We keep this 7.3% allocation all the way through 2050 but caveat the results by noting that SPP could attract a larger share in the future based on relative energy prices. The resulting loads for SPP are shown in the results section. FIGURE 10 Current Data Centers within SPP SPP FUTURE LOAD SCENARIOS | EVOLVED ENERGY RESEARCH | 17
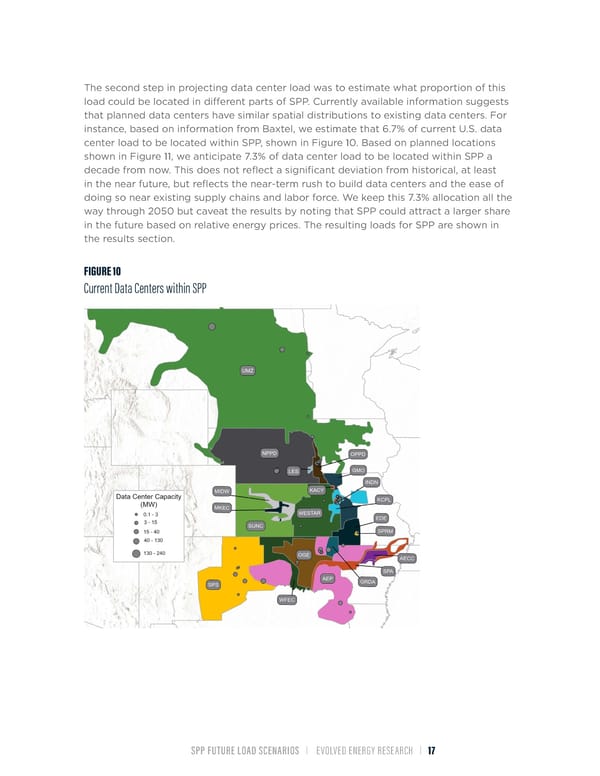
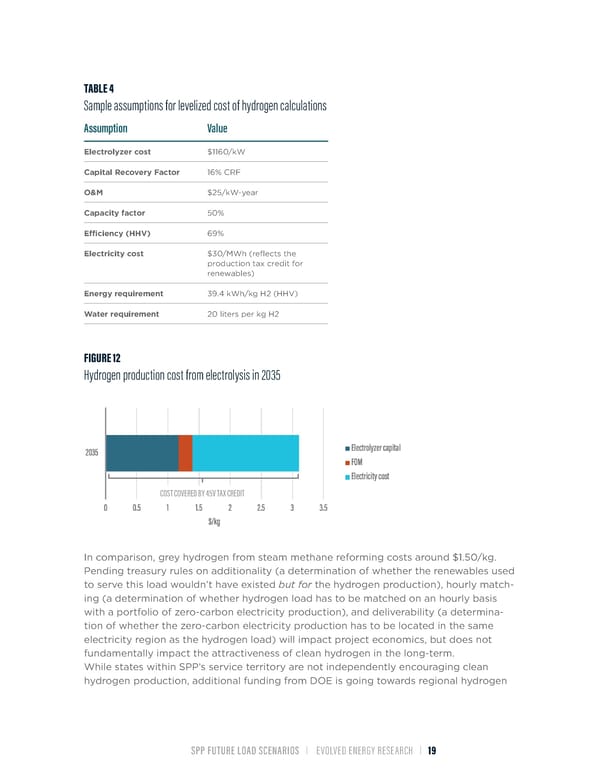
FIGURE 11 Near-Term Data Center Growth HYDROGEN ELECTROLYSIS Hydrogen electrolyzers consume electricity to split water molecules into hydrogen and oxygen. The efÏciency of this process is between 60-70%, depending on technology assumptions. Today, around 10 million metric tons (MMT) of hydrogen are made in the U.S., almost entirely by steam methane reforming, and used primarily in refining and ammonia production. Generating this 10 MMT of hydrogen with electrolyzers would require 550 TWh of electricity, which would represent a very significant electricity load and is emblematic of the difference in scale between the fuel and electric sectors of the economy. In recent years, hydrogen has received increasing attention as an energy carrier in low-carbon energy systems because its combustion does not release CO2. It also has a much higher specific energy than batteries, and it can be used as a feedstock to create other fuels or within industrial processes such as the reduction of iron when making steel. To incentivize the development of a low-carbon hydrogen industry within the U.S., the 2022 IRA included the 45V tax credits to produce clean hydrogen. These tax credits, amounting to $3/kg over the first ten years of a facility’s operation, are quite generous, and, under reasonable assumptions (Table 4), it should be possible to produce hydrogen at very low cost when posited against the incentive value as shown in Table 4. SPP FUTURE LOAD SCENARIOS | EVOLVED ENERGY RESEARCH | 18
TABLE 4 Sample assumptions for levelized cost of hydrogen calculations Assumption Value Electrolyzer cost $1160/kW Capital Recovery Factor 16% CRF O&M $25/kW-year Capacity factor 50% EfÏciency (HHV) 69% Electricity cost $30/MWh (reflects the production tax credit for renewables) Energy requirement 39.4 kWh/kg H2 (HHV) Water requirement 20 liters per kg H2 FIGURE 12 Hydrogen production cost from electrolysis in 2035 COST COVERED BY 45V TAX CREDIT In comparison, grey hydrogen from steam methane reforming costs around $1.50/kg. Pending treasury rules on additionality (a determination of whether the renewables used to serve this load wouldn’t have existed but for the hydrogen production), hourly match- ing (a determination of whether hydrogen load has to be matched on an hourly basis with a portfolio of zero-carbon electricity production), and deliverability (a determina- tion of whether the zero-carbon electricity production has to be located in the same electricity region as the hydrogen load) will impact project economics, but does not fundamentally impact the attractiveness of clean hydrogen in the long-term. While states within SPP’s service territory are not independently encouraging clean hydrogen production, additional funding from DOE is going towards regional hydrogen SPP FUTURE LOAD SCENARIOS | EVOLVED ENERGY RESEARCH | 19
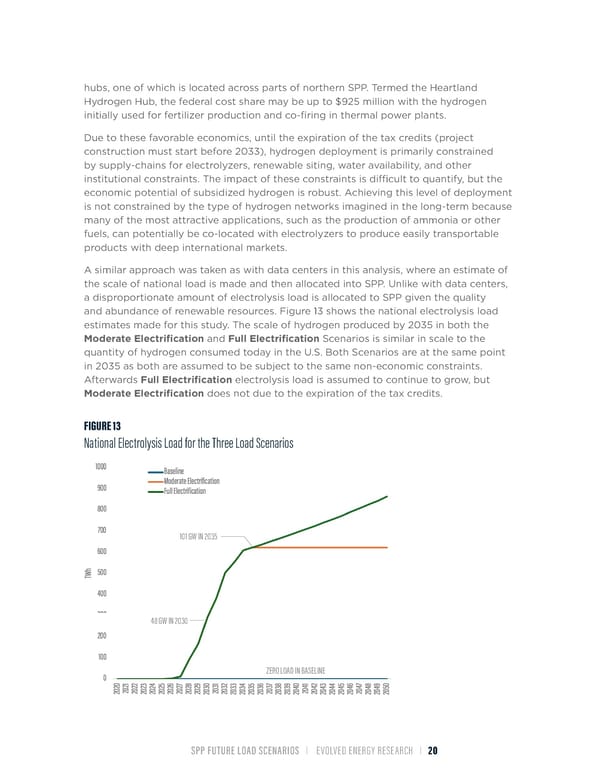
hubs, one of which is located across parts of northern SPP. Termed the Heartland Hydrogen Hub, the federal cost share may be up to $925 million with the hydrogen initially used for fertilizer production and co-firing in thermal power plants. Due to these favorable economics, until the expiration of the tax credits (project construction must start before 2033), hydrogen deployment is primarily constrained by supply-chains for electrolyzers, renewable siting, water availability, and other institutional constraints. The impact of these constraints is difÏcult to quantify, but the economic potential of subsidized hydrogen is robust. Achieving this level of deployment is not constrained by the type of hydrogen networks imagined in the long-term because many of the most attractive applications, such as the production of ammonia or other fuels, can potentially be co-located with electrolyzers to produce easily transportable products with deep international markets. A similar approach was taken as with data centers in this analysis, where an estimate of the scale of national load is made and then allocated into SPP. Unlike with data centers, a disproportionate amount of electrolysis load is allocated to SPP given the quality and abundance of renewable resources. Figure 13 shows the national electrolysis load estimates made for this study. The scale of hydrogen produced by 2035 in both the Moderate Electrification and Full Electrification Scenarios is similar in scale to the quantity of hydrogen consumed today in the U.S. Both Scenarios are at the same point in 2035 as both are assumed to be subject to the same non-economic constraints. Afterwards Full Electrification electrolysis load is assumed to continue to grow, but Moderate Electrification does not due to the expiration of the tax credits. FIGURE 13 National Electrolysis Load for the Three Load Scenarios 101 GW IN 2035 48 GW IN 2030 ZERO LOAD IN BASELINE SPP FUTURE LOAD SCENARIOS | EVOLVED ENERGY RESEARCH | 20
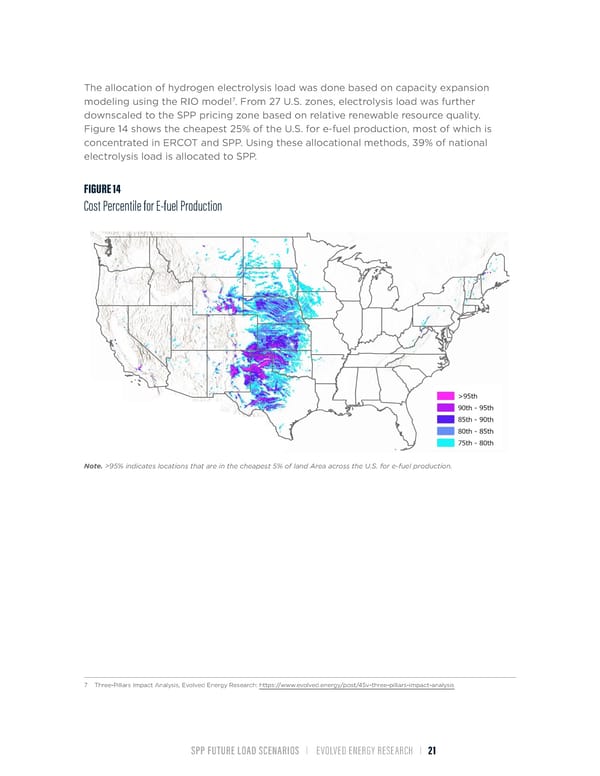
The allocation of hydrogen electrolysis load was done based on capacity expansion 7 modeling using the RIO model . From 27 U.S. zones, electrolysis load was further downscaled to the SPP pricing zone based on relative renewable resource quality. Figure 14 shows the cheapest 25% of the U.S. for e-fuel production, most of which is concentrated in ERCOT and SPP. Using these allocational methods, 39% of national electrolysis load is allocated to SPP. FIGURE 14 Cost Percentile for E-fuel Production Note. >95% indicates locations that are in the cheapest 5% of land Area across the U.S. for e-fuel production. 7 Three-Pillars Impact Analysis, Evolved Energy Research: https://www.evolved.energy/post/45v-three-pillars-impact-analysis SPP FUTURE LOAD SCENARIOS | EVOLVED ENERGY RESEARCH | 21
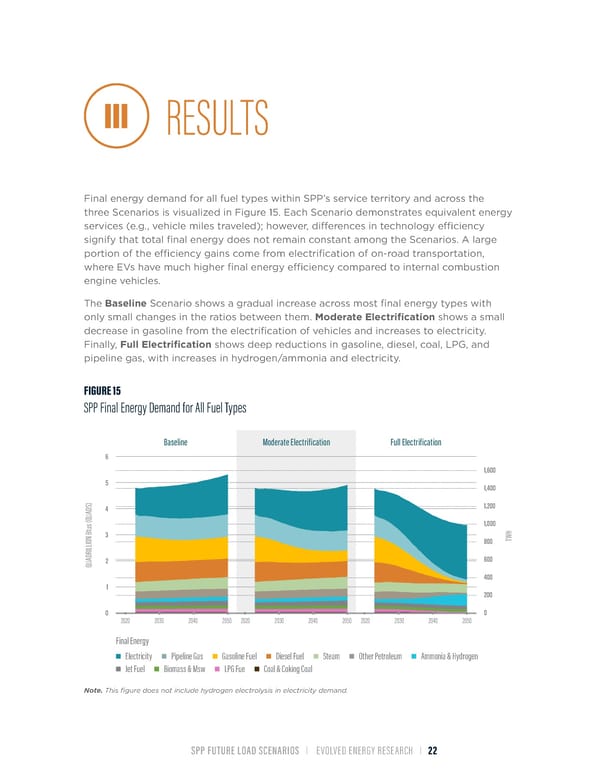
III RESULTS Final energy demand for all fuel types within SPP’s service territory and across the three Scenarios is visualized in Figure 15. Each Scenario demonstrates equivalent energy services (e.g., vehicle miles traveled); however, differences in technology efÏciency signify that total final energy does not remain constant among the Scenarios. A large portion of the efÏciency gains come from electrification of on-road transportation, where EVs have much higher final energy efÏciency compared to internal combustion engine vehicles. The Baseline Scenario shows a gradual increase across most final energy types with only small changes in the ratios between them. Moderate Electrification shows a small decrease in gasoline from the electrification of vehicles and increases to electricity. Finally, Full Electrification shows deep reductions in gasoline, diesel, coal, LPG, and pipeline gas, with increases in hydrogen/ammonia and electricity. FIGURE 15 SPP Final Energy Demand for All Fuel Types Baseline Moderate Electrification Full Electrification 6 1,600 5 1,400 ) S 1,200 D 4 A U Q ( 1,000 us t B 3 WH N 800 T IO L L I DR A 2 600 QU 400 1 200 0 0 2020 2030 2040 2050 2020 2030 2040 2050 2020 2030 2040 2050 Final Energy Electricity Pipeline Gas Gasoline Fuel Diesel Fuel Steam Other Petroleum Ammonia & Hydrogen Jet Fuel Biomass & Msw LPG Fue Coal & Coking Coal Note. This figure does not include hydrogen electrolysis in electricity demand. SPP FUTURE LOAD SCENARIOS | EVOLVED ENERGY RESEARCH | 22
Focusing just on SPP electricity demand, Figure 16 breaks down consumption by sector with data centers and electrolysis shown separately. Data centers represent a large increase in load across the Scenarios; however, transportation also consumes significant electricity, particularly in the Full Electrification Scenario. These electricity demands do not include transmission and distribution (T&D) losses. FIGURE 16 SPP Electricity Demand by Sector Baseline Moderate Electrification Full Electrification 1,000 900 800 700 600 h 500 TW 400 300 200 100 0 2000 2025 2030 2035 2040 2045 2050 2000 2025 2030 2035 2040 2045 2050 2000 2025 2030 2035 2040 2045 2050 Sector Electrolysis Transportation Data Center Industry Commercial Residential Figure 17 breaks down the same annual electricity demand by subsectors of highest importance for load growth. In the Moderate and Full Electrification Scenarios, electrolysis makes up around one third of electricity demand. However, unlike with conventional loads, co-location with renewable resources is an incentivized outcome. As noted elsewhere, the hydrogen outcome is because SPP is an attractive place for hydrogen to locate due to abundant wind resources. Vehicles are shown next down and have the highest absolute load growth after hydrogen. Space and water heating exhibits growth in the Full Electrification Scenario, but the growth is less dramatic on an annual energy basis than when examining key winter hours after building electrification. Finally, industrial electrification is seen at the bottom of the figure in the Full Electrification Scenario, including electrification of oil and gas production. Electricity consumption from oil and gas increases in the medium term after electrification but decreases in the long term as the demand for petroleum products is reduced after high rates of electrification. SPP FUTURE LOAD SCENARIOS | EVOLVED ENERGY RESEARCH | 23
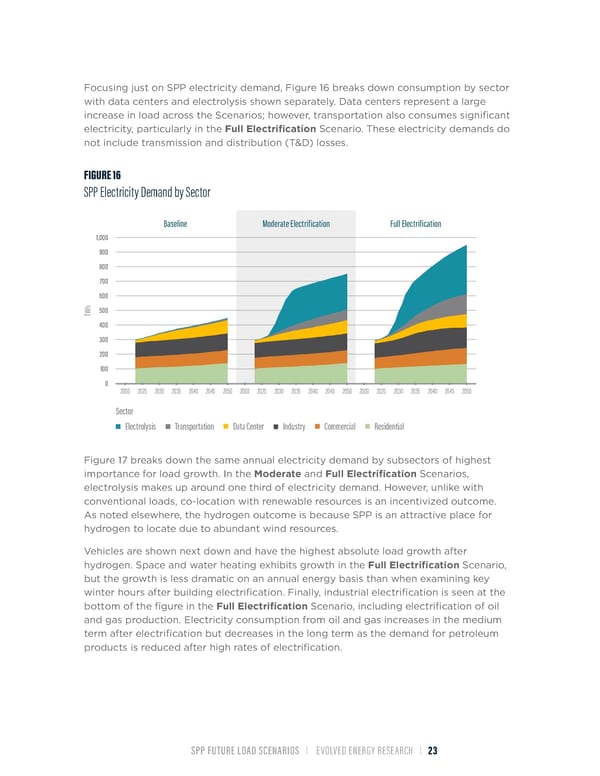
FIGURE 17 SPP Electricity Demand by Key Subsector Baseline Moderate Electrification Full Electrification 1,000 900 800 700 600 h 500 TW 400 300 200 100 0 2000 2025 2030 2035 2040 2045 2050 2000 2025 2030 2035 2040 2045 2050 2000 2025 2030 2035 2040 2045 2050 Subsector Electrolysis Light Duty Vehicles Medium & Heavy-Duty Trucks Space & Water Heating Data Center Bulk Chemicals Oil & Gas Mining Agriculture Other Loads The on-road vehicle stocks within SPP’s service territory that result in the demonstrated increases in electricity consumption are shown in Figure 18. Within SPP’s service territory, 32% of vehicle stock is electrified by 2050, but 50% of vehicle stock nationally based on the state-differentiated adoption rates. Higher rates of electrification of medium-duty vehicles are the result of better economics for high mileage vehicles and predictable duty cycles that create a compelling case for electrification. SPP FUTURE LOAD SCENARIOS | EVOLVED ENERGY RESEARCH | 24
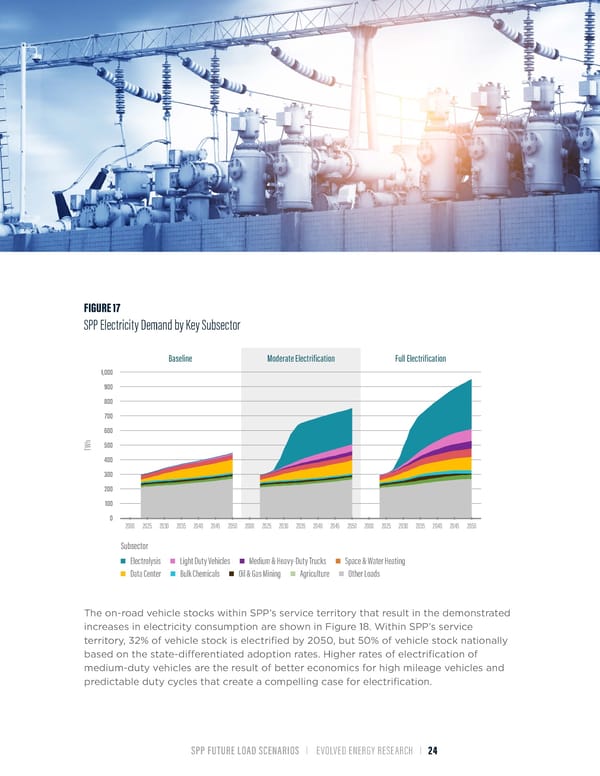
FIGURE 18 SPP Service Territory Vehicle Stocks Baseline Moderate Electrification Full Electrification 1,500K S S & K K C C U 1,000K U R R Y T Y T T T U U M D Y D IU 500K V D A HE ME 0K 2020 2030 2040 2050 2020 2030 2040 2050 2020 2030 2040 2050 20M S E L C 15M HI E Y V T 10M U T D H G I L 5M 0M 2020 2030 2040 2050 2020 2030 2040 2050 2020 2030 2040 2050 Demand Technology Battery Electric Hydrogen Fuel Cell Combustion Engines Examining SPP electricity load on an hourly basis, Figure 19 shows the Moderate Electrification Scenario across the full range of simulated historical weather conditions for the Scenario years 2023 (historical), 2034, and 2050. The Full Electrification Scenario is shown in Figure 20. Transportation loads are shown separately from buildings and industry because vehicle charging loads have a high degree of flexibility; thus, their hourly shape is best studied in conjunction with supply-side resources and T&D constraints on the system. The transportation loads produced here have not been moderated with flexible charging which should be introduced when using these shapes in planning studies. SPP FUTURE LOAD SCENARIOS | EVOLVED ENERGY RESEARCH | 25
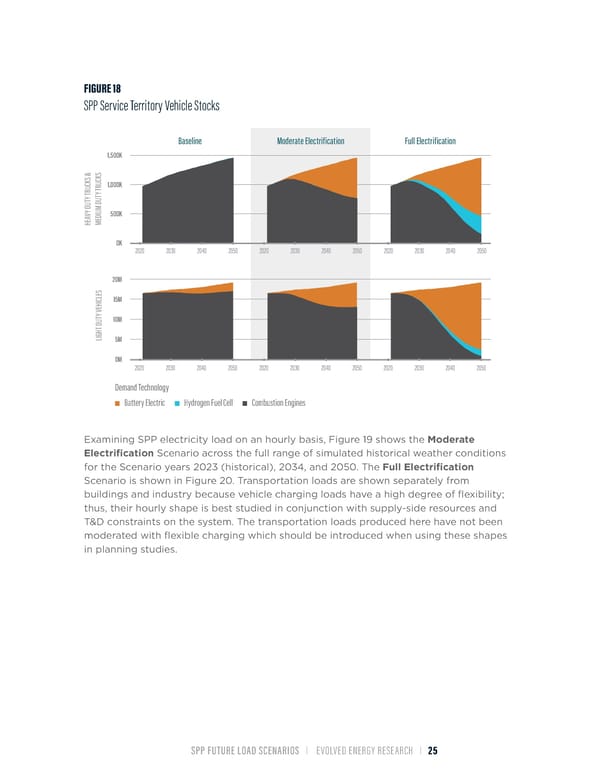
FIGURE 19 Moderate Electrification Scenario Hourly Electricity Demand (Excludes Hydrogen Electrolysis) 90 80 70 ) 60 GW ( 50 3 40 202 30 20 10 0 2005 2006 2007 2008 2009 2010 2011 2012 2013 2014 2015 2016 2017 2018 2019 2020 2021 90 80 70 ) 60 GW ( 50 4 40 203 30 20 10 0 2005 2006 2007 2008 2009 2010 2011 2012 2013 2014 2015 2016 2017 2018 2019 2020 2021 90 80 70 ) 60 GW ( 50 050 40 2 30 20 10 0 2005 2006 2007 2008 2009 2010 2011 2012 2013 2014 2015 2016 2017 2018 2019 2020 2021 Subsector WEATHER (YEAR) Building & Productive Transportation SPP FUTURE LOAD SCENARIOS | EVOLVED ENERGY RESEARCH | 26
FIGURE 20 Full Electrification Scenario hourly electricity demand (excludes hydrogen electrolysis) 90 80 70 ) 60 GW ( 50 3 40 202 30 20 10 0 2005 2006 2007 2008 2009 2010 2011 2012 2013 2014 2015 2016 2017 2018 2019 2020 2021 90 80 70 ) 60 GW ( 50 4 40 203 30 20 10 0 2005 2006 2007 2008 2009 2010 2011 2012 2013 2014 2015 2016 2017 2018 2019 2020 2021 90 80 70 ) 60 GW ( 50 050 40 2 30 20 10 0 2005 2006 2007 2008 2009 2010 2011 2012 2013 2014 2015 2016 2017 2018 2019 2020 2021 Subsector WEATHER (YEAR) Building & Productive Transportation The Full Electrification Scenario and resulting building electrification results in SPP becoming a winter-peaking system by 2050. By 2034 the system is dual peaking with similar summer and winter peaks, depending on the weather conditions each year. The magnitude of winter peaks after electrification is highly sensitive to assumptions made in EnergyPATHWAYS regarding heat and cold weather performance, cut-out temperatures and back-up fuel types, and other efÏciency measures, e.g., building shell improvements, which might be applied in parallel. This work assumes high efÏciency cold weather heat pumps are sold and that such systems switch to electric resistance heating once -13 degrees Fahrenheit is reached. This matches the highest performance systems sold in the U.S. today8 8 Example system: https://www.mitsubishicomfort.com/articles/mythbusters-heat-pumps-for-extreme-cold-climates SPP FUTURE LOAD SCENARIOS | EVOLVED ENERGY RESEARCH | 27
The impact of building heating electrification on SPP load shapes is highly dependent on location within SPP and the coldest temperatures regularly encountered. Figure 21 illustrates this point for the Full Electrification Scenario using pricing zones in the northern (UMZ), central (NPPDALL), and southern (SWPSALL) regions of SPP. Northern climes within SPP become highly winter peaking; central regions within SPP exhibit a dual peak; and southern SPP remains summer peaking. FIGURE 21 Hourly Loads North / South Comparison Full Electrification Scenario (Excludes Hydrogen Electrolysis) A summary of all loads studied in this work is provided in Table 5. This table makes clear the possibility of load growth, both conventional and unconventional, within SPP’s service territory that will have material impacts on the need for new infrastructure. SPP FUTURE LOAD SCENARIOS | EVOLVED ENERGY RESEARCH | 28
TABLE 5 SPP Electricity Load Metrics across Scenarios Electrification Annual Demand (TWh) Non-Coincident Peak (GW) Scenario Subsector 2023 2034 2050 2023 2034 2050 Baseline Buildings & Industry 279 301 344 51 58 70 Data Centers 17 62 98 2 8 12 Electrolysis H2 0 0 0 Transportation 1 6 12 0 1 3 Moderate Buildings & Industry 277 301 343 51 57 67 Data Centers 17 62 98 2 8 12 Electrolysis H2 0 235 241 Transportation 2 37 73 0 8 16 Full Buildings & Industry 275 337 384 50 61 71 Data Centers 17 62 98 2 8 12 Electrolysis H2 0 235 334 Transportation 2 52 138 0 12 30 SPP FUTURE LOAD SCENARIOS | EVOLVED ENERGY RESEARCH | 29
IV DISCUSSION & CONCLUSIONS The analysis above offers valuable insights into the future energy dynamics within SPP’s service territory, highlighting how electrification trends will reshape energy demand. The three electrification Scenarios — Baseline, Moderate Electrification, and Full Electrification — demonstrate that, as electrification accelerates, the grid must be capable of adapting to significant changes in load patterns, particularly from EVs, heating technologies, and unconventional energy consumers like data centers and hydrogen electrolysis. The results demonstrate that the transition toward electrification will impose new pressures on SPP’s infrastructure. Transportation electrification stands out as a key driver of increased energy consumption with reasonably high confidence. As more vehicles away from traditional fuels, the need for expanded transmission and generation capacity could increases substantially. Additionally, building electrification, especially the shift to electric heating, will alter seasonal demand patterns, resulting in higher winter peaks. This shift will require SPP to rethink how it manages both its generation resources and grid reliability, as the demand fluctuations between summer and winter become more pronounced. A major challenge identified in the analysis is the uncertainty surrounding unconventional loads like data centers and hydrogen electrolysis. While these sectors present substantial opportunities for growth, their unpredictable nature complicates long-term planning. Data center demand, driven by AI and other computationally demanding tasks, could place significant stress on SPP’s power system. Hydrogen electrolysis, while promising from SPP FUTURE LOAD SCENARIOS | EVOLVED ENERGY RESEARCH | 30
a low-carbon energy perspective, introduces competition for prime renewable resources, adding another layer of complexity to SPP’s energy future. Given the findings of the study, it is clear that SPP will face a range of new challenges and opportunities as electrification intensifies. These challenges will require forward- thinking strategies to ensure grid reliability and the efÏcient integration of renewable energy resources. Key takeaways include: ƒ Impact of Electric Vehicles: • EV adoption will create significant new loads which may drive demand for new generation and transmission infrastructure. • Grid operators will need to plan for flexible demand-side management and infrastructure upgrades to handle the increased load. ƒ Shifting Seasonal Peaks: • Electrification of heating technologies will lead to higher peaks in both summer and winter, with northern regions likely becoming winter-peaking systems. • SPP must prepare for dual-peaking conditions, especially as building heating demand increases during cold weather events. ƒ Unconventional Loads (Data Centers & Hydrogen Electrolysis): • Data centers, driven by AI and computational demand, will create substantial new electricity consumption, adding strain to grid resources. • Hydrogen electrolysis has the potential to consume large amounts of electricity and compete for renewable resources, particularly wind energy, further complicating energy planning. • SPP is an attractive place to locate both of these loads due to excellent wind resources relative to other parts of the U.S., but uncertainty on these loads remains high. ƒ Infrastructure and Grid Management: • Moderate and Full Electrification Scenarios underscore the need for robust infrastructure investments in both transmission and generation to meet future energy demands. • Uncertainty around the timing and magnitude of unconventional loads necessitates adaptive planning, flexible grid operations, and the efÏcient use of renewable resources. Overall, the study highlights the importance of aligning SPP’s long-term energy planning processes, including considerations for Resource Adequacy, Transmission Planning, Market Development and Operation Planning, with the rapid adoption of electrified technologies to ensure a stable, efÏcient, and low-carbon energy system. SPP FUTURE LOAD SCENARIOS | EVOLVED ENERGY RESEARCH | 31
V APPENDIX EnergyPATHWAYS EnergyPATHWAYS and its progenitor PATHWAYS have been used since 2014 to analyze energy system transformation starting in California (California ARB) before expanding to U.S. wide analysis (e.g, 2014 U.S. DDPP, Risky Business, NREL Electrification Futures Study, Princeton Net Zero America and REPEAT, and many others) and additional state and regional work (most states and regions in the US including state energy plans for New Jersey, Washington State, and Massachusetts). The model has also been used internationally in Mexico, Canada, Europe, and Australia. In each context, it has excelled by elucidating changes in the energy system at a level granular enough to be recognizable by policy implementers looking at sectoral and sub-sectoral impacts. EnergyPATHWAYS is a bottom-up stock-rollover model of all energy-using technologies in the economy, employed to represent how energy is used today and in the future. It performs a full accounting of all energy demands in the economy, including feedstocks, and can be used to represent both current fossil-based energy systems and transformed, low-carbon energy systems. With over 380 demand-side technologies the model is able to explore myriad dimensions of a low carbon energy transition. Inputs to determining final energy demand include: 1. Demand drivers the characteristics of the energy economy that determine how people consume energy and in what quantity over time. Examples include population, square footage of commercial building types, and vehicle miles traveled. Demand drivers are the basis for forecasting future demand for energy services. 2. Service demand energy is not consumed for its own sake but to accomplish a service, such as heating homes, moving vehicles, and manufacturing goods. 3. Technology efÏciency how efÏciently technologies convert fuel or electricity into energy services; for example, how fuel-efÏcient a vehicle is in converting gallons of gasoline into miles traveled. 4. Technology stock what quantity of each type of technology is present in the population and how SPP FUTURE LOAD SCENARIOS | EVOLVED ENERGY RESEARCH | 32
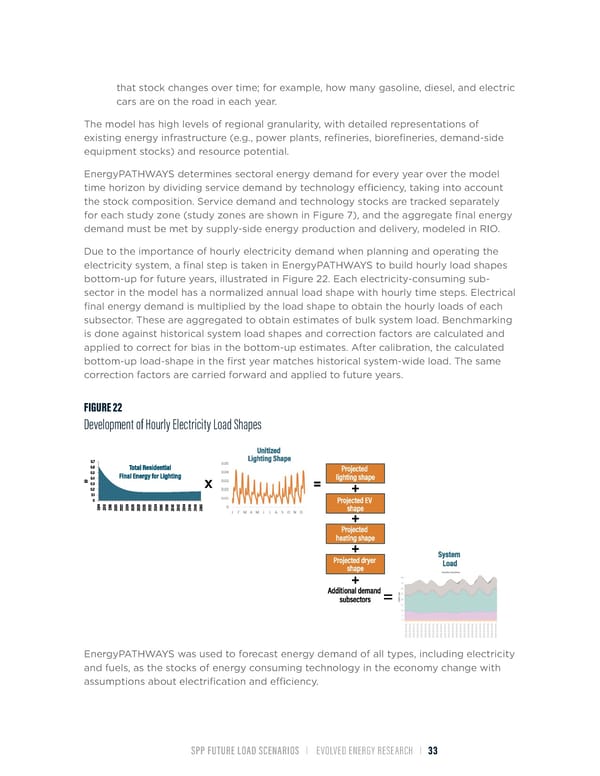
that stock changes over time; for example, how many gasoline, diesel, and electric cars are on the road in each year. The model has high levels of regional granularity, with detailed representations of existing energy infrastructure (e.g., power plants, refineries, biorefineries, demand-side equipment stocks) and resource potential. EnergyPATHWAYS determines sectoral energy demand for every year over the model time horizon by dividing service demand by technology efÏciency, taking into account the stock composition. Service demand and technology stocks are tracked separately for each study zone (study zones are shown in Figure 7), and the aggregate final energy demand must be met by supply-side energy production and delivery, modeled in RIO. Due to the importance of hourly electricity demand when planning and operating the electricity system, a final step is taken in EnergyPATHWAYS to build hourly load shapes bottom-up for future years, illustrated in Figure 22. Each electricity-consuming sub- sector in the model has a normalized annual load shape with hourly time steps. Electrical final energy demand is multiplied by the load shape to obtain the hourly loads of each subsector. These are aggregated to obtain estimates of bulk system load. Benchmarking is done against historical system load shapes and correction factors are calculated and applied to correct for bias in the bottom-up estimates. After calibration, the calculated bottom-up load-shape in the first year matches historical system-wide load. The same correction factors are carried forward and applied to future years. FIGURE 22 Development of Hourly Electricity Load Shapes EnergyPATHWAYS was used to forecast energy demand of all types, including electricity and fuels, as the stocks of energy consuming technology in the economy change with assumptions about electrification and efÏciency. SPP FUTURE LOAD SCENARIOS | EVOLVED ENERGY RESEARCH | 33
TABLE 6 EnergyPATHWAYS Subsector Load Shape Sources TABLE 7 Technology Stock Share Model Outputs by Scenario and Technology Group Baseline Moderate Full Subsector Tech Group 2023 2030 2040 2050 2023 2030 2040 2050 2023 2030 2040 2050 commercial air Reference 98% 98% 98% 98% 97% 88% 74% 68% 97% 78% 37% 18% conditioning commercial air High 2% 2% 2% 2% 3% 12% 27% 32% 3% 22% 63% 82% conditioning EfÏciency commercial Reference 62% 62% 62% 62% 62% 62% 62% 62% 62% 55% 14% 3% cooking commercial Electric 38% 38% 38% 38% 38% 38% 38% 38% 38% 46% 86% 97% cooking commercial Reference 23% 21% 22% 29% 23% 21% 22% 29% 17% 1% 0% 0% lighting commercial High 77% 79% 78% 72% 77% 79% 78% 72% 83% 99% 100% 100% lighting EfÏciency commercial Reference 100% 100% 100% 100% 100% 100% 100% 100% 100% 77% 13% 0% refrigeration commercial High 0% 0% 0% 0% 0% 0% 0% 0% 0% 23% 87% 100% refrigeration EfÏciency commercial Reference 83% 83% 83% 83% 82% 69% 51% 47% 81% 62% 21% 6% space heating commercial High 3% 3% 3% 3% 3% 3% 3% 3% 3% 3% 1% 0% space heating EfÏciency SPP FUTURE LOAD SCENARIOS | EVOLVED ENERGY RESEARCH | 34
Baseline Moderate Full Subsector Tech Group 2023 2030 2040 2050 2023 2030 2040 2050 2023 2030 2040 2050 commercial Electric 14% 14% 14% 14% 15% 27% 46% 50% 16% 35% 78% 94% space heating commercial Reference 100% 100% 100% 100% 100% 92% 77% 68% 99% 81% 37% 6% ventilation commercial High 0% 0% 0% 0% 0% 8% 23% 32% 1% 19% 64% 95% ventilation EfÏciency commercial Reference 52% 51% 55% 55% 52% 51% 55% 55% 52% 47% 17% 1% water heating commercial High 42% 43% 38% 38% 42% 43% 38% 38% 41% 38% 11% 1% water heating EfÏciency commercial Electric 6% 6% 6% 6% 6% 6% 6% 6% 6% 16% 72% 99% water heating residential air Reference 99% 99% 99% 98% 99% 92% 82% 81% 99% 82% 61% 65% conditioning residential air High 1% 1% 1% 2% 1% 8% 18% 19% 1% 18% 39% 35% conditioning EfÏciency residential Reference 100% 100% 100% 100% 99% 94% 86% 79% 99% 92% 71% 52% building shell residential High 1% 7% 14% 21% 1% 8% 29% 48% building shell EfÏciency residential Reference 12% 12% 12% 13% 12% 12% 12% 13% 12% 9% 2% 0% clothes drying residential Electric 89% 88% 88% 87% 89% 88% 88% 87% 89% 91% 98% 100% clothes drying residential clothes Reference 100% 100% 100% 100% 100% 100% 100% 100% 100% 82% 18% 0% washing residential High clothes EfÏciency 0% 19% 82% 100% washing residential Reference 30% 31% 33% 34% 30% 31% 33% 34% 30% 28% 14% 1% cooking residential Electric 70% 69% 67% 66% 70% 69% 67% 66% 70% 72% 86% 99% cooking residential Reference 100% 100% 100% 100% 100% 100% 100% 100% 100% 81% 16% 0% dishwashing residential High 0% 19% 84% 100% dishwashing EfÏciency residential Reference 100% 100% 100% 100% 100% 100% 100% 100% 100% 87% 42% 8% freezing residential High 0% 14% 59% 92% freezing EfÏciency residential Reference 37% 19% 14% 11% 37% 19% 14% 11% 37% 19% 14% 11% lighting residential High 63% 81% 86% 89% 63% 81% 86% 89% 63% 81% 86% 89% lighting EfÏciency SPP FUTURE LOAD SCENARIOS | EVOLVED ENERGY RESEARCH | 35
Baseline Moderate Full Subsector Tech Group 2023 2030 2040 2050 2023 2030 2040 2050 2023 2030 2040 2050 residential Reference 100% 100% 100% 100% 100% 100% 100% 100% 100% 83% 29% 2% refrigeration residential High 0% 17% 71% 98% refrigeration EfÏciency residential Reference 67% 67% 66% 65% 67% 60% 52% 49% 67% 55% 23% 6% space heating residential Electric 33% 33% 34% 35% 33% 40% 48% 51% 33% 45% 77% 95% space heating residential Reference 55% 54% 53% 53% 55% 49% 45% 45% 54% 40% 7% 0% water heating residential Electric 45% 46% 47% 47% 45% 51% 55% 55% 46% 60% 93% 100% water heating buses Reference 98% 98% 98% 98% 97% 75% 46% 41% 98% 80% 15% 0% buses High 2% 2% 2% 2% 2% 1% 1% 1% 2% 1% 0% 0% EfÏciency buses Electric 1% 22% 47% 51% 0% 18% 77% 90% buses Hydrogen 0% 2% 7% 8% 0% 1% 8% 10% heavy duty Reference 100% 100% 100% 100% 100% 94% 80% 72% 100% 86% 44% 10% trucks heavy duty Electric 0% 0% 0% 0% 0% 6% 20% 28% 0% 7% 41% 65% trucks heavy duty Hydrogen 0% 0% 0% 0% 0% 0% 0% 0% 0% 7% 15% 25% trucks light duty Reference 94% 87% 73% 66% 95% 84% 47% 29% 95% 81% 32% 4% autos light duty High 3% 4% 6% 8% 4% 8% 10% 9% 3% 3% 1% 0% autos EfÏciency light duty Electric 3% 9% 21% 27% 2% 8% 43% 62% 2% 16% 65% 92% autos light duty Hydrogen 0% 0% 0% 0% 0% 0% 0% 0% 0% 0% 3% 5% autos light duty Reference 98% 93% 86% 82% 96% 76% 37% 24% 97% 83% 34% 4% trucks light duty High 2% 4% 6% 7% 2% 9% 10% 8% 1% 1% 0% 0% trucks EfÏciency light duty Electric 1% 4% 9% 11% 2% 16% 53% 68% 2% 16% 60% 86% trucks light duty Hydrogen 0% 0% 0% 0% 0% 0% 0% 0% 0% 1% 6% 9% trucks medium duty Reference 100% 100% 100% 100% 100% 92% 59% 37% 100% 88% 52% 12% trucks medium duty Electric 0% 0% 0% 0% 0% 8% 41% 63% 0% 11% 40% 71% trucks medium duty Hydrogen 0% 0% 0% 0% 0% 0% 0% 0% 0% 1% 8% 17% trucks SPP FUTURE LOAD SCENARIOS | EVOLVED ENERGY RESEARCH | 36
www.evolved.energy © Evolved Energy Research 2024 | 1431 Pacific Highway, Suite 2 San Diego, CA 92101 | info@evolved.energy Tel: 844-566-1366