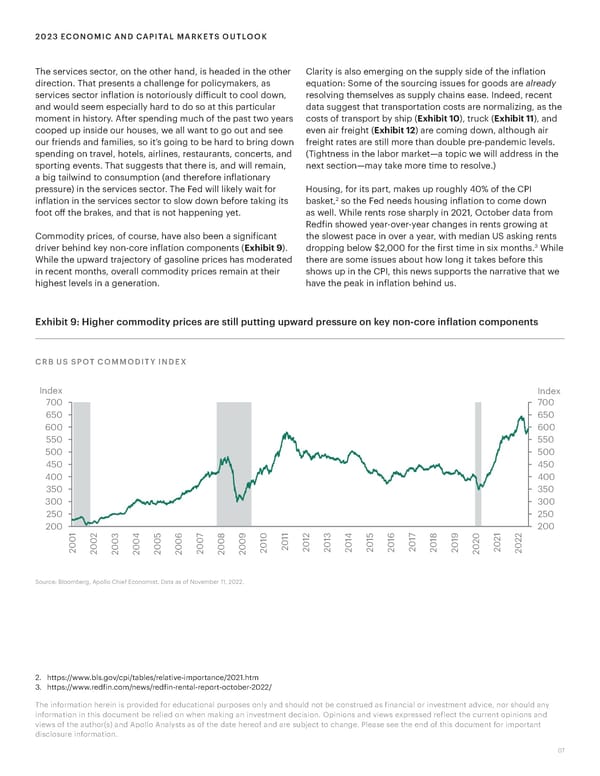
2023 ECONOMIC AND CAPITAL MARKETS OUTLOOK The services sector, on the other hand, is headed in the other Clarity is also emerging on the supply side of the inflation direction. That presents a challenge for policymakers, as equation: Some of the sourcing issues for goods are already services sector inflation is notoriously difficult to cool down, resolving themselves as supply chains ease. Indeed, recent and would seem especially hard to do so at this particular data suggest that transportation costs are normalizing, as the moment in history. After spending much of the past two years costs of transport by ship (Exhibit 10), truck (Exhibit 11), and cooped up inside our houses, we all want to go out and see even air freight (Exhibit 12) are coming down, although air our friends and families, so it’s going to be hard to bring down freight rates are still more than double pre-pandemic levels. spending on travel, hotels, airlines, restaurants, concerts, and (Tightness in the labor market—a topic we will address in the sporting events. That suggests that there is, and will remain, next section—may take more time to resolve.) a big tailwind to consumption (and therefore inflationary pressure) in the services sector. The Fed will likely wait for Housing, for its part, makes up roughly 40% of the CPI 2 inflation in the services sector to slow down before taking its basket, so the Fed needs housing inflation to come down foot off the brakes, and that is not happening yet. as well. While rents rose sharply in 2021, October data from Redfin showed year-over-year changes in rents growing at Commodity prices, of course, have also been a significant the slowest pace in over a year, with median US asking rents 3 driver behind key non-core inflation components (Exhibit 9). dropping below $2,000 for the first time in six months. While While the upward trajectory of gasoline prices has moderated there are some issues about how long it takes before this in recent months, overall commodity prices remain at their shows up in the CPI, this news supports the narrative that we highest levels in a generation. have the peak in inflation behind us. Exhibit 9: Higher commodity prices are still putting upward pressure on key non-core inflation components CRB US SPOT COMMODITY INDEX Index Index 700 700 650 650 600 600 550 550 500 500 450 450 400 400 350 350 300 300 250 250 200 1 2 5 7 1 2 5 7 1 2 200 3 4 6 8 9 0 1 1 3 4 1 6 1 8 9 0 2 0 0 0 0 0 0 0 0 0 1 0 0 1 1 0 1 0 1 1 2 0 2 0 0 0 0 0 0 0 0 0 0 2 2 0 0 2 0 2 0 0 0 2 0 2 2 2 2 2 2 2 2 2 2 2 2 2 2 2 2 2 Source: Bloomberg, Apollo Chief Economist. Data as of November 11, 2022. 2. https://www.bls.gov/cpi/tables/relative-importance/2021.htm 3. https://www.redfin.com/news/redfin-rental-report-october-2022/ The information herein is provided for educational purposes only and should not be construed as financial or investment advice, nor should any information in this document be relied on when making an investment decision. Opinions and views expressed reflect the current opinions and views of the author(s) and Apollo Analysts as of the date hereof and are subject to change. Please see the end of this document for important disclosure information. 07
 Apollo 2023 Economic and Capital Markets Outlook Page 6 Page 8