ESG Report | Apple
Apple’s 2022 ESG Report Environmental Social Governance Report
Introduction 3 Letter from Tim Cook 4 Report highlights 6 Our approach 8 Our commitment to transparency 9 Advocating for change 10 Our commitment to human rights Environment 13 Our approach 13 Climate change 18 Resources 20 Smarter chemistry Our People 23 Our approach 23 Inclusion and diversity 26 Growth and development 27 Benefits 28 Compensation 29 Engagement 30 Workplace practices and policies 33 Health and safety at Apple Suppliers 37 Our approach 40 Labor and human rights in the supply chain 43 Health, safety, and wellness 44 Responsible materials sourcing 45 Education and professional development 46 Environment Customers 48 Our approach 48 Privacy 50 Accessibility 52 Inclusive design 53 Education 54 Health 55 Caring for customers Communities 59 Our approach 60 Racial Equity and Justice Initiative 62 Education 64 Affordable housing initiative 65 Corporate donations 67 Employee giving 68 Job creation Governance 70 Corporate governance 71 Ethics and compliance 72 Tax payments Appendix 74 Awards and recognition 75 United Nations Sustainable Development Goals 77 Stakeholder engagement 78 ESG data summary 84 About the report 85 Endnotes ESG Index ↗︎ This report contains forward-looking statements and actual results may differ. Numbers and percentages in this report include estimates or approximations and may be based on assumptions. For more information, see “About the report.” Contents Environmental Social Governance Apple’s 2022 ESG Report 2 Appendix Governance Communities Suppliers Customers Our People Environment Introduction
Today, our teams around the world infuse Apple’s deeply held values into everything we make. That work can take many forms. But whether we’re protecting the right to privacy, designing technology that is accessible to all, or using more recycled material in our products than ever, we are always working to make a difference for the people we serve and the planet we inhabit. As a company, we know that our impact on people’s lives reaches beyond the technology we create. And we apply the same ethos of constant innovation and improvement to every aspect of our work — from building an inclusive company culture where everyone feels welcome to becoming carbon neutral across our global supply chain and the lifetime of our products by 2030. At the heart of our efforts is a steadfast commitment to serving the communities we are a part of. We work with teachers, advocates, and entrepreneurs from diverse backgrounds as part of our Racial Equity and Justice Initiative. We help create opportunity in communities on the frontlines of climate change through the Restore Fund, which supports carbon removal and sustainable forestry. And we provide resources and training to the next generation of innovators through the Apple Developer Academy and educational initiatives across the globe. In this report, we are pleased to share our progress, which is a product of collaboration with committed partners worldwide. At Apple, we believe that the only way to effectively tackle global challenges is by working together, and we are grateful to share this road with so many passionate leaders. We’re engaged in this work because it’s right — and because we want to leave the world better than we found it in everything we do. By leading with our values, we hope to be a ripple in the pond that inspires a far greater change. Tim Cook CEO Tim Cook CEO At Apple, we believe the measure of any great innovation is the positive impact it has on people’s lives. It’s why we work every day to make our technology an even greater force for good. Apple’s 2022 ESG Report 3 Appendix Governance Communities Suppliers Customers Our People Environment Introduction
Report highlights * Pay equity at the intersections of race and ethnicity with gender was achieved in 2022. ** Leadership roles include managers at all levels of our company. Increased representation in leadership In calendar year 2021, 47% of open leadership** roles were filled by women globally, an increase of 10 percentage points since 2020, and we’ve had an 87% increase in women in leadership since 2014. And in 2021, we hired more Black and Hispanic/Latinx team members in the U.S. than ever before, with 13% open leadership roles filled by Black candidates and 12% filled by Hispanic/Latinx candidates. Since 2014, we’ve had an 84% increase in the number of Black employees and a 90% increase in the number of Hispanic/Latinx employees in leadership in the U.S. - – –> Continue reading on page 24 More than doubled renewable energy in our supply chain As of March 2022, 213 suppliers have committed to renewable electricity for Apple production, representing the majority of Apple’s direct supplier spend. In fiscal year 2021, Apple and its suppliers brought online over 10 megawatts of renewable energy in our supply chain, doubling the amount from the prior year. - – –> Continue reading on page 16 Continued to maintain pay equity Since 2017, Apple has achieved and maintained gender pay equity for our employees worldwide. In the U.S., we’ve also achieved pay equity with respect to race and ethnicity — as well as pay equity at the intersections of race and ethnicity with gender.* - – –> Continue reading on page 28 Carbon neutral for corporate emissions Since April 2020, we’ve achieved carbon neutrality for our corporate emissions by sourcing 100 percent renewable electricity for Apple facilities, implementing energy efficiency initiatives, and securing carbon offsets for remaining emissions. - – –> Continue reading on page 13 Protected privacy with App Tracking Transparency With iOS 14.5 in April 2021, we released App Tracking Transparency for iPad and iPhone, requiring developers to obtain a user’s permission to track them across apps or websites owned by other companies for advertising purposes. - – –> Continue reading on page 49 Reduced overall emissions by 40% In fiscal year 2021, our environmental initiatives avoided over 23 million metric tons of emissions across all scopes, and we reduced our carbon footprint by 40 percent compared with fiscal year 2015. Efforts and initiatives that we’ve been growing for years made this possible — like sourcing 100 percent renewable electricity for our facilities, transitioning suppliers to clean energy, and using low-carbon materials in products. - – –> Continue reading on page 13 At Apple, we’re demonstrating every day that business can and should be a force for good. And we’ve made important progress over the last year through our Environmental, Social, and Governance (ESG) initiatives. That would not be possible without the innovation and collaboration of teams across Apple, and the people and organizations we partner with. As we look ahead, we know there is more to be done. We’re committed to continue to build on our efforts and drive even greater impact in the years to come. Apple’s 2022 ESG Report 4 Appendix Governance Communities Suppliers Customers Our People Environment Introduction
Marked 10 years of our Employee Giving program In 2021, Apple’s Employee Giving program celebrated its 10th anniversary, having raised nearly $725 million for 39,000 organizations worldwide — with over $120 million distributed to organizations around the globe in 2021 alone. The funds raised through Apple’s Employee Giving program include the work of 68,000 employees who have logged almost 2 million volunteer hours. - – –> Continue reading on page 67 Improved access to education for our schools and communities Our Community Education Initiative continued to grow, supporting and partnering with 147 education institutions and nonprofit organizations — including 47 HBCUs — in over 500 different locations across 36 states in the U.S. and four locations across the UK since its launch in 2019. - – –> Continue reading on page 62 We launched Apple Learning Coach, a free professional learning program that trains instructional coaches, digital learning specialists, and other coaching educators to help teachers effectively use Apple technology in the classroom. - – –> Continue reading on page 54 Committed an additional $55M to our Racial Justice and Equity Initiative Building on our initial $100 million commitment in 2020, we announced an additional $30 million commitment in August 2021. The funding supports efforts including the Global HSI Equity Innovation Hub, expanded learning opportunities for HBCUs, the first Apple Entrepreneur Camp for Hispanic/Latinx Founders and Developers, and funding for organizations driving criminal justice reform and environmental justice. And in May 2022, we committed $25 million to expand access to capital for community financial institutions supporting communities of color in historically underserved markets across the U.S. - – –> Continue reading on page 60 Expanded our investment in educational opportunities through our Supplier Employee Development Fund We announced our Supplier Employee Development Fund, which will expand our best-in-class labor programs in our supply chain and establish a global Education Hub to scale the expansion of the technical and professional skills necessary for the jobs of today and tomorrow in our supply chain and surrounding communities. - – –> Continue reading on page 45 Expanded new features to support accessibility To celebrate Global Accessibility Awareness Day 2022, we previewed upcoming software features to offer users with disabilities new tools for navigation, health, communication, and more. Apple’s announcement included Door Detection, a cutting-edge navigation feature for users who are blind or low vision, Live Captions for the Deaf and hard of hearing community, and Apple Watch Mirroring, which helps people with physical and motor disabilities control Apple Watch remotely from their paired iPhone. - – –> Continue reading on page 52 Upholding the highest standards in our supply chain We hold ourselves and our suppliers to the highest standards of labor and human rights, health and safety, and environmental stewardship. In fiscal year 2021, we conducted 1177 assessments, including 291 smelter and refiner assessments, to verify that suppliers are meeting our strict requirements. - – –> Continue reading on page 38 Responsibly sourced primary materials and supported local communities We continue to source primary materials responsibly. 100 percent of the identified tin, tungsten, tantalum, and gold (3TG), cobalt, and lithium smelters and refiners in our supply chain have participated in independent, third-party audits to assess and identify social, environmental, human rights, and governance risks. - – –> Continue reading on page 44 Further supported inclusive design Across Apple we’ve continued our sustained commitment to making products more inclusive. For example, we released new diverse voices for Siri, and we’re taking steps to advance equity in our cameras’ person recognition features. We’ve also developed Human Interface Guidelines to support developers in building inclusive apps. - – –> Continue reading on page 52 Apple’s 2022 ESG Report 5 Appendix Governance Communities Suppliers Customers Our People Environment Introduction
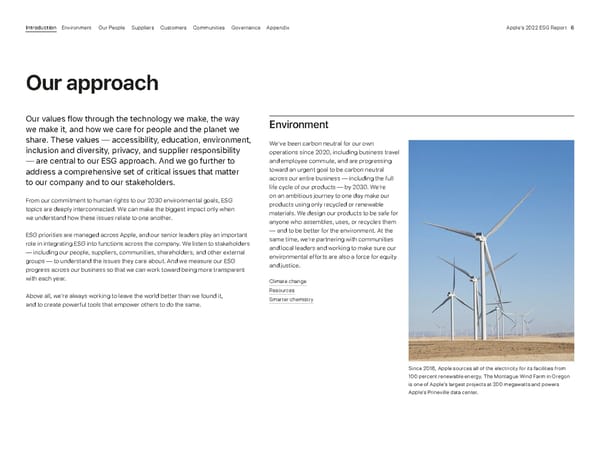
Our approach Our values flow through the technology we make, the way we make it, and how we care for people and the planet we share. These values — accessibility, education, environment, inclusion and diversity, privacy, and supplier responsibility — are central to our ESG approach. And we go further to address a comprehensive set of critical issues that matter to our company and to our stakeholders. From our commitment to human rights to our 2030 environmental goals, ESG topics are deeply interconnected. We can make the biggest impact only when we understand how these issues relate to one another. ESG priorities are managed across Apple, and our senior leaders play an important role in integrating ESG into functions across the company. We listen to stakeholders — including our people, suppliers, communities, shareholders, and other external groups — to understand the issues they care about. And we measure our ESG progress across our business so that we can work toward being more transparent with each year. Above all, we’re always working to leave the world better than we found it, and to create powerful tools that empower others to do the same. Since 2018, Apple sources all of the electricity for its facilities from 100 percent renewable energy. The Montague Wind Farm in Oregon is one of Apple’s largest projects at 200 megawatts and powers Apple’s Prineville data center. Environment We’ve been carbon neutral for our own operations since 2020, including business travel and employee commute, and are progressing toward an urgent goal to be carbon neutral across our entire business — including the full life cycle of our products — by 2030. We’re on an ambitious journey to one day make our products using only recycled or renewable materials. We design our products to be safe for anyone who assembles, uses, or recycles them — and to be better for the environment. At the same time, we’re partnering with communities and local leaders and working to make sure our environmental efforts are also a force for equity and justice. Climate change Resources Smarter chemistry Apple’s 2022 ESG Report 6 Appendix Governance Communities Suppliers Customers Our People Environment Introduction
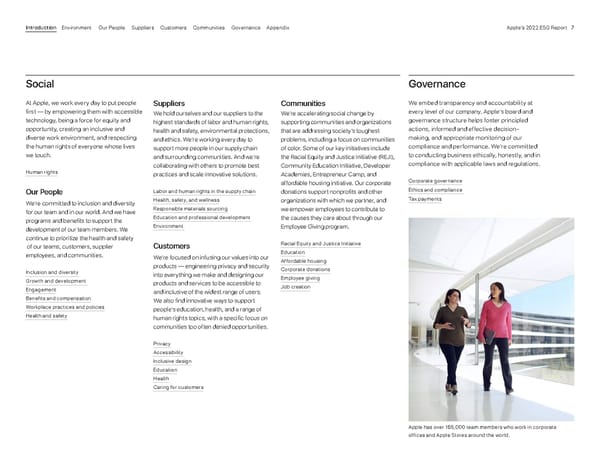
Social At Apple, we work every day to put people first — by empowering them with accessible technology, being a force for equity and opportunity, creating an inclusive and diverse work environment, and respecting the human rights of everyone whose lives we touch. Human rights Our People We’re committed to inclusion and diversity for our team and in our world. And we have programs and benefits to support the development of our team members. We continue to prioritize the health and safety of our teams, customers, supplier employees, and communities. Inclusion and diversity Growth and development Engagement Benefits and compensation Workplace practices and policies Health and safety Suppliers We hold ourselves and our suppliers to the highest standards of labor and human rights, health and safety, environmental protections, and ethics. We’re working every day to support more people in our supply chain and surrounding communities. And we’re collaborating with others to promote best practices and scale innovative solutions. Labor and human rights in the supply chain Health, safety, and wellness Responsible materials sourcing Education and professional development Environment Customers We’re focused on infusing our values into our products — engineering privacy and security into everything we make and designing our products and services to be accessible to and inclusive of the widest range of users. We also find innovative ways to support people’s education, health, and a range of human rights topics, with a specific focus on communities too often denied opportunities. Privacy Accessibility Inclusive design Education Health Caring for customers Communities We’re accelerating social change by supporting communities and organizations that are addressing society’s toughest problems, including a focus on communities of color. Some of our key initiatives include the Racial Equity and Justice Initiative (REJI), Community Education Initiative, Developer Academies, Entrepreneur Camp, and affordable housing initiative. Our corporate donations support nonprofits and other organizations with which we partner, and we empower employees to contribute to the causes they care about through our Employee Giving program. Racial Equity and Justice Initiative Education Affordable housing Corporate donations Employee giving Job creation Governance We embed transparency and accountability at every level of our company. Apple’s board and governance structure helps foster principled actions, informed and effective decision- making, and appropriate monitoring of our compliance and performance. We’re committed to conducting business ethically, honestly, and in compliance with applicable laws and regulations. Corporate governance Ethics and compliance Tax payments Apple has over 165,000 team members who work in corporate offices and Apple Stores around the world. Apple’s 2022 ESG Report 7 Appendix Governance Communities Suppliers Customers Our People Environment Introduction
Suppliers People and Environment in Our Supply Chain (22.5Mb PDF) Supplier Responsibility website Efforts to Combat Human Trafficking and Slavery Conflict Minerals Report Our ESG Index demonstrates how all of our reports and public disclosures map to leading frameworks, including the Sustainability Accounting Standards Board (SASB), Global Reporting Initiative (GRI), and Task Force on Climate-related Financial Disclosures (TCFD). Apple’s Newsroom also provides the latest updates regarding our programs, initiatives, and offerings mentioned throughout this report. Environment Environmental Progress Report (24.5Mb PDF) Environment website CDP Governance Human Rights Policy 2022 Proxy Statement Form 10-K Ethics & Compliance website Our people, customers, and communities Inclusion & Diversity website Benefits website Privacy website Transparency Report Accessibility website Education website Racial Equity and Justice website ESG Index ESG Index (2.6Mb PDF) Our commitment to transparency In addition to this report, we’ve been reporting on ESG topics for many years. See our topic-specific reports and websites for more information on each issue. Covering fiscal year 2021 Environmental Progress Report 2022 Annual Progress Report People and Environment in Our Supply Chain Apple’s 2022 ESG Report 8 Appendix Governance Communities Suppliers Customers Our People Environment Introduction
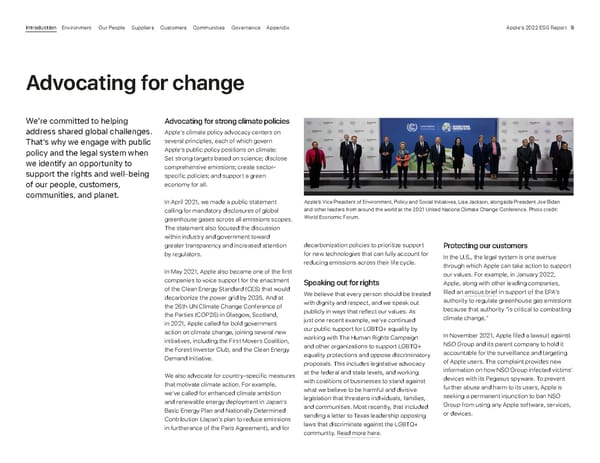
We’re committed to helping address shared global challenges. That’s why we engage with public policy and the legal system when we identify an opportunity to support the rights and well-being of our people, customers, communities, and planet. decarbonization policies to prioritize support for new technologies that can fully account for reducing emissions across their life cycle. Speaking out for rights We believe that every person should be treated with dignity and respect, and we speak out publicly in ways that reflect our values. As just one recent example, we’ve continued our public support for LGBTQ+ equality by working with The Human Rights Campaign and other organizations to support LGBTQ+ equality protections and oppose discriminatory proposals. This includes legislative advocacy at the federal and state levels, and working with coalitions of businesses to stand against what we believe to be harmful and divisive legislation that threatens individuals, families, and communities. Most recently, that included sending a letter to Texas leadership opposing laws that discriminate against the LGBTQ+ community. Read more here . Protecting our customers In the U.S., the legal system is one avenue through which Apple can take action to support our values. For example, in January 2022, Apple, along with other leading companies, filed an amicus brief in support of the EPA’s authority to regulate greenhouse gas emissions because that authority “is critical to combatting climate change.” In November 2021, Apple filed a lawsuit against NSO Group and its parent company to hold it accountable for the surveillance and targeting of Apple users. The complaint provides new information on how NSO Group infected victims’ devices with its Pegasus spyware. To prevent further abuse and harm to its users, Apple is seeking a permanent injunction to ban NSO Group from using any Apple software, services, or devices. Apple’s Vice President of Environment, Policy and Social Initiatives, Lisa Jackson, alongside President Joe Biden and other leaders from around the world at the 2021 United Nations Climate Change Conference. Photo credit: World Economic Forum. Advocating for strong climate policies Apple’s climate policy advocacy centers on several principles, each of which govern Apple’s public policy positions on climate: Set strong targets based on science; disclose comprehensive emissions; create sector- specific policies; and support a green economy for all. In April 2021, we made a public statement calling for mandatory disclosures of global greenhouse gases across all emissions scopes. The statement also focused the discussion within industry and government toward greater transparency and increased attention by regulators. In May 2021, Apple also became one of the first companies to voice support for the enactment of the Clean Energy Standard (CES) that would decarbonize the power grid by 2035. And at the 26th UN Climate Change Conference of the Parties (COP26) in Glasgow, Scotland, in 2021, Apple called for bold government action on climate change, joining several new initiatives, including the First Movers Coalition, the Forest Investor Club, and the Clean Energy Demand Initiative. We also advocate for country-specific measures that motivate climate action. For example, we’ve called for enhanced climate ambition and renewable energy deployment in Japan’s Basic Energy Plan and Nationally Determined Contribution (Japan’s plan to reduce emissions in furtherance of the Paris Agreement), and for Advocating for change Apple’s 2022 ESG Report 9 Appendix Governance Communities Suppliers Customers Our People Environment Introduction
Our commitment to human rights Embedding respect for human rights We’ve worked to embed respect for human rights across our company — in the technology we make, the way we make it, and how we treat people. A number of teams are responsible for carrying out human rights due diligence, including the Privacy, Corporate, and Compliance teams within Apple’s Legal and Global Security organization, as well as Apple’s Environment and Supply Chain Innovation (ESCI) team within Worldwide Operations. Our commitment begins with treating everyone with dignity and respect. But it doesn’t end there. We believe in the power of technology to empower and connect people around the world — and that business can and should be a force for good. Identifying and managing salient human rights risks Identifying human rights risks is the first step to addressing those risks through improvements to our policies and management systems. We work to align our efforts with the business and human rights due diligence process set forth in the UNGPs to identify, mitigate, prevent, and remedy human rights risks. We identify salient human rights risks through internal risk assessments and external industry- level third-party audits, as well as through the channels we maintain with rights holders and other stakeholders, including investors, human rights and labor experts, governments, and international bodies such as the UN. In addition to our own internal monitoring, we consider reports identifying potential risks from external sources, including international organizations, policy makers, shareholders, civil society organizations, news outlets, customers, individuals in the supply chain or supply chain communities, whistleblower mechanisms, and third-party hotlines. Reports also come through the reporting mechanisms we make available directly to all supplier employees, Apple employees, and the general public. These reports can come to us in any language and can be anonymous. Our commitment to civil rights We are deeply committed to building a more just and inclusive world and are moving forward with plans to conduct a civil rights audit. Apple’s Human Rights Policy Our Human Rights Policy governs how we treat everyone, including our customers, employees, business partners, and people across our supply chain. We’re deeply committed to respecting internationally recognized human rights in our business operations, as set out in the United Nations (UN) International Bill of Human Rights and the International Labour Organization’s (ILO) Declaration on Fundamental Principles and Rights at Work. Our approach is based on the UN Guiding Principles on Business and Human Rights (UNGPs). We conduct human rights due diligence to identify risks and work to mitigate them. We also seek to remedy adverse impacts, track and measure our progress, and report our findings. Our board of directors adopted the policy and is responsible for overseeing and periodically reviewing it. Apple’s Senior Vice President and General Counsel is responsible for its implementation, and reports to the Board and its committees on our progress and significant issues. Apple’s 2022 ESG Report 10 Appendix Governance Communities Suppliers Customers Our People Environment Introduction
Based on this due diligence, examples of human rights issues of particular focus at Apple include: • Privacy, freedom of expression, and access to information risks • Discrimination risks in workforce management and in product and services development • Labor and human rights risks in the supply chain Across Apple, teams such as ESCI, EPSI, People, Privacy, and others work to avoid, prevent, mitigate — and where appropriate, remediate — human rights issues and impacts across Apple’s business, including through our commitments to: • Respecting the rights to privacy, freedom of expression, and access to information • Promoting diversity, equity, and inclusion, including in our workforce, leadership, product and services development, and our industry • Respecting labor and human rights in our supply chain by working closely with suppliers so that people in our supply chain are treated with dignity and respect • Respecting human rights through our efforts to protect the planet in how we design, build, and recycle our products, and through responsible sourcing and use of materials and natural resources Tracking progress We’re committed to continually assessing our progress and incorporating what we learn into our work. We track and measure our performance across a range of areas, and apply the lessons we learn to continually improve. We publicly report detailed information on our approach and our performance in the reports, websites, and other disclosures listed on page 8 , as well as within this ESG Report: Inclusion and diversity Workplace practices Health and safety Labor and human rights in the supply chain Privacy Accessibility Inclusive design The rainbow arches at Apple Park in Cupertino, California are a nod to Apple’s original logo and an expression of our inclusive values. Apple’s 2022 ESG Report 11 Appendix Governance Communities Suppliers Customers Our People Environment Introduction
A planet- size plan. Environment In this section Our approach 13 Climate change 13 Resources 18 Smarter chemistry 20 Appendix Governance Communities Suppliers Customers Our People Introduction Apple’s 2022 ESG Report 12 Environment
Climate change As a global business, we believe it is our responsibility to take strong, decisive, and inclusive steps to mitigate our climate impact. We’ve committed to achieving carbon neutrality — reducing emissions 75 percent compared with fiscal year 2015 and balancing the residual emissions with carbon removal — across the life cycle of all of our products by 2030. 1 And the Science Based Targets initiative (SBTi) has validated an emissions reduction target for Apple derived from this goal. 2 It’s an ambitious plan with plenty of challenges ahead. But we’re already well on our way, having cut carbon emissions across our value chain by 40 percent since fiscal year 2015. Our work began years ago, making the transition to sourcing 100 percent renewable electricity at our offices, retail stores, and data centers, At Apple, we’re acting with urgency to protect our planet’s limited resources and to be a leader in the fight against climate change. Since 2020, we’ve been carbon neutral for our worldwide operations, and by 2030, we plan to expand that progress to our entire supply chain and the lifetime use of our products. And today, nearly 20 percent of the materials in our products were made from recycled content — a number we’re working to increase. Across our environmental work, we’re also committed to being a force for equity. We’re working with communities on the frontlines of climate change and the next generation of diverse entrepreneurs to create shared opportunity and to build a more just world. Our approach The environmental challenges we face today are significant, and we’re responding with urgency and dedication. We approach our work by focusing on fundamental questions. What matters most? And where can we make the greatest impact? These questions guide our work across our strategic focus areas of climate change, resources, and smarter chemistry — and inform our goals in how we can best achieve change. We know we’re not alone in working to reduce our environmental footprint. So we’re engaging with others to support our efforts and find opportunities to lift local communities along the way. Setting ambitious goals is essential to our approach — to drive the innovation and collaboration that makes change possible and to be transparent and accountable to our progress. Our work is led by Lisa Jackson, Apple’s Vice President of Environment, Policy and Social Initiatives, reporting directly to CEO Tim Cook. The Environment, Policy and Social Initiatives team works with other teams across Apple to set strategy, engage stakeholders, and communicate progress. Our integrated approach means that decisions about the environment are reviewed and supported at the highest levels of the company. Our 2022 Environmental Progress Report provides a detailed overview of our work and how we’re progressing toward our goals. which we achieved in 2018. And in 2020, we reached the milestone of being carbon neutral for our corporate operations, including direct emissions as well as business travel and employee commute. Our 10-year Climate Roadmap is addressing Apple’s carbon footprint through five pillars: Low-carbon design: We will design products and manufacturing processes to be less carbon-intensive through thoughtful material selection, increased material efficiency, and greater product energy efficiency. Energy efficiency: We will increase energy efficiency at our facilities and in our supply chain by finding opportunities, such as retrofitting, to reduce energy use. Appendix Governance Communities Suppliers Customers Our People Environment Introduction Apple’s 2022 ESG Report 13
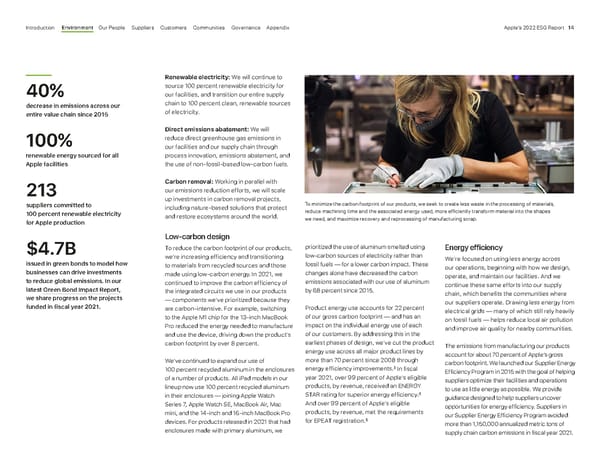
Renewable electricity: We will continue to source 100 percent renewable electricity for our facilities, and transition our entire supply chain to 100 percent clean, renewable sources of electricity. Direct emissions abatement: We will reduce direct greenhouse gas emissions in our facilities and our supply chain through process innovation, emissions abatement, and the use of non- fossil -based low -carbon fuels. Carbon removal: Working in parallel with our emissions reduction efforts, we will scale up investments in carbon removal projects, including nature -based solutions that protect and restore ecosystems around the world. Low-carbon design To reduce the carbon footprint of our products, we’re increasing efficiency and transitioning to materials from recycled sources and those made using low-carbon energy. In 2021, we continued to improve the carbon efficiency of the integrated circuits we use in our products — components we’ve prioritized because they are carbon-intensive. For example, switching to the Apple M1 chip for the 13-inch MacBook Pro reduced the energy needed to manufacture and use the device, driving down the product’s carbon footprint by over 8 percent. We’ve continued to expand our use of 100 percent recycled aluminum in the enclosures of a number of products. All iPad models in our lineup now use 100 percent recycled aluminum in their enclosures — joining Apple Watch Series 7, Apple Watch SE, MacBook Air, Mac mini, and the 14-inch and 16-inch MacBook Pro devices. For products released in 2021 that had enclosures made with primary aluminum, we Energy efficiency We’re focused on using less energy across our operations, beginning with how we design, operate, and maintain our facilities. And we continue these same efforts into our supply chain, which benefits the communities where our suppliers operate. Drawing less energy from electrical grids — many of which still rely heavily on fossil fuels — helps reduce local air pollution and improve air quality for nearby communities. The emissions from manufacturing our products account for about 70 percent of Apple’s gross carbon footprint. We launched our Supplier Energy Efficiency Program in 2015 with the goal of helping suppliers optimize their facilities and operations to use as little energy as possible. We provide guidance designed to help suppliers uncover opportunities for energy efficiency. Suppliers in our Supplier Energy Efficiency Program avoided more than 1,150,000 annualized metric tons of supply chain carbon emissions in fiscal year 2021. 40% decrease in emissions across our entire value chain since 2015 100% renewable energy sourced for all Apple facilities 213 suppliers committed to 100 percent renewable electricity for Apple production $4.7B issued in green bonds to model how businesses can drive investments to reduce global emissions. In our latest Green Bond Impact Report , we share progress on the projects funded in fiscal year 2021. To minimize the carbon footprint of our products, we seek to create less waste in the processing of materials, reduce machining time and the associated energy used, more efficiently transform material into the shapes we need, and maximize recovery and reprocessing of manufacturing scrap. prioritized the use of aluminum smelted using low-carbon sources of electricity rather than fossil fuels — for a lower carbon impact. These changes alone have decreased the carbon emissions associated with our use of aluminum by 68 percent since 2015. Product energy use accounts for 22 percent of our gross carbon footprint — and has an impact on the individual energy use of each of our customers. By addressing this in the earliest phases of design, we’ve cut the product energy use across all major product lines by more than 70 percent since 2008 through energy efficiency improvements. 3 In fiscal year 2021, over 99 percent of Apple’s eligible products, by revenue, received an ENERGY STAR rating for superior energy efficiency. 4 And over 99 percent of Apple’s eligible products, by revenue, met the requirements for EPEAT registration. 5 Appendix Governance Communities Suppliers Customers Our People Environment Introduction Apple’s 2022 ESG Report 14
Gross emissions Avoided emissions Emissions offset Corporate footprint Product footprint 0.02% Direct emissions (Scope 1) 0% Electricity (Scope 2) 0.5% Business travel and commute (Scope 3) 70% Product manufacturing (Scope 3) 22% Product use (Scope 3) 8% Product transport (Scope 3) 0.3% End-of-life product processing (Scope 3) Gross emissions Offsets Emissions categories (% of gross emissions) Corporate energy Corporate energy efficiency: efficiency: 0.06 million metric tons avoided Use of renewable Use of renewable electricity: electricity: 1.0 million metric tons avoided Load reduction and Load reduction and mode switching: mode switching: 0.2 million metric tons avoided tons avoided FY21 REC purchase: FY21 REC purchase: 0.2 million metric tons avoided Product energy efficiency: Product energy efficiency: 0.2 million metric tons avoided Supplier clean energy: Supplier clean energy: 13.9 million metric tons avoided Low-carbon materials*: Low-carbon materials*: 7.3 million metric tons avoided FY21 REC purchase: FY21 REC purchase: 0.4 million metric tons avoided Supplier energy efficiency: Supplier energy efficiency: 1.1 million metric tons avoided Apple’s comprehensive carbon footprint This past year we intensified our efforts to reduce Apple’s emissions. In fiscal year 2021, we avoided over 23 million metric tons of emissions across all scopes. Initiatives that we’ve been growing for years — like sourcing 100 percent renewable electricity for our facilities, transitioning suppliers to clean energy, and using low-carbon materials in products — yielded indisputable results. Thanks to this work, we’ve begun to decouple business growth from emissions: While our revenue grew 33 percent, our emissions grew by less than 5 percent. To mitigate this increase in emissions, we applied an additional 0.6 million tons of renewable energy credits (RECs) and 0.5 million metric tons of carbon offsets to proportionally cover electricity use and direct emissions, respectively, across our value chain. This represents a short-term bridging solution as we grow our carbon reduction programs to meet the scale of the challenge. * Low-carbon materials represents emissions savings from transitioning to recycled materials in our products, or use of low-carbon aluminum, as described on page 18 . ** Net carbon emissions represents our total gross footprint minus carbon offsets applied to each category. Percentages shown for each emissions category represent the share of Apple’s gross footprint. Totals add up to more than 100 percent, due to rounding. 22.5 million metric tons net carbon emissions ** Appendix Governance Communities Suppliers Customers Our People Environment Introduction Apple’s 2022 ESG Report 15
Renewable electricity Our retail stores, data centers, and offices around the world currently source 100 percent renewable electricity. We’ve focused our efforts to source renewables around several key pillars: creating new renewable energy projects, undertaking projects that deliver clear benefits to local communities, and supporting renewable energy innovations. About 1.5 gigawatts of Apple-created renewable electricity projects account for over 90 percent of the renewable electricity our facilities use. We continue to experience tremendous progress toward our goal of transitioning our manufacturing supply chain to 100 percent renewable electricity by 2030. As of March 2022, 213 manufacturing partners in 25 countries have committed to 100 percent renewable energy for Apple production. Over 70 percent of companies on Apple’s Supplier List — those suppliers that make up 98 percent of Apple’s direct spend for materials, manufacturing, and assembly of our products worldwide — have committed to 100 percent renewable electricity. In addition, many other smaller suppliers have also made these commitments. Direct emissions abatement To address the non-electricity emissions associated with our materials and manufacturing processes, we seek technological solutions through emissions abatement or switching to low-carbon fuel options. For example, we partnered with aluminum companies and the governments of Canada and Quebec to help fund research and development for ELYSIS, a technology that eliminates direct greenhouse gas emissions from aluminum smelting. Many components essential to products like ours, including integrated circuit chips and display panels, currently rely on manufacturing processes that use fluorinated gases, which have high global warming potential. We’re partnering closely with key manufacturers to prevent these gases from being released into the atmosphere by optimizing manufacturing processes and deploying abatement technologies. To address emissions from shipping products to our customers, we’re shifting whenever possible toward less carbon-intensive shipping modes, such as rail and ocean. And we’re seeking out technical innovations, including alternative fuels and electric vehicles. In fiscal year 2021, Apple avoided 180,000 metric tons of CO 2 e by shifting the mode of transport and reducing product weight through the removal of the power adapter from the box of iPhone devices. Providing access to clean energy in South Africa Even a few years ago, not everyone in one community in South Africa had electricity at home. Many people had been using battery-powered lanterns because upfront costs and other challenges put connecting to the grid out of reach. As we worked with our partners to identify new renewable energy projects for our Power for Impact program, we saw exciting potential in this community. Our partner on the ground, DC GO, a solar energy provider based in Johannesburg, got to work meeting members of the community and learning more about their needs. Ultimately, DC GO developed a pay-as-you-go model that brought solar energy to 3500 homes that previously lacked access. This was possible only because of the way they built relationships with community members and worked with Apple to price the solution in line with what people were already spending on batteries for their lanterns. In addition, DC GO hired and trained local people for jobs in sales, maintenance, and other roles that not only created local jobs but also helped to make sure the project — and the community’s access to electricity — would be sustainable over time. This is just one example of how the Power for Impact program is working to benefit communities, our company, and the environment at the same time. Learn more on pages 22 and 27 of our Environmental Progress Report . With access to electricity in their homes, kids can now do homework at night and families can cook meals indoors. Appendix Governance Communities Suppliers Customers Our People Environment Introduction Apple’s 2022 ESG Report 16
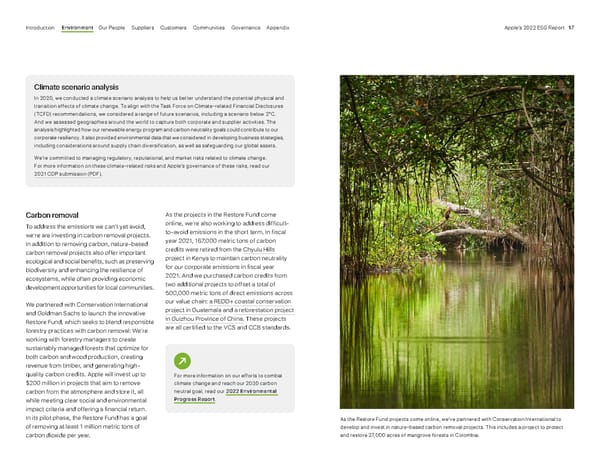
Carbon removal To address the emissions we can’t yet avoid, we’re are investing in carbon removal projects. In addition to removing carbon, nature-based carbon removal projects also offer important ecological and social benefits, such as preserving biodiversity and enhancing the resilience of ecosystems, while often providing economic development opportunities for local communities. We partnered with Conservation International and Goldman Sachs to launch the innovative Restore Fund, which seeks to blend responsible forestry practices with carbon removal: We’re working with forestry managers to create sustainably managed forests that optimize for both carbon and wood production, creating revenue from timber, and generating high- quality carbon credits. Apple will invest up to $200 million in projects that aim to remove carbon from the atmosphere and store it, all while meeting clear social and environmental impact criteria and offering a financial return. In its pilot phase, the Restore Fund has a goal of removing at least 1 million metric tons of carbon dioxide per year. For more information on our efforts to combat climate change and reach our 2030 carbon neutral goal, read our 2022 Environmental Progress Report . Climate scenario analysis In 2020, we conducted a climate scenario analysis to help us better understand the potential physical and transition effects of climate change. To align with the Task Force on Climate-related Financial Disclosures (TCFD) recommendations, we considered a range of future scenarios, including a scenario below 2°C. And we assessed geographies around the world to capture both corporate and supplier activities. The analysis highlighted how our renewable energy program and carbon neutrality goals could contribute to our corporate resiliency. It also provided environmental data that we considered in developing business strategies, including considerations around supply chain diversification, as well as safeguarding our global assets. We’re committed to managing regulatory, reputational, and market risks related to climate change. For more information on these climate-related risks and Apple’s governance of these risks, read our 2021 CDP submission (PDF) . As the Restore Fund projects come online, we’ve partnered with Conservation International to develop and invest in nature-based carbon removal projects. This includes a project to protect and restore 27,000 acres of mangrove forests in Colombia. As the projects in the Restore Fund come online, we’re also working to address difficult- to-avoid emissions in the short term. In fiscal year 2021, 167,000 metric tons of carbon credits were retired from the Chyulu Hills project in Kenya to maintain carbon neutrality for our corporate emissions in fiscal year 2021. And we purchased carbon credits from two additional projects to offset a total of 500,000 metric tons of direct emissions across our value chain: a REDD+ coastal conservation project in Guatemala and a reforestation project in Guizhou Province of China . These projects are all certified to the VCS and CCB standards. Appendix Governance Communities Suppliers Customers Our People Environment Introduction Apple’s 2022 ESG Report 17
Resources Natural resources make our work possible — and we take responsibility for how we source, use, and recycle the materials we rely on to create our products. As a starting point, this means sourcing responsibly, minimizing our freshwater use, and eliminating waste across our operations and those of our suppliers. And we’re also seeking to redefine the overall resource footprint of our products. Our goal is to one day make products using only responsibly sourced recycled and renewable materials. Within resources, we focus on three main areas of impact: • Materials: Transitioning to only recycled or renewable materials in our products and packaging, and maximizing material efficiency, product longevity, and recovery. • Water: Reducing water impacts in the manufacturing of our products, use of our services, and operation of our facilities. At the same time, transitioning to alternative sources, improving the quality of water we discharge, and protecting shared water resources. • Zero waste: Minimizing overall waste generated and eliminating waste sent to landfill from our manufacturing supply chain as well as corporate offices, data centers, and retail stores. Materials We aim to make the best use of the materials we rely on to make our products. That’s why we’re focusing on three different levers to reduce our footprint and achieve circularity: sourcing and efficiency; product longevity; and product end-of-life. Sourcing and efficiency Last year, we made progress across materials — from expanding our use of recycled rare earth elements to designing cameras with recycled gold. In September, we introduced iPhone 13, with more certified recycled materials than any previous version of iPhone. We also introduced 100 percent recycled aluminum enclosures on every single model in the iPad lineup. Welcoming the first class of the Impact Accelerator Last year, we welcomed the first class to our Impact Accelerator, a program for Black- ,Hispanic/Latinx-, and Indigenous-owned businesses headquartered in the United States that share our focus on innovation and our commitment to the environment. Part of Apple’s Racial Equity and Justice Initiative (see page 60 ), the Accelerator aims to help combat systemic barriers to opportunity, while also advancing innovative solutions for communities most impacted by climate change. We selected our first class of 15 businesses on the cutting edge of green technology and clean energy to begin the program in August 2021. The three-month program included live virtual sessions, online courses on supply chain management, supplier diversity, financial and legal subjects, as well as one-on-one mentorship with an Apple expert on topics from renewable energy to responsible sourcing. The goal of the Impact Accelerator is to better position the participating companies for growth, to improve their abilities to take on larger contracts, and to expand their customer base — all while fostering their environmental commitment. For example, last October we announced that we will be working with the Oceti Sakowin Power Authority, formed by six Sioux tribes to jointly develop tribal renewable energy resources, on a project to create a wind power development in the Midwest. And following the success of this year’s class, our efforts continue. This spring, applications opened for the next class to join our Impact Accelerator. For Apple’s inaugural Impact Accelerator, leaders from 15 companies participated in a three-month virtual program with customized training and access to Apple expert mentors. 20% In fiscal year 2021, nearly 20 percent of the material we shipped in products came from recycled and renewable sources 2x In fiscal year 2021, we more than doubled our use of recycled tungsten, rare earth elements, and cobalt — and introduced certified recycled gold for the first time in an Apple product 75% We’ve reduced the plastic in our packaging by 75 percent compared with 2015, progressing toward our goal to eliminate all plastic from our packaging by 2025 Appendix Governance Communities Suppliers Customers Our People Environment Introduction Apple’s 2022 ESG Report 18
Across our business, we released eight products with more than 20 percent recycled content. 6 The MacBook Air with M1 chip (2020) had the highest total — made with 44 percent recycled content device-wide, including 100 percent recycled aluminum in the enclosure. These and other innovations helped us increase our use of recycled or renewable content to 18 percent of all the material shipped in products in fiscal year 2021. 7 Product longevity We want to make the most of the materials we use through designing long-lasting products. We are designing durable hardware, leveraging software updates to extend functionality, expanding access to repair services, refurbishing devices for their next user, and reusing parts that still have more to give. Read more on caring for customers on page 56 . Product end-of-life By effectively recovering the materials in our products, we enable the circular supply chains that make the best use of finite resources. Through our work in this area, we’re reducing the need to mine new materials and the amount of energy needed to manufacture new products, ultimately driving down emissions and conserving resources. In 99 percent of the countries where we sell products, we continue to provide and participate in product take-back and recycling collection programs. With the help of customer and employee participation across recycling programs, we directed more than 38,000 metric tons of e-waste to recycling globally in fiscal year 2021. We’ve also continued to innovate on disassembly technologies. Daisy, the robot we designed to disassemble iPhone devices, has now been joined by Dave, which dismantles Taptic Engines from iPhone to enable the recovery of materials like rare earth elements, tungsten, and steel, and Taz, designed to recycle modules containing rare earth magnets. At our Material Recovery Lab we’re working on developing better, more efficient means of disassembling products that maximize material recovery, while minimizing waste. Water stewardship We’re committed to managing the resources we share with the communities where we and our suppliers operate. Our efforts to address the water footprint of our corporate sites and of our suppliers’ sites focus on: • Using water efficiently • Expanding the use of alternative water sources, including onsite reuse • Discharging water responsibly • Enhancing our water stewardship to keep watersheds healthy for all who rely on them In fiscal year 2021, our facilities used about 1.4 billion gallons of water. We saved 133 million gallons of freshwater this fiscal year due to efficiency projects implemented since 2017. 9 Last year, alternative water sources accounted for 10 percent of our total corporate water usage — primarily from recycled water sources. 10 Our supply chain accounts for 99 percent of our total water footprint, based on our detailed water inventory. That’s why we partner closely with our suppliers through our Clean Water Program. The more than 195 participating supplier sites increased their average reuse rate to 41 percent and saved our suppliers 12.3 billion gallons of freshwater in fiscal year 2021 — for a total of 50.3 billion gallons of water savings since the program’s launch in 2013. 11 Innovating packaging to reduce our footprint We’ve made significant progress toward eliminating all plastics from our packaging by 2025. This past year, plastics accounted for only 4 percent of our packaging. Since 2015, we’ve dedicated our efforts to replacing large plastic trays, wraps, and foam cushioning with fiber alternatives that have higher recovery rates and reduced environmental footprints. This year, the iPhone 13 and iPhone 13 Pro were the first iPhone models to be shipped without any plastic packaging components. 8 And we replaced plastic foam with a fiber alternative to protect the 24-inch iMac during shipping. For the 24-inch iMac, using corrugated fiber rather than foam for shock absorption allowed us to reduce plastic by 72 percent. Appendix Governance Communities Suppliers Customers Our People Environment Introduction Apple’s 2022 ESG Report 19
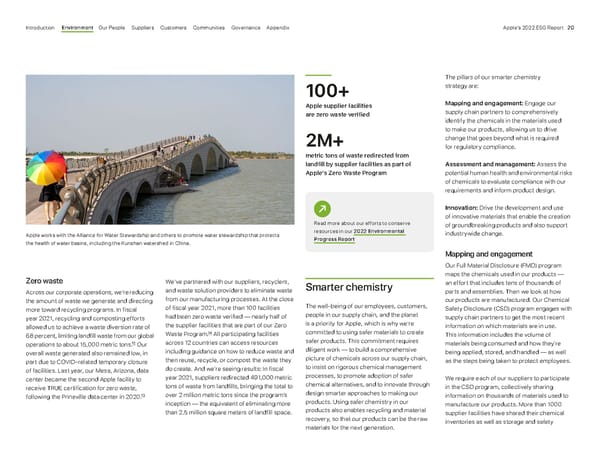
Smarter chemistry The well-being of our employees, customers, people in our supply chain, and the planet is a priority for Apple, which is why we’re committed to using safer materials to create safer products. This commitment requires diligent work — to build a comprehensive picture of chemicals across our supply chain, to insist on rigorous chemical management processes, to promote adoption of safer chemical alternatives, and to innovate through design smarter approaches to making our products. Using safer chemistry in our products also enables recycling and material recovery, so that our products can be the raw materials for the next generation. The pillars of our smarter chemistry strategy are: Mapping and engagement: Engage our supply chain partners to comprehensively identify the chemicals in the materials used to make our products, allowing us to drive change that goes beyond what is required for regulatory compliance. Assessment and management: Assess the potential human health and environmental risks of chemicals to evaluate compliance with our requirements and inform product design. Innovation: Drive the development and use of innovative materials that enable the creation of groundbreaking products and also support industrywide change. Mapping and engagement Our Full Material Disclosure (FMD) program maps the chemicals used in our products — an effort that includes tens of thousands of parts and assemblies. Then we look at how our products are manufactured. Our Chemical Safety Disclosure (CSD) program engages with supply chain partners to get the most recent information on which materials are in use. This information includes the volume of materials being consumed and how they’re being applied, stored, and handled — as well as the steps being taken to protect employees. We require each of our suppliers to participate in the CSD program, collectively sharing information on thousands of materials used to manufacture our products. More than 1000 supplier facilities have shared their chemical inventories as well as storage and safety Zero waste Across our corporate operations, we’re reducing the amount of waste we generate and directing more toward recycling programs. In fiscal year 2021, recycling and composting efforts allowed us to achieve a waste diversion rate of 68 percent, limiting landfill waste from our global operations to about 15,000 metric tons. 12 Our overall waste generated also remained low, in part due to COVID-related temporary closure of facilities. Last year, our Mesa, Arizona, data center became the second Apple facility to receive TRUE certification for zero waste, following the Prineville data center in 2020. 13 Apple works with the Alliance for Water Stewardship and others to promote water stewardship that protects the health of water basins, including the Kunshan watershed in China. 100+ Apple supplier facilities are zero waste verified 2M+ metric tons of waste redirected from landfill by supplier facilities as part of Apple’s Zero Waste Program Read more about our efforts to conserve resources in our 2022 Environmental Progress Report We’ve partnered with our suppliers, recyclers, and waste solution providers to eliminate waste from our manufacturing processes. At the close of fiscal year 2021, more than 100 facilities had been zero waste verified — nearly half of the supplier facilities that are part of our Zero Waste Program. 14 All participating facilities across 12 countries can access resources including guidance on how to reduce waste and then reuse, recycle, or compost the waste they do create. And we’re seeing results: In fiscal year 2021, suppliers redirected 491,000 metric tons of waste from landfills, bringing the total to over 2 million metric tons since the program’s inception — the equivalent of eliminating more than 2.5 million square meters of landfill space. Appendix Governance Communities Suppliers Customers Our People Environment Introduction Apple’s 2022 ESG Report 20
protocols as part of our CSD program. Through this process, we’ve identified more than 17,000 chemicals and applications. These efforts contribute to a safer work environment for people across our supply chain. Assessment and management The data we collect on chemicals and materials forms the foundation for key decisions that have an impact on our product designs, manufacturing processes, and approach to recycling and reuse. This data enables us to establish requirements for our suppliers, including those set out in our Regulated Substances Specification (RSS) and the Restricted Chemicals for Prolonged Skin Contact Materials list . These requirements provide clear guidelines on potentially harmful materials, including those that are restricted. Our assessment system helps to ensure that only materials that meet our stringent requirements are used in Apple products. At our Environmental Testing Lab, we evaluate the safety of our products and materials through chemical analyses. Our chemists test materials for safety and monitor compliance with our specifications. In fiscal year 2021, we performed toxicological assessments on 1000 new materials to proactively evaluate and eliminate potentially harmful substances from our products. Both the data we gather on chemicals and our rigorous assessments allow us to make informed decisions and manage chemicals, for the safety of those who use, make, and recycle our products. Comprehensive chemical mapping Understanding chemical ingredients leads to better materials for Apple products Through our Full Material Disclosure (FMD) program, manufacturers share chemical ingredients used to make materials with Apple. With FMD data, Apple evaluates the chemicals in materials against restrictions. Data helps Apple suppliers manage chemicals when making Apple products Information on how chemicals are used, how they’re stored, and how employees are protected is shared with Apple by suppliers through our Chemical Safety Disclosure (CSD) program. CSD data informs and prioritizes supplier engagement, helping to ensure rigorous chemical management practices and adoption of safer alternatives. Apple customers benefit from use of products made with safer ingredients The FMD and CSD programs help support creation of best-in-class products in a responsible manner for our customers. Mapping chemicals Mapping chemicals throughout product throughout product development leads to development leads to better, better, safer products safer products Read more about our commitment to using safer materials to create safer products in our 2022 Environmental Progress Report Innovation The work we do in mapping, assessing, and managing the chemicals within our supply chain underpins our innovations. We rely on detailed information on the material properties, including toxicological data and environmental performance characteristics. We also look at how these materials are used at each point in the product life cycle, from design, to manufacturing, to end-of-life. This allows us to seek out and support the development of safer chemistries that have an impact on each phase — and contribute to continually improving the overall safety of our products and processes. Since the late 1990s, we have diligently identified and removed potentially harmful chemicals from our products, such as brominated flame retardants, beryllium, mercury, and lead. We’re also driving the use of safer process chemicals in our supply chain: Since 2018, all our final assembly sites have used only safer alternative cleaners and degreasers. As we work toward minimizing potentially harmful chemistries in our products and processes, we’re making the transition to safer alternatives accessible to others through industry initiatives, partnerships, and standards with the hope of driving chemical safety across the industry. Appendix Governance Communities Suppliers Customers Our People Environment Introduction Apple’s 2022 ESG Report 21
Our People In this section Our approach 23 Inclusion and diversity 23 Growth and development 26 Benefits 27 Compensation 28 Engagement 29 Workplace practices and policies 30 Health and safety at Apple 33 The heart of who we are. Appendix Governance Communities Suppliers Customers Environment Introduction Apple’s 2022 ESG Report 22 Our P eople
Inclusion and diversity At Apple, we remain committed to building a more equitable and inclusive world by increasing diverse representation at every level, fostering an inclusive culture that brings everybody in, and ensuring equitable pay and access to opportunity for all. Inclusive representation in leadership is a powerful driver of progress. At Apple, leaders of all backgrounds are working to grow and develop our next generation of leaders from within. We’re committed to increasing the number of managers from underrepresented communities, because differences in our backgrounds, our identities, and the way we think ultimately make our teams stronger and more innovative. At Apple, we work every day to create an inclusive, safe, and supportive environment for all our team members. We’re always finding new ways to invest in our teams’ development and to encourage collaboration and creativity. And we provide strong and comprehensive benefits and competitive compensation. We believe we’re a better and more innovative company when people have support and the opportunity to be their best selves. Our approach With over 165,000 team members* around the world, our people are at the heart of everything we do. From their first day, Apple team members have the resources and opportunities to build new skill sets, pursue new passions, and feel supported and cared for at work and beyond. Our People team supports our overall employee experience — from hiring to retaining our talented team members — through our inclusive culture, learning opportunities, compensation, and benefits. The team is led by Deirdre O’Brien, Senior Vice President of Retail + People, reporting to CEO Tim Cook. Deirdre works with the People team to help Apple connect with, develop, and care for team members — and to help everyone do the best work of their lives. A safe environment is also integral to unlocking the potential of all of our team members. And our commitment to environment, health, and safety (EHS) extends to contractors, customers, and communities as well. We’re working hard to make sure our people are safe no matter where they are when they’re conducting business for Apple. We have procedures in place to identify and mitigate possible hazards, and we’re prepared to respond to any crises that may arise. Our Senior Vice President and Chief Financial Officer (CFO) Luca Maestri oversees Apple’s EHS program, which is driven by an expert leadership team. We have robust workplace policies and practices, including our Business Conduct Policy, Human Rights Policy, and EHS Policy, that articulate our strong commitment to our people and to creating an environment where they can do their best work. Accountability measures across the company allow us to track progress and build a foundation for lasting and durable change. We’re listening to employee feedback, amplifying underrepresented voices, and taking action to meet our teams’ needs. From hiring to development and engagement, we’re making sure every part of Apple is increasing inclusion and representation. Senior leaders now have access to data that helps them assess how well they’re driving diversity within their teams and organizations. We’re building inclusion and diversity measures into our annual review process to create consistency in how we drive and track progress. In the last year, we completed comprehensive data reviews with executive leadership and organizational action plans within every line of business. *As of December 2021 Appendix Governance Communities Suppliers Customers Our P eople Environment Introduction Apple’s 2022 ESG Report 23
Inclusive representation To create products for everyone in the world, we need a workforce with diverse backgrounds and experiences. We’re making continuous progress in building an Apple community that represents the diverse and ever-changing world we live in. And we’re committed to far more. We’re making progress in increasing representation, and currently 50 percent of our workforce in the U.S. is made up of people from underrepresented communities. With more than 165,000 employees globally, even a 1 percent improvement impacts a substantial number of people, and increasing overall representation requires focus to drive progress. Please see the Appendix on page 81 for more data on representation across our workforce. Additionally, more than half of our Board identify as women and/or members of Asian, Black, Hispanic/Latinx, LGBTQ+, and veterans communities. And women hold half of our Board and committee leadership positions. Read more on page 6 of our 2022 Proxy Statement . Inclusive hiring We’ve built inclusion and diversity measures into our candidate assessment framework. And we continue to make progress toward our goal of having more diverse interview panels and candidates so that diversity is reflected at every stage of the hiring process. We’re making sure everyone involved in the hiring process has access to the information and resources they need to develop inclusive interviewing skills. All of our hiring managers and recruiters receive training in inclusive hiring practices. Our recruiters also receive training on how to continuously drive meaningful conversations with hiring managers to help implement these hiring practices with every role. These trainings help mitigate inherent biases and create more consistent hiring experiences for all. We’re working to accelerate progress through our diversity recruiting and hiring efforts across Apple, with a focus on technical, engineering, and leadership roles. We’re expanding our diversity outreach efforts, including our ties with Historically Black Colleges and Universities (HBCUs), Hispanic-Serving Institutions (HSIs), and other organizations that serve and engage talent from underrepresented communities. Beyond our own operations, we’re partnering to challenge systemic bias through initiatives like REJI ( page 60 ), Entrepreneur Camp ( page 64), Impact Accelerator ( page 18 ), Apple Developer Academy ( page 63 ), work with Historically Black Colleges and Universities (HBCUs) and HSIs ( page 60 ), as well as our responsible procurement work ( page 45 ). Data is for the 2021 calendar year. Continuing to increase Black and Hispanic/Latinx team members Over the past year, we hired more Black and Hispanic/Latinx team members in the U.S. than ever before. Additionally, in the open positions we filled during this time period, representation of these communities was the highest ever in corporate and retail roles filled in the U.S. 13% Open U.S. leadership roles filled by Black candidates 12% Open U.S. leadership roles filled by Hispanic/Latinx candidates 23% Open U.S. retail leadership roles filled by Black candidates 18% Open U.S. retail leadership roles filled by Hispanic/Latinx candidates 47% Open leadership roles filled by women globally 34% Open R&D leadership roles filled by women globally 59% Open leadership roles filled by people from URCs in the U.S 38% Open R&D leadership roles filled by people from URCs in the U.S Progress in retail 58% Open retail leadership roles globally filled by women 76% Open retail leadership roles in the U.S. filled by people from URCs More inclusive leadership Compared to the previous year, open leadership* roles filled by women globally increased by 10 percentage points overall, and by 8 percentage points in R&D. And in the U.S., open leadership roles filled by people from underrepresented communities (URCs)** increased by 16 percentage points overall, and by 9 percentage points in R&D. * Leadership roles include managers at all levels of our company. ** URCs: Groups whose representation in tech has been historically low — Female, Black, Hispanic/Latinx, Multiracial, and Indigenous peoples. Data is for the 2021 calendar year. Appendix Governance Communities Suppliers Customers Our P eople Environment Introduction Apple’s 2022 ESG Report 24
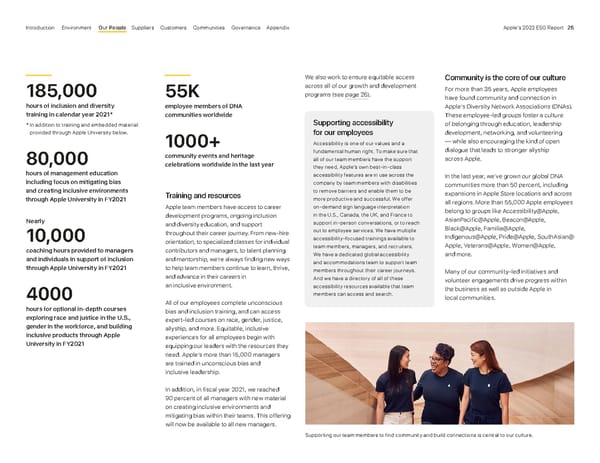
Training and resources Apple team members have access to career development programs, ongoing inclusion and diversity education, and support throughout their career journey. From new-hire orientation, to specialized classes for individual contributors and managers, to talent planning and mentorship, we’re always finding new ways to help team members continue to learn, thrive, and advance in their careers in an inclusive environment. All of our employees complete unconscious bias and inclusion training, and can access expert-led courses on race, gender, justice, allyship, and more. Equitable, inclusive experiences for all employees begin with equipping our leaders with the resources they need. Apple’s more than 15,000 managers are trained in unconscious bias and inclusive leadership. In addition, in fiscal year 2021, we reached 90 percent of all managers with new material on creating inclusive environments and mitigating bias within their teams. This offering will now be available to all new managers. We also work to ensure equitable access across all of our growth and development programs (see page 26 ). Nearly 10,000 coaching hours provided to managers and individuals in support of inclusion through Apple University in FY2021 4000 hours for optional in-depth courses exploring race and justice in the U.S., gender in the workforce, and building inclusive products through Apple University in FY2021 185,000 hours of inclusion and diversity training in calendar year 2021* * In addition to training and embedded material provided through Apple University below. 80,000 hours of management education including focus on mitigating bias and creating inclusive environments through Apple University in FY2021 55K employee members of DNA communities worldwide 1000+ community events and heritage celebrations worldwide in the last year Supporting accessibility for our employees Accessibility is one of our values and a fundamental human right. To make sure that all of our team members have the support they need, Apple’s own best-in-class accessibility features are in use across the company by team members with disabilities to remove barriers and enable them to be more productive and successful. We offer on-demand sign language interpretation in the U.S., Canada, the UK, and France to support in-person conversations, or to reach out to employee services. We have multiple accessibility-focused trainings available to team members, managers, and recruiters. We have a dedicated global accessibility and accommodations team to support team members throughout their career journeys. And we have a directory of all of these accessibility resources available that team members can access and search. Supporting our team members to find community and build connections is central to our culture. Community is the core of our culture For more than 35 years, Apple employees have found community and connection in Apple’s Diversity Network Associations (DNAs). These employee -led groups foster a culture of belonging through education, leadership development, networking, and volunteering — while also encouraging the kind of open dialogue that leads to stronger allyship across Apple. In the last year, we’ve grown our global DNA communities more than 50 percent, including expansions in Apple Store locations and across all regions. More than 55,000 Apple employees belong to groups like Accessibility@Apple, AsianPacific@Apple, Beacon@Apple, Black@Apple, Familia@Apple, Indigenous@Apple, Pride@Apple, SouthAsian@ Apple, Veterans@Apple, Women@Apple, and more. Many of our community-led initiatives and volunteer engagements drive progress within the business as well as outside Apple in local communities. Appendix Governance Communities Suppliers Customers Our P eople Environment Introduction Apple’s 2022 ESG Report 25
Growth and development We want everyone to flourish in their time at Apple, whether in their current role or their next career opportunity. We offer many different paths to career fulfillment, and we continue to take new steps to ensure that everyone at Apple has the opportunity to find support to grow and develop. Across Apple, our managers and leaders help our team members progress, creating development pathways that enable individuals to learn, improve, and empower their colleagues to do the best work of their lives. We provide a growth and development framework and tools — including planning worksheets, manager toolkits, and a dedicated internal web page — that team members can use to create individual plans to shape their careers and identify their goals. We encourage our team members to discover new opportunities and roles listed on our internal career site, and for many roles and lines of business, we provide detailed profiles of the skills required to be successful. We help ensure an end-to-end selection process that is clear and equitable for all, and we encourage regular discussions with managers about team members’ growth and development goals at Apple. In addition to our company-wide programs and initiatives, a significant amount of learning happens within teams because of our unique functional structure. Our leaders are experts in their fields and thus guide their teams of experts to further deepen very specific knowledge and skill sets. We also support team members through formal education and career development initiatives, including: Apple University: Apple University began in 2010 with a simple mission — to foster understanding and critical thinking about Apple’s culture, organization, and values. Apple University offers original classes, tools, and resources across a distinctive range of topics to help employees learn to lead and explore important topics like fairness and justice. All employees have access to Apple University, and to date, more than 95 percent of executives and managers and nearly 60 percent of individual contributors have participated in classes. In fiscal year 2021, team members spent more than 175,000 hours participating in all Apple University courses combined. Educational Assistance Program: Our Educational Assistance Program offers tuition reimbursement for team members to continue their education. Apple Mentorship Program: Our new mentorship program creates opportunities for Apple employees of all backgrounds to learn from one another and grow their careers at Apple. After successful pilot programs in the U.S. and the UK, we’re continuing to expand the program globally, pairing a greater number of experienced Apple mentors with future leaders from across the company. Retail-specific training: Through onboarding training, new Apple Retail employees learn the fundamental knowledge and skills that will support their success at Apple. Ongoing training opportunities cover Apple culture and values, products and services, systems, processes, and customer engagement skills. Across Apple, our managers and leaders help our team members to learn, improve, and do the best work of their lives. Career Experience: Career Experiences enable temporary, hands-on development opportunities for Apple Store, service, and support team members by creating short- term rotations in technical, operations, and corporate functions across Apple. Participants build new skills, explore an aspirational role up close, and gain in-role experience, while host teams benefit from the unique customer- facing perspectives, talents, and passions of participants. The program is currently available in 11 locations in every geographic region, with more countries being added each year, and 96% of Apple’s lines of business participate. 175,000 training hours in Apple University in FY2021 Appendix Governance Communities Suppliers Customers Our P eople Environment Introduction Apple’s 2022 ESG Report 26
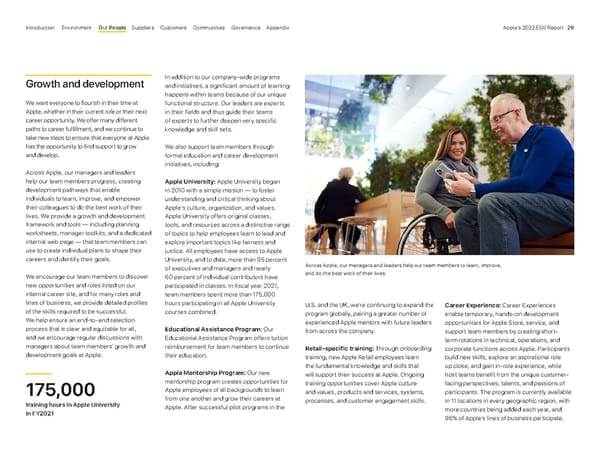
Rotational programs: We also have a number of programs for new graduates to learn through a combination of training and on-the-job work experience. Over a two-year period, participants rotate through multiple teams to gain a breadth of experience and exposure to various projects to help discover their strengths and passion. Upon successful completion of the program, participants will often transition into a non-rotating role within Apple. Our Services, Finance, Operations, and AI/ML functions all offer these types of programs. Performance reviews Our annual performance review process offers team members the opportunity to have meaningful conversations with their managers about their performance, growth, and development. Across Apple, employees receive an annual performance review, and retail team members are supported by monthly performance conversations to align on their progress. Performance reviews focus on three categories: teamwork, innovation, and results, and they include a self-assessment and feedback from peers and the team member’s manager. The performance review is also a chance to reflect on the contribution each person makes to Apple’s long-standing commitment to inclusion and diversity. Benefits We recognize that our people thrive when they have the resources to meet their needs and the time and support to succeed in their professional and personal lives. We provide a host of benefits for corporate and retail employees to help our teams live healthier, more fulfilled, and happier lives at work and beyond. 15 We regularly review and update the benefits that we offer in order to respond to our employees’ changing needs. For example, we recently expanded family care services and mental health benefits, including 15 free counseling sessions through our Employee Assistance Program, to help employees care for themselves and their loved ones through the pandemic. And in the U.S., we now offer part-time team members new vacation and sick leave days, New Parent Leave, Gradual Return to Work, Paid Family Care, and Emergency Backup Care, and in 2022, we enhanced sick leave benefits and a new accelerated vacation accrual schedule for full-time employees in our U.S. Apple Store locations. Physical and mental well-being Apple provides employees with a wide variety of health-related benefits, including: • Physical and mental health coverage that also extends to spouses and domestic partners • Virtual and onsite wellness visits for employees and eligible dependents • Free, confidential counseling for employees and their dependents 16 • Comprehensive reproductive health services 17 • Expert second opinion resources to help employees and their family members make informed healthcare decisions Every year, our performance review process helps team members have meaningful conversations with their managers. Appendix Governance Communities Suppliers Customers Our P eople Environment Introduction Apple’s 2022 ESG Report 27
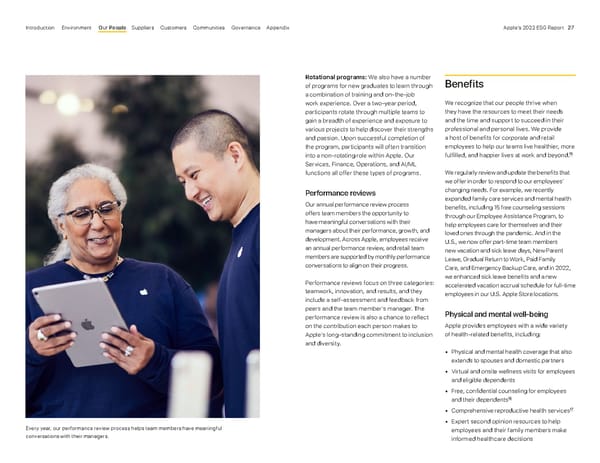
• A comprehensive mental health and well-being hub where employees can find events, apps, and other resources • Month-long wellness events for team members across Apple to support one another and build healthier habits Our health plans are designed to support the various life stages of our employees and their families. They are transgender inclusive, where legally and plan allowed, and support routine care, therapies, and other medically necessary surgeries. Life and family Apple also provides a number of benefits to support our employees in their personal and family life, including: • Retirement programs to help employees with their future financial needs, such as 401(k) matching contributions in the U.S. and local retirement plans for employees outside of the U.S. • Referrals and resources for childcare, which includes backup care in the U.S., as well as before- and after-school programs, programs for children with special needs, and more • Consultations and referrals to support employees caring for an elderly family member • Adoption, surrogacy, and fertility services • Financial coaching services • Tuition reimbursement • Legal services for adoption, child support, housing, wills, identity theft, and more Coming back to work after the arrival of a child can be a big adjustment for employees, so to smooth the transition period following the arrival of a new family member, our gradual return- to-work program allows employees to choose to return half-time at full pay for four weeks — whether they’re welcoming a child through birth, adoption, or other covered means. Time away Taking the time to recharge is an important part of employee health and well-being. We provide a wide variety of time-away options for our employees, including: • Vacation • Paid sick time and medical leave for serious health conditions 18 • Pregnancy leave and New Parent Leave 19 • Leave for bereavement or to care for a sick family member • Time off for voting, jury duty, and other civil obligations • Company holidays throughout the year Product discounts Apple’s Employee Purchase Plan offers special pricing on most Apple products. We offer substantial discounts on hardware, software, and accessories for employees, families, and friends — as well as an additional credit that can be used to purchase a Mac, iPad, or unlocked iPhone once every two years. Compensation We believe that our compensation should not only be highly competitive across all types of roles, levels, and talent markets; it should be equitable and enable all team members to share in the company’s success as shareholders of Apple. We’re committed to being a leader in pay equity, providing all employees with annual opportunities for stock ownership in the company, and offering highly competitive pay that’s in the top tier of each local market. And we hold our leaders accountable by incorporating Apple values and key community initiatives into our executive short-term incentive plan. Competitive pay Apple is committed to remaining a market leader in compensation through our highly competitive and equitable programs. In addition to our stock program and wide range of benefits we provide, we regularly review our competitive position to establish our leading starting pay rates in each local market. Apple stock ownership In 2015, we introduced our Stock Ownership Program, which was designed to reach employees who were not previously eligible for restricted stock unit (RSU) awards, including all of our retail and AppleCare teams. By the end of 2022, over $1.1 billion of RSU grants will have been awarded under this program, and the shares underlying the RSUs today would have an estimated value of over $3 billion (based on a share price of $130.06 as of June 16, 2022). Apple is one of the few companies in the S&P 500, and the largest technology company, in which employees at all levels are eligible for RSU grants on an annual basis. In 2021, 150,000 employees were eligible for RSU grants and our Compensation Committee approved grants for 99% of those eligible. In most countries, employees also get discounts when purchasing Apple stock by participating in the Employee Stock Purchase Plan (ESPP). Currently, 81 percent of eligible employees participate in the ESPP. ESG Modifier Beginning in 2021, the Compensation Committee incorporated the ESG Modifier into the Executive annual cash incentive program. The ESG Modifier is based on a holistic evaluation by the Compensation Committee of key accomplishments and actions taken during the year to advance our Apple values: accessibility, education, environment, inclusion and diversity, privacy, and supplier responsibility, and key community initiatives which were chosen because they represent long-standing, business-relevant environmental, social, and governance principles that reflect Apple’s commitment to promoting values-driven leadership. Pay equity Since 2017, Apple has achieved and maintained gender pay equity for our employees worldwide. In the U.S., we’ve also achieved pay equity with respect to race and ethnicity — as well as pay equity at the intersections of race and ethnicity with gender.* In addition to our pay equity commitment, our Inclusion and Diversity program (see page 23 ) supports growth, development, and engagement for team members of all backgrounds. We have a number of practices in place to support our commitment to pay equity, including: * Pay equity at the intersections of race and ethnicity with gender was achieved in 2022. Appendix Governance Communities Suppliers Customers Our P eople Environment Introduction Apple’s 2022 ESG Report 28
We encourage open and honest communication among team members, managers, and leadership as we seek to build a better work environment for all. Another way team members can let us know how Apple is doing is to participate in surveys that we conduct regularly. These survey results are a great way for us to learn about what’s going well and how we can do better in areas like career development, manager performance, and inclusivity, and teams are encouraged to create action plans based on the survey results. We conduct annual surveys for all Apple Store and AppleCare team members to listen to their views on topics like leadership, management, career development, performance, values, culture, and work environment. And leaders from each organization use the survey insights to take steps to better support team members where they need it. Over the last two years in particular, we focused on listening to Apple Store and AppleCare employees as they were interacting most directly with customers during the pandemic and experiencing rapid change in how they worked to support those customers. For our early 2022 surveys, 76 percent of Apple Store team members and 73 percent of AppleCare team members participated. Annual compensation planning: During our annual compensation planning process, the People team uses analytics to assess promotion rates, performance ratings distribution, and pay metrics for women compared to men and, in the U.S., for underrepresented groups compared to non-underrepresented groups. Global compensation history policy: We don’t ask candidates for salary history during the recruiting process, which has been our policy globally since 2019. Our recruiters develop offers of employment based on the compensation of current Apple employees in similar roles using a tool developed specifically for this purpose. Engagement At Apple, we believe that open and honest communication among team members, managers, and leaders helps create an open, collaborative work environment where everyone can contribute, grow, and succeed. Across all our teams, we’re always building on our long-standing commitment to creating an environment where people at every level of the company feel connected and supported. Our goal is to listen and learn — and to use those lessons to build an even better workplace for all. If team members have questions, feedback, or concerns, they’re encouraged to share them with their manager. If a team member is ever uncomfortable raising a particular issue with their manager, they can discuss it with any manager at Apple, their People Business Partner, People Support, or they can contact the Business Conduct team. Pay equity at Apple Our pay equity review is global and covers 100 percent of our employees. We consider total compensation, including base salary, bonus, and stock. 1:1 gender pay equity globally 1:1 pay equity in the U.S. by race and ethnicity 1:1 gender pay equity in every country 1:1 pay equity in the U.S. at the intersections of race and ethnicity and gender Annual pay equity review: To maintain pay equity, we engage an independent third-party expert to build and run statistical models to assess and resolve any differences in total compensation on the basis of gender and, in the U.S., on the basis of race and ethnicity and at the intersections with gender. Job assessments: Apple’s dedicated compensation team regularly conducts comprehensive job title reviews to ensure that employees are in the correct job title, which is an important factor in determining pay. We also continuously analyze market data to ensure that compensation guidelines for all roles remain competitive. Empowering employees to support the causes they care about Our Employee Giving program provides opportunities for employees to contribute to the causes they care deeply about with the support of Apple. From volunteering to donations to smaller individual actions, Apple is committed to giving, hand in hand with our team members. Read more on page 67 . Apple has a no-retaliation policy. Retaliation against anyone who comes forward with a concern or participates in an investigation is grounds for termination. We respect each team member’s right to form or join (or refrain from joining) organizations of their choice in a lawful manner without discrimination, retaliation, or harassment. Appendix Governance Communities Suppliers Customers Our P eople Environment Introduction Apple’s 2022 ESG Report 29
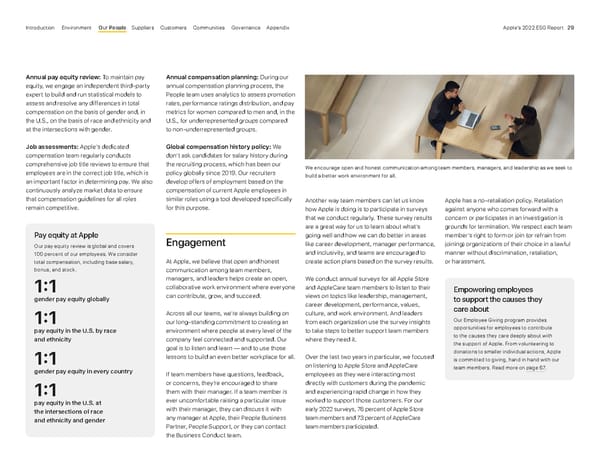
Workplace practices and policies Apple’s culture is built on treating everyone with dignity and respect, and this focus shapes how our colleagues engage with one another and with our customers and partners around the world. We’re also committed to respecting our team members’ rights as set out in our Human Rights Policy . Equal employment opportunity Apple is an equal opportunity employer committed to inclusion and diversity. We take steps to provide equal opportunity for all applicants and employees, without regard to race, color, ancestry, national origin, caste, religion, creed, age (over 40), mental and physical disability, sex, gender (including pregnancy, childbirth, breastfeeding, or related medical conditions), sexual orientation, gender identity or expression, medical condition, genetic information, marital status, military or protected Veteran status, an employee’s reproductive health decisions or those of their dependents, or on any other basis protected by law. We provide reasonable accommodations to applicants and employees with physical and mental disabilities. Harassment and discrimination We are committed to providing a workplace free of harassment or discrimination based on race, color, ancestry, national origin, caste, sex, gender (including pregnancy, childbirth, breastfeeding, or related medical conditions), sexual orientation, gender identity or expression, religion, creed, age (over 40), mental and physical disability, medical condition, genetic information, marital status, or military or protected Veteran status, or on any other basis protected by law. We do not tolerate discrimination or harassment of our employees or those with whom we have a business, service, or professional relationship (including customers), nor do we tolerate workplace violence of any kind. Retaliation against anyone for complaining about harassment or discrimination, or for participating in the investigation of a complaint of harassment or discrimination, is against Apple policy and will not be tolerated at Apple. Voluntary decision review Apple’s voluntary decision review enables employees to have an employment decision reevaluated. This is designed to promote fairness and impartiality, in line with our values and policies. The reviewer will consider any new information that indicates the decision may not have been in accordance with our policies and guidelines. Non-employees and temporary workers In addition to our full-time employees, temporary workers, and vendor services play an important role on our team. Our temporary workers generally perform similar work as our full-time employees, as they are intended to augment the Apple employee workforce under a short to mid-term assignment. Approximately 6 percent of our U.S. corporate workforce were temporary workers as of October 2021. Temporary workers have the same opportunity to be considered as all other applicants to any Apple job posting whether that opportunity is a conversion of their current role or a role they found on our job site. And in our retail business, we have a strong record of hiring temporary workers as full- and part-time employees. Our outsourced services with workers provided via vendors generally perform work that can be different from that performed by our permanent employees. This workforce is intended to support business needs where specific skills are required and the vendors have the ability to scale with our varied business needs. Pay and benefits: For vendor services, pay rates are managed by the vendor. Various benefits, including but not limited to healthcare, are offered to these workers through their employer or staffing agencies. Vendors are also accountable to Apple’s Supplier Code of Conduct, which requires that our staffing agencies are compliant with all current local and national legislation and employment laws, including wage and benefits requirements, for their employees (see page 37 or People and Environment in Our Supply Chain ). Raising concerns: In many cases there are multiple avenues for non-Apple workers to report problems anonymously, including internal processes with their employer and the Apple Business Conduct Helpline (see page 72). Performance: Vendor performance is reviewed and evaluated by the vendor management based on feedback sometimes received from Apple managers, Procurement, and/or Supplier Responsibility. Reporting a concern At Apple we believe strongly in a culture of open communication, mutual respect, and high ethical standards — and we strive to do the right thing. It can be stressful if something at Apple has a negative effect on well-being, violates an Apple policy, or interferes with someone’s ability to do their best work. There are several ways team members can report a concern: Managers: Talking to a manager is a good place to start. A large part of their responsibility is to support their team members. If a team member is not comfortable bringing a concern to their manager, they can discuss it with any manager at Apple. People Support: This dedicated team specializes in supporting Apple team members with work-related topics. They can answer questions, clarify a policy, or suggest resources or options to help resolve a problem. Business Conduct: Team members can contact the Business Conduct team via phone, email, or a third party. They will review the concern and share it with the appropriate internal partners. Read more on page 72 . People Business Partner: Team members can discuss the issue with their People Business Partner (PBP), particularly if it’s related to your team or organization. Team members are encouraged to raise their concerns in the way they feel most comfortable, internally or externally. In addition to the options above, they may also contact any of the government agencies or other external organizations that address employee and workplace concerns. Appendix Governance Communities Suppliers Customers Our P eople Environment Introduction Apple’s 2022 ESG Report 30
Protecting each other’s health At every stage of the pandemic, our first priority has always been the health of our teams, customers, and communities. That meant being one of the first companies to close our offices and retail stores, and finding innovative ways to connect with colleagues and customers virtually. Since 2020, we’ve continued our efforts and programs to support our people. We adopted CDC recommendations around up-to-date vaccinations, including booster doses. Apple also continued to pay our teams during temporary store and office closures, expanded our paid leave policies, and enhanced our policies and procedures for a safe work environment — both in the office and in-store. To keep our teams informed, we deployed comprehensive resources with up-to-date COVID-19 information, including a dedicated platform for teams returning to the office. COVID-19 case support, implemented for all team members, included return-to-work guidance and contact tracing, with the utmost regard for employee privacy. We continue to offer special sick leave for employees with possible COVID-19 symptoms, as well as comprehensive health coverage. To continue to manage our response going forward, we created a dedicated pandemic response team in 2022 in addition to the cross-functional team that has been supporting and guiding our COVID response. The new response team will support future pandemic planning and response. Innovating to support our customers Despite all of the pandemic’s challenges, we brought our hardware, software, and services into customers’ hands, helping them stay informed, connected, and entertained. We also tailored our services to promote easy access to trusted information on COVID-19: launching a dedicated section on Apple News; prioritizing visibility of essential services locations — including COVID-19 testing and vaccination locations — on Apple Maps; offering a curated collection of telehealth apps on the App Store; and leveraging Siri to provide the latest COVID-19 guidance. To meet the extraordinary challenges of virtual education, we delivered new content and services for students, parents, and teachers to foster creativity and learning in a digital environment. We worked with mobile carriers and school administrators to deliver iPad devices with cellular support for students in need. With our Apple Card Customer Assistance Program, we also offered customers the option to skip their monthly payments without incurring interest. Across many of our Apple Store locations, we were able to serve our customers’ needs through contactless pickup, express storefronts, and new online support. Our response to COVID-19 is still ongoing, and we’re committed to implementing health protocols and adjusting store operations as required based on available data and guidance from health officials. Apple’s COVID-19 response The health of our teams, customers, and communities continues to be our first priority. Appendix Governance Communities Suppliers Customers Our P eople Environment Introduction Apple’s 2022 ESG Report 31
Supporting people in our supply chain We are continuing to work together with our suppliers to help them ensure that every necessary precaution is taken to keep people safe at work. In 2020, we introduced an enhancement to our Code and Standards specifically addressing Infectious Disease Preparedness and Response (IDPR). IDPR contains a set of new requirements resulting from our learnings during the pandemic, which will help our suppliers better prepare for and be ready to respond to an infectious disease outbreak at their facility. As part of the rollout of IDPR in fiscal year 2021, we conducted more than 200 onsite and remote specialized assessments to verify suppliers’ compliance with COVID-19 control protocols in order to drive improvement when necessary. We also continue to assess any existing gaps at supplier facilities, and identify opportunities to work with those in higher-risk areas to help make their facilities safer. This includes working with third-party suppliers to redesign and reconfigure factory floor plans where necessary, implementing flexible working hours to maximize interpersonal space, implementing enhanced deep cleaning protocols, and deploying masks and sanitizers. In fiscal year 2021, we also encouraged our suppliers’ employees to get vaccinated and boosted where available. We also partnered with NGOs to help further support supplier employees, as well as those working deeper in our supply chain, particularly those from vulnerable groups. We worked with the International Organization for Migration (IOM) — the world’s leading organization providing services to migrant workers — to provide support to migrant workers impacted by the pandemic. With support from Apple, our long-time partner Pact, an international development organization, prepared and coordinated activities to prevent the spread of COVID-19 in several mining communities in the Democratic Republic of the Congo (DRC). The initiative has reached more than 50,000 people through individual and group dialogues on COVID-19 prevention since the program began in December 2020. Giving back to our communities Apple’s company-wide response to the COVID-19 pandemic involved teams across the business, including product design, engineering, operations, packaging teams, suppliers, and more. At the beginning of the pandemic, when personal protective equipment was in short supply, we sourced through our supply chain and donated more than 30 million masks for healthcare workers worldwide. We also launched a company-wide effort to produce and ship over 10 million face shields. These face shields were delivered to sites around the world, from New York Presbyterian Hospital in the U.S. to the Ministry of Health in Zambia. Additionally, we have also donated over $10 million to the World Health Organization’s COVID-19 Solidarity Response Fund. We also matched employee donations two-to-one to support COVID-19 response efforts worldwide. We awarded $10 million from our Advanced Manufacturing Fund to COPAN diagnostics, a market leader in sample collection kits, that rapidly accelerated their ability to supply sample collection kits to hospitals in the U.S. for COVID-19 testing. And our partnership with Product (RED) also supported COVID-19 response (see page 65 ). Collaboration with our suppliers helps them make sure they’re taking every necessary precaution to keep people safe at work. In partnership with the White House Coronavirus Task Force and the CDC, we released an app and a website that guided Americans through a series of questions about their health and exposure to determine if they should seek care for COVID-19 symptoms, providing CDC recommendations on next steps, including guidance on social distancing and self -isolating, how to closely monitor symptoms, recommendations on testing, and when to contact a medical provider. And we collaborated with Google to create a new exposure notification system for global governments and health agencies, with user privacy and security central to its design, to help fight the pandemic. Appendix Governance Communities Suppliers Customers Our P eople Environment Introduction Apple’s 2022 ESG Report 32
Health and safety at Apple We’re dedicated to protecting our team members and our customers everywhere we operate — a responsibility COVID-19 has brought into even greater focus. At every stage of the pandemic, we’ve made decisions based on the latest local data and public health guidance, and we share lessons across our Environment, Health, and Safety (EHS) teams globally so we can continuously improve our safety programs. Protecting our people We’re always working hard to make sure our workers are safe no matter where they are when they’re conducting business for Apple. We abide by EHS requirements in every country where we operate and are dedicated to doing everything we can to support the safety and well-being of our global teams. Managing work-related hazards and risks To help ensure the safety of our workers and customers, we put procedures in place to identify workplace risks and mitigate possible hazards. We support and protect employees in lower hazard spaces, and we put risk- specific programs in place for those working in higher hazard environments, including safe systems of work, chemical management, laser safety, equipment and machinery safety, hazardous materials management, and electrical safety. Employees can request to have their workspaces individually inspected to review hazards and controls, including ergonomics evaluations. Apple implements a hierarchy of control for significant risks, which centers on elimination, substitution, engineering controls, administrative controls, and personal protective equipment (PPE). As one example, Apple EHS regularly assesses hazards at our research labs based on their chemical, equipment, laser, and other hazards. Approximately 9 percent of our labs are considered “complex,” meaning that they contain high-hazard processes and equipment. These assessments help teams understand which EHS programs and controls must be put in place to mitigate risks. In 2021, Apple completed hazard assessments in over 2500 research labs globally. Our EHS teams identify and provide team members with appropriate PPE for specific hazards. This PPE is provided at no cost and with training on correct use. For example, our hearing conservation programs include evaluation and control of occupational exposures to noise, and hearing protection is available for processes, areas, and tasks with potential high noise exposures. Additionally, EHS conducts mandatory health checks for employees where they’re needed. We invest in new technologies as we continue to manage potential risks across our operations, including our Apple-owned manufacturing sites. Our standards, programs, trainings, procedures, and other safeguards are managed by trained EHS professionals, and where required, we also translate EHS procedures into local languages for our team members. Risks identified from incidents, injuries, and non-routine events are addressed expeditiously to identify and implement appropriate corrective and preventative actions, and we integrate our learnings into future program development and training. Lessons learned are routinely communicated across Apple’s EHS team and potentially affected operations, and they are used to inform updates to existing policies and procedures. Employees and managers can report incidents, near-misses, and observations — including newly identified hazards and risks—through an internal iOS app. Incident responses are addressed by Apple’s EHS team through a consistent process that connects employees with care and support, while identifying corrective actions where appropriate to prevent future occurrences. Waste management Apple is committed to minimizing resource use and the associated generation of non- hazardous or hazardous waste. Where possible, Apple implements a waste hierarchy of prevention, waste reduction at the source, reuse of materials, recycling, energy recovery, and landfilling as a last resort. We maintain our commitment to the safe and responsible management of hazardous waste, both onsite and offsite. Any facility that does not meet our requirements is replaced by another approved waste management facility. We made progress in 2021 at sites around the world: U.S.: Thirteen of the Treatment, Storage, and Disposal Facilities (TSDFs) we utilize in the U.S. were audited in 2021 to confirm that the waste is treated, recycled, or incinerated within the governing safety standards for health and the environment. Eight disposal facility reviews were completed by vendors under Apple management, and we reviewed five other sites via third-party audit reports. At one of our major research labs in Santa Clara Valley, the empty container management program resulted in a 3 percent reduction of lab debris for hazardous waste streams. United Kingdom: Through an internal initiative to further strengthen waste management, product site-specific waste initiatives achieved a 97 percent diversion from landfill and a 0.4 tonnes of waste/1002, both exceeding requirements. Ireland: The Cork Campus is ECVP 2799 Zero Waste to Landfill Certified annually and has had no material landfilled in the past five years. Ergonomics In 2021, we continued to support our global team members working from home office, Apple office, and non-office settings. The Apple ergonomics program is heavily focused on preventative measures to reduce the risk of work-related musculoskeletal disorders (WMSDs). This includes ergonomics training sessions for our team members and providing input into the purchase or design of work equipment, systems, and facilities to ensure that they meet ergonomic standards to provide the best levels of efficiency, comfort, health, and safety for anyone using them. Our Appendix Governance Communities Suppliers Customers Our P eople Environment Introduction Apple’s 2022 ESG Report 33
ergonomics trainings and self-assessment support are aimed at creating an awareness of ergonomic risk factors for WMSDs, how to prevent them, and how to proactively request for adjustments to workstations. We completed over 10,000 individual support requests for our team members working from home, along with those who returned to Apple offices and Apple Store locations. Support included tailored guidance and feedback, equipment recommendations, and 1:1 virtual or in-person assessments. In addition, over 3000 employees participated in various training sessions. Our industrial, warehouse, and other non- office operations teams were supported with approximately 400 ergonomic risk assessments and 76 lab screenings. The assessments evaluated risk factors such as repetition, force, posture, and duration, while reviewing the interaction of the team member with new machines, equipment, work processes, and workspaces. Emergency preparedness and response Beyond COVID-19, we supported the response to dozens of crisis events in 2021, including fires, severe weather, and civil unrest. Our responses focused on the safety of our employees and business continuity. We activated 31 crisis management teams (CMTs) to manage the most severe events, and 120 additional incidents were supported without full CMTs. All team members can sign up for Apple’s Emergency Alert system, enabling them to be notified of local emergencies and to indicate whether they are safe or need help. Disaster supplies are available at our facilities. All Apple campuses with over 1000 employees have Facility Response and Recovery Plans, which provide a comprehensive approach to the safety and support of our employees while minimizing business interruption. Site-specific Emergency Response Plans have been implemented globally. These plans are communicated to all employees, and trainings and drills are held at least annually. And our employees are trained in emergency response, allowing them to react quickly while supporting the safety of our team members and customers. In 2021, we completed over 200 emergency response drills, which were supported by 2700 trained Emergency Response Team (ERT) members. We expect to increase the frequency of these drills, depending on COVID-19 restrictions. With the care and support of our employees and customers in mind, we deployed Automatic External Defibrillator (AED) stations across our global retail stores in 2021. And to ensure that our team members could effectively use this new tool, we provided AED training for our team members. All campuses and key sites have disaster supplies to match localized risks. As Apple’s footprint grows, sites are evaluated and supplies are added as needed. As one example, in 2021, we launched earthquake preparedness campaigns for employees across the western United States and Japan. We conducted outreach to provide employees with information, tools, and resources, and we held drills in some offices. We’re always working hard to make sure our workers are safe no matter where they are when they’re conducting business for Apple. Appendix Governance Communities Suppliers Customers Our P eople Environment Introduction Apple’s 2022 ESG Report 34
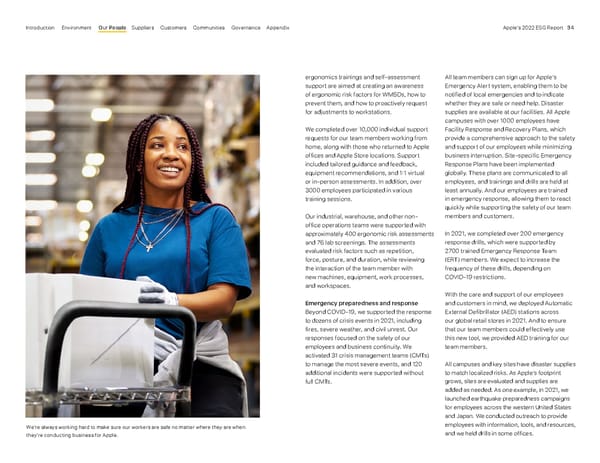
EHS management systems To provide a safe and sustainable environment for our teams, our EHS programs are built to share information about risks, requirements, and expectations for all workers. Our EHS policy outlines our commitment to workplace safety and environmental stewardship, and it establishes the principles that integrate effective EHS practices into all aspects of our business. The EHS policy is communicated through mandatory training for all new employees and through our internal EHS website. Apple’s EHS leadership team, including Apple’s EHS director, is responsible for establishing priorities, determining annual work plans, and assigning resources to implement high-quality services in all geographies where we operate. Certifications Our operations in Cork, Ireland, are certified to ISO14001, an international standard for environmental management systems. And Apple’s Taiwan Technology Center is certified to ISO45001 for occupational health and safety management systems, and working toward ISO14001 certifications in 2022. Inspections Our EHS inspections serve to both identify potential safety hazards and ensure that we’re following our internal processes to mitigate them. To support this work, Apple formalized our existing inspections program by launching enterprise-wide software, which allows users to create mobile inspections and then carry out inspections and safety compliance audits. The tool also captures observations, findings, and corrective actions. Our inspections tool was deployed globally to 1050 users across various retail and corporate locations, including Apple Store locations, general office spaces, R&D labs, kitchens and cafés, data centers, construction sites, and laser labs. Training In 2021, Apple employees completed 68,249 hours of safety training. Apple currently offers 304 safety courses or trainings to our employees. Our EHS management systems are designed to provide a safe environment for teams across Apple. Appendix Governance Communities Suppliers Customers Our P eople Environment Introduction Apple’s 2022 ESG Report 35
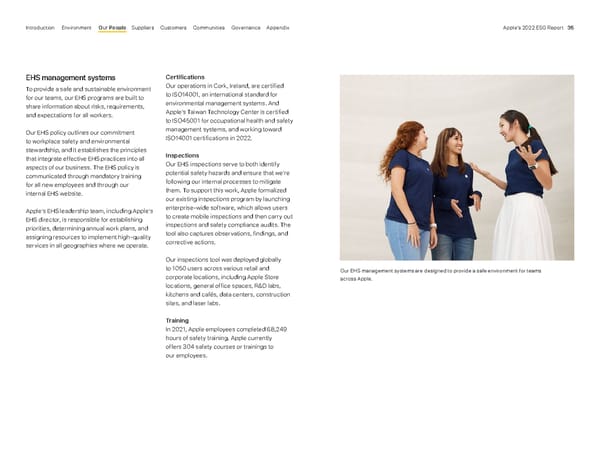
Suppliers In this section Our approach 37 Labor and human rights in the supply chain 40 Health, safety, and wellness 43 Responsible materials sourcing 44 Education and professional development 45 Environment 46 Values that lead the way. Appendix Governance Communities Suppliers Customers Our People Environment Introduction Apple’s 2022 ESG Report 36
The Apple Supplier Code of Conduct and Supplier Responsibility Standards outline our requirements for our suppliers in the areas of labor and human rights, health and safety, environment, ethics, and management systems. Since 2005, the Code and Standards have been updated annually, are published on our website in 15 languages, and communicated to our suppliers. The requirements in our Supplier Code of Conduct and Supplier Responsibility Standards and the due diligence we conduct across our supply chain align with internationally recognized labor and human rights standards, including those of the International Labour Organization (ILO), the United Nations Guiding Principles on Business and Human Rights (UNGPs), the Organisation for Economic Co-operation and Development (OECD), as well as industry-leading health and safety organizations. People are at the center of everything we do and every decision we make. While the pandemic has changed some of the ways we do our work, our values remain the same. The partnerships we have cultivated over the years throughout our supply chain have allowed us to continue to make significant progress in upholding the highest standards of labor and human rights and worker health and safety, and make unprecedented achievements in climate action and the stewardship of natural resources. Yet, as proud as we are of our progress, we know each year and each achievement is just a stepping stone in our continuous pursuit of “better.” Learn more about Supplier Responsibility at Apple We publicly share our progress through a number of reports, available on our Supplier Responsibility site : 2022 Annual People and Environment in Our Supply Chain Progress Report How We Work with Suppliers Conflict Minerals Report Supplier List Smelter and Refiner List 2021 Efforts to Combat Human Trafficking and Slavery Our approach Our commitment to people and the planet extends across our supply chain — from manufacturing to services, and to the many places where our suppliers operate. We work closely with our suppliers to uphold the highest standards so that the people in our supply chain are safe and treated with respect, and the environment is protected everywhere that Apple products are made. Apple’s work in this space is led by Apple senior management. Sabih Khan is Apple’s Senior Vice President of Operations, reporting to COO Jeff Williams. Sabih is in charge of Apple’s global supply chain, product quality, and overseeing planning, procurement, manufacturing, logistics, and product fulfillment functions — the programs that support Apple’s Environment and Supply Chain Innovation work. The Operations team also supports Apple’s environmental initiatives by partnering with suppliers to propel green manufacturing, help conserve resources, and protect the planet. Holding ourselves and our suppliers to the highest standards As described on page 10 , our Human Rights Policy outlines how we treat everyone, including our customers, employees, business partners, and people at every level of our supply chain. We take a very broad view of our supply chain (see diagram on page 38 ) — and the responsibility that comes with it. We consider our supply chain to include everything that goes into designing, building, delivering, supporting, and recycling of Apple products, as well as our retail stores and all of the services and operations that are part of our supply chain ecosystem. Appendix Governance Communities Suppliers Customers Our People Environment Introduction Apple’s 2022 ESG Report 37
in the procurement and product development cycles. Since fiscal year 2020, 9 percent of prospective suppliers evaluated for Code- related risks have been prevented from entering our supply chain for being unable or unwilling to meet our Code and Standards. Once new suppliers are awarded Apple business, we begin the process of helping them quickly get up to speed on our requirements through our supplier onboarding process. In 2021, we expanded our onboarding process to engage new suppliers at an even earlier stage in their working relationship with Apple. We also extend our support to help prospective suppliers correct compliance issues found during the procurement process — even when the supplier is not awarded Apple’s business — at no cost to the participating companies. Since 2020, 68 percent of companies that were not awarded Apple business elected to join this voluntary program, helping to protect people and the planet beyond the reach of our business and supply chain. Supplier engagement and accountability We take a broad, comprehensive approach to engaging with our suppliers to confirm that our standards are met. One of the tools that we employ are assessments. Assessments, also known as audits, are one of several methods we use to measure compliance with our requirements. These independent, third-party assessments, which take place onsite at supplier facilities, provide a snapshot of a supplier’s performance. However, when combined with regular engagement with supplier teams, mandated reporting, and listening directly to hundreds of thousands of supplier employees about their workplace experiences, our rigorous supplier assessments provide a clear measure of their performance in upholding our Code and Standards. In the 2021 reporting period, 1177 assessments were conducted in 52 countries. This included 886 Code of Conduct assessments and 291 smelter and refiner assessments. 20 Since 2007, Apple-managed assessments have covered 94 percent of our direct manufacturing spend. The Apple Supply Chain 3 million+ people Thousands of businesses and facilities 52 countries Our People and Environment in Our Supply Chain Report (page 99) provides a detailed overview of progress in our supply chain, including efforts to identify, mitigate, prevent, and remedy human rights risks as outlined by the Business and Human Rights Due Diligence process set forth in the UNGPs. We work closely with many experts across Apple — from product and services designers to facility managers — to evaluate and update our Code and Standards annually to address emerging risks, incorporate new legal requirements and industry best practices, and reflect the needs of supplier employees in a dynamic operating environment. We engage with a range of stakeholders, including rights- holders, civil society organizations, academic experts, and program partners, to ensure that our Code and Standards reflect current internationally recognized labor, human rights, health and safety, and environmental standards. Upholding our values from the start We work across our business to implement our standards from the earliest stages of product design and development — from the suppliers we choose to work with, to the materials in our products, to the processes and equipment we use to make them. We take a comprehensive approach to identifying and mitigating risks early Design & engineering Logistics Primary materials Final assembly Retail stores Smelter & refiner Components Services Services Recycling A global network of people and businesses working together to build the best products in the world. Appendix Governance Communities Suppliers Customers Our People Environment Introduction Apple’s 2022 ESG Report 38
been taken to prevent a reoccurrence. We prohibit retaliation of any kind against supplier employees who participate in our assessments. Our goal is to work together with suppliers to help them improve their management systems, rather than to simply remove them from our supply chain without helping them correct the issues we have discovered. In the event that a supplier is unwilling or unable to improve their operations to meet our requirements, they risk removal from our supply chain. Since 2009, we have directed the removal of 24 manufacturing supplier facilities and 170 smelters and refiners from our supply chain for being unwilling or unable to sufficiently improve their operations to meet our requirements. Results of our assessments are detailed in our People and Environment in Our Supply Chain Report beginning on page 91. A responsibility that grows with our business As Apple’s business continues to grow and expand to new areas, we adapt our supplier engagement model accordingly. This includes continuing to expand our scope to conduct independent, third-party assessments of a growing number of suppliers that support our business outside of manufacturing. Last year, we increased our engagement and expanded the application of our Code and Standards to suppliers supporting newer areas of Apple’s business, including those that work with our content services like Apple TV+ and Apple Fitness+. Supplier employees at Final Assembly in the U.S. How we stay engaged with suppliers widely used by the industry. A total of 99 RBA VAP assessments were completed in fiscal year 2021 at Apple supplier sites. If we uncover non-compliance in the course of any assessment or engagement, we take prompt action so that suppliers not only correct and remedy the issue, but make meaningful, long-term changes to their systems and processes. We do this through a Corrective Action Plan (CAP), during which 30-, 60-, and 90-day check-ins with Apple are required. We then conduct our Corrective Action Verification (CAV) process to verify that all corrective actions have been successfully implemented, and necessary steps have Code of conduct assessments Specialized assessments Investigations Capability building Ongoing training Early engagement These assessments also include unannounced assessments and unannounced visits in response to workers’ grievances and allegations, or to verify risks at supplier facilities based on predictive analytics. In fiscal year 2021, 211 unannounced assessments and investigations were conducted where the supplier facility was provided no advance notice of our arrival. This is nearly double the number conducted in 2020. In addition to third-party Code of Conduct assessments, we require many of our suppliers to also undergo the Responsible Business Alliance’s (RBA) Validated Assessment Program (VAP), a facility-wide, third-party assessment Appendix Governance Communities Suppliers Customers Our People Environment Introduction Apple’s 2022 ESG Report 39
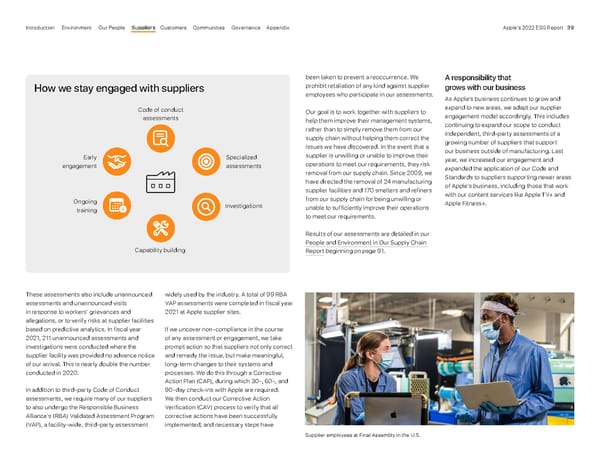
Partnerships that accelerate progress We are collaborating with industry associations, civil society organizations, and multi- stakeholder initiatives around the world to promote best practices, to listen to and learn from others’ perspectives and experiences, and to scale innovative solutions, helping everyone to achieve progress at a more rapid pace. See page 32 of the People and Environment in Our Supply Chain Report for more detail on the organizations we work with. Labor and human rights in the supply chain People come first in everything we do. Our commitment to protecting the people in our supply chain has been unwavering, anchored by a simple set of beliefs: People deserve to be treated with dignity and to know their rights. They should be able to speak up if those rights are not being respected — and to know and expect that when they do, we will listen and act. We’re committed to respecting the rights of every individual in our supply chain. We are committed to respecting the rights of every individual in our supply chain — just like we do for our team members, customers, and other partners — and more broadly, to working with others to share our tools and the lessons we’ve learned, and to empowering everyone to achieve progress more rapidly. Listening to workers Effective grievance channels, ongoing worker management communications, and supplier employee feedback are essential to ensuring respect for worker rights and maintaining safe and healthy workplaces. Whether through social dialogue and formal employee representation, workplace satisfaction surveys, anonymous hotlines, focus groups, or interviews during annual assessments, the feedback we receive directly from supplier employees helps us ensure labor and human rights are respected throughout our global supply chain. We also use this feedback to address emerging risks, improve rights training for supplier employees and supplier management, and to continually strengthen our Code and Standards. • Rights awareness: We believe that protection starts with rights awareness, and since 2008, more than 23.6 million supplier employees have been trained on their workplace rights. Under our Code and Standards, suppliers are required to provide employees with training on their workplace rights. This training is generally conducted during new employee orientation, and covers international labor standards, local labor laws, environmental health and safety, and the protections required by our Code and Standards • Feedback channels: Supplier employee interviews are an important part of every assessment conducted. Each year, we interview tens of thousands of supplier employees in their local language and without their managers present, to determine whether or not their experience on the job aligns with auditors’ observations during assessments. In fiscal year 2021, despite the ongoing challenges presented by the COVID-19 pandemic, we interviewed 87,626 workers in our supply chain — over 35,000 more than were interviewed in the previous fiscal year. Our Code and Standards require effective worker feedback channels, including grievance mechanisms, at all supplier sites. We also provide third-party anonymous hotlines, which are also available to our employees (see page 72 ), and the ability to contact the Apple Environment and Supply Chain Innovation (ESCI) team directly at any time and in any language. When an issue is raised, we require supplier management to immediately investigate and to resolve the issue in a timely manner. In 2021, we launched a grievance hotline awareness campaign, and its initial rollout resulted in a 22 percent increase in utilization of these third-party hotlines. The reports we received from supplier employees via hotlines in 2021 included issues related to wages and benefits, employee relations, amenities at supplier facilities, workforce stability, and health and safety. In each case, we investigated and worked directly with the suppliers to drive improvement and correct any compliance issues found. Suppliers implemented a number of actions as a result of supplier employee feedback through these Appendix Governance Communities Suppliers Customers Our People Environment Introduction Apple’s 2022 ESG Report 40
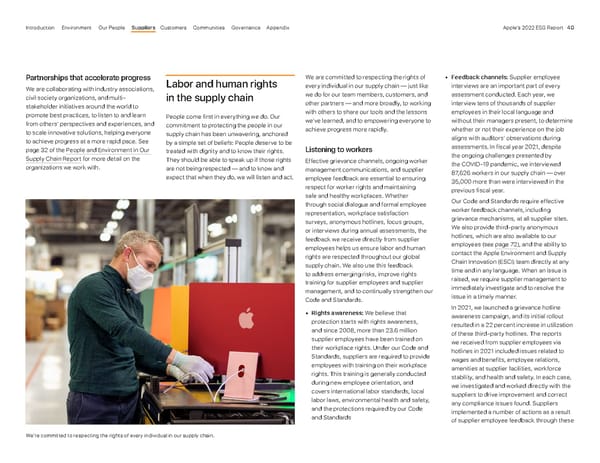
channels, including improvements to working hours, resignation processes, timing of bonuses, and the use of personal protective equipment (PPE). • Workplace satisfaction: In addition to interviews and grievance channels, we also engage with supplier employees to understand their overall workplace satisfaction. In 2021, we anonymously surveyed 264,963 supplier employees in 191 facilities across Greater China, India, Ireland, Malaysia, Philippines, Singapore, UK, U.S., and Vietnam about their workplace experiences — nearly double the number of supplier employees surveyed last fiscal year. As a result, suppliers took 3944 actions, including better commute options, increasing wages and bonuses, offering better food variety, and skill development opportunities for entry-level managers. Responsible labor recruitment Our Code and Standards, and the protections they provide, apply equally to all workers, regardless of a person’s job, geographic location, or how they enter our supply chain — and this commitment begins even before a worker ever enters our supply chain. This includes zero tolerance for forced labor. We implement strict policies and procedures with our suppliers to protect workers in our supply chain from forced labor. This includes selecting suppliers for assessments based on factors, such as their geographic location, which may put them at higher risk of forced labor violations, as well as their previous performance and/or history of violations or allegations. Suppliers may also receive additional specialized assessments based on the nature of their business or employee population, such as those that employ Foreign Contract Workers, and those located in higher risk migration corridors. Our Code and Standards also require that all supplier employees have an effective mechanism to report grievances. In addition, we provide third-party anonymous hotlines and the ability to contact the Apple Environment and Supply Chain Innovation (ESCI) team directly at any time and in any language. When an issue is raised, supplier management is required to promptly investigate and to resolve the issue in a timely manner. We strictly prohibit any form of involuntary labor throughout our worldwide supply chain and look for evidence of it in every supplier assessment we conduct, including unannounced assessments. Last year, we conducted more than 1100 assessments, and found no instances where anyone was forced to work in our supply chain. We did discover two cases in Taiwan in which people paid recruitment fees to secure their job, which is a violation of our Code. We required the supplier to directly repay their employees in full, and verified repayment through a third-party auditor. The payment of recruitment fees, withholding an employee’s passport or personal identity documents, or restricting an employee’s freedom of movement are Core Violations of our Code and Standards — the most serious level of Code violations. If we discover workers have paid recruitment fees at any point on their employment journey to an Apple supplier, we require supplier management to take prompt action to provide remedy to those affected by directly repaying their workers for any and all fees, even if the supplier was unaware that their employees had paid recruitment fees. From 2008 through fiscal year 2021, our suppliers have repaid $33.2 million in recruitment fees directly to 37,322 workers. Finally, in collaboration with the International Organization for Migration (IOM) and the Responsible Business Alliance (RBA), we expanded our Responsible Labor Recruitment Toolkit to more than 39 additional supplier facilities in 10 countries, reaching nearly 77,000 workers globally, with 66 percent of those working on Apple production lines. 23.6M supplier employees trained on their rights since 2008 352,589 supplier employees directly engaged about their workplace experiences, through interviews and satisfaction surveys 220,000 supplier employees reached by grievance hotline awareness campaign Appendix Governance Communities Suppliers Customers Our People Environment Introduction Apple’s 2022 ESG Report 41
How we work to prevent forced labor in our supply chain Apple has zero tolerance for forced labor. In the more than 50 countries and regions where our suppliers operate, we have teams of experts, including independent third parties, who monitor our suppliers and put in place industry-leading procedures to help ensure that no one is forced to work. Our comprehensive policies start before we even sign a contract with suppliers, and we are consistently raising the bar. 1 We set the highest standards. Eliminating forced labor begins with setting and maintaining the highest standards. Our standards often go above and beyond legal requirements to protect people from forced labor risks. 2 We engage early. To address forced labor risks at its roots, we know that our work has to begin before people enter our supply chain. 3 We hold suppliers accountable. Once we’ve implemented thorough preventative measures, independent, third-party assessments verify that our suppliers are meeting our standards. Looking for evidence of forced labor is part of every supplier assessment. If we find any violations of our Code and Standards, we take swift action to remedy the issue and improve their operations. 4 We track progress and report transparently. Consistent improvement requires transparency and accountability. Since 2007, we have been publishing reports on our efforts across all of our work to transparently share our progress and challenges. 5 We regularly engage and partner with stakeholders. Engagement with stakeholders and rights holders is critical to accountability, ensuring we’re taking action where it’s needed, and to achieving rapid progress. Aligning with international frameworks. Apple policies and our supplier requirements align with international labor and human rights standards, including those of the International Labour Organization, the United Nations Guiding Principles on Business and Human Rights (UNGPs), and the Organisation for Economic Co-Operation and Development. The Apple Human Rights Policy Our Human Rights Policy outlines how we treat everyone, including our customers, employees, business partners, and the people across every level of our supply chain. Read the Apple Human Rights Policy The Apple Supplier Code of Conduct and Supplier Responsibility Standards Our supplier requirements contain strict standards for responsible labor recruitment, and apply to all suppliers, protecting workers globally. We go above and beyond legal requirements in many places by strictly prohibiting labor recruitment in regions where we cannot conduct adequate due diligence and by maintaining a zero recruitment fees policy, because we believe no one should pay to secure a job. Read the Apple Supplier Code of Conduct and Supplier Responsibility Standards Thorough mapping informs our strategy. An effective strategy requires deep understanding of our supply chain. To date, we have mapped over 1000 labor recruitment agencies that work with our suppliers across 32 countries. A leading strategy requires leading tools. The Apple Responsible Labor Recruitment Toolkit, developed in partnership with the International Organization for Migration, provides suppliers and their labor agencies with easy-to-use tools that help them effectively manage and report data, mitigating forced labor risks before people even enter our supply chain. In addition to providing hands-on training, we are making these tools openly available for others to use. Awareness is power. We require our suppliers to provide their employees with training on their workplace rights on their first day on the job. This helps to ensure that every person is aware of their rights and what to do if they’re not being respected, which includes the ability to anonymously contact Apple directly. Foreign Contract Workers, who make up a very small percentage of people in our supply chain, also receive training prior to leaving their home country, as well as upon arriving in their destination country. To date, our suppliers have provided workplace rights training to over 23.6 million people. In addition, last year we directly engaged with over 350,000 people in our supply chain to learn more about their workplace experience. Investing in consistent improvement. Through our new Supplier Employee Development Fund, we’re investing $50M to expand programs designed to continue to improve the rights training experience, worker voice platforms, and supplier employee education opportunities. A close look. We regularly conduct independent, third-party assessments, including surprise assessments, of our suppliers, verifying compliance with over 500 points across our standards. This includes an extensive document review to be sure all hiring and personnel records are in place and accurate. In addition to specialized forced labor assessments for at-risk suppliers, we also require many suppliers to participate in facility-wide assessments, such as the Validated Assessment Program, to verify performance across the supplier’s entire business. In the event that we find gaps in a supplier’s compliance or capabilities, we require them to implement a Corrective Action Plan. To date, our assessments have covered 94 percent of our direct manufacturing spend. We investigate every report. In addition to thoroughly assessing our suppliers’ performance in upholding our standards, we also receive reports from the press, governments, civil society, and people in our supply chain, and we encourage the public to report concerns via https://www.apple.com/uk/supplier-responsibility/. We investigate every report, and frequently have Apple teams onsite within 24 hours. Swift action and steep penalties. Forced labor in any form is a Core Violation (the most serious violation level) of our requirements. If a Core Violation is discovered, the supplier’s CEO is notified and the supplier is immediately placed on probation, pending the successful completion of a Corrective Action Plan. Probation can include no new projects, no new business, and termination of existing business. In addition to commercial penalties, if a supplier is unable or unwilling to meet our standards, they risk removal from our supply chain. Since 2009, we have directed the removal of 24 manufacturing supplier facilities and 170 smelters and refiners for failure to meet our requirements. Action this year. In FY21, across more than 1100 assessments, we found no instances where anyone was forced to work in our supply chain. We did find two cases where employees of the same supplier in Taiwan paid recruitment fees. Per our requirements, the supplier directly repaid their employees for those fees. To date, our suppliers have directly repaid $33.2M in recruitment fees to 37,322 of their employees. People and Environment in Our Supply Chain Annual Progress Report Published annually since 2007 (formerly known as the Supplier Responsibility Progress Report), this report contains a detailed accounting of our progress, challenges, and future plans across all areas of our supplier requirements. Read our Annual Progress Report Efforts to Combat Human Trafficking and Slavery Disclosure This disclosure is a specialized filing that focuses specifically on our efforts to prevent and address forced labor risks throughout our supply chain, and includes our due diligence process for our entire business, including manufacturing, materials and goods sourcing, and services. This report also demonstrates our alignment with the UNGPs and meets regulatory requirements in the UK, Australia, and California. Read our disclosure Consistently raising the bar. We revisit all of our supplier requirements every year, consistently raising the bar that suppliers must meet in order to continue doing business with us, and publish the updates publicly. Read the Apple Supplier Code of Conduct and Supplier Responsibility Standards Take a closer look. We publish additional reports that provide a transparent look at our supply chain. Our Conflict Minerals Report describes our work to responsibly source materials. Our Smelter and Refiner List publishes a list of all identified tin, tungsten, tantalum, gold (3TG), cobalt, and lithium smelters and refiners across our global supply chain, and the Apple Supplier List shares the companies and their locations that comprise at least 98 percent of our direct manufacturing spend. Read our disclosures The International Labour Organization (ILO) We work closely with the ILO on a number of projects, including those related to rights and advancing worker voice. Apple is a member of the ILO Global Business Network on Forced Labor, and serves on the steering committee. The International Organization for Migration (IOM) Apple partners with the IOM on multiple initiatives, including the development of our Responsible Labor Recruitment Toolkit and training our suppliers on the Toolkit. Responsible Business Alliance (RBA) Apple collaborates with the RBA and its member companies frequently throughout the year on initiatives spanning the entirety of our program. As a full member, we serve in several leadership capacities, including serving on the board of directors, being a founding and steering committee member of the Responsible Labor Initiative, and serving on the steering committee of the Responsible Minerals Initiative. Responsible Labor Initiative (RLI) Apple is a founding member and serves on the steering committee of RLI, which was established by the RBA as a multi-industry, multi-stakeholder initiative focused on ensuring that the rights of workers vulnerable to forced labor in global supply chains are consistently respected and promoted. Fund for Global Human Rights Apple partners with the Fund to support grassroots activists, as well as human rights and environmental defenders, which empowers local voices. Appendix Governance Communities Suppliers Customers Our People Environment Introduction Apple’s 2022 ESG Report 42
Health, safety, and wellness Everyone has the right to a safe and healthy workplace. We work from the earliest stages of product design to ensure that the materials, machines, and processes used in the manufacturing of our products prioritize the health and safety of the people working in our supply chain. Building a culture of safety Among many topics, our Code and Standards cover the safe handling of chemicals, emergency preparedness, health and safety permits, living and working conditions, and incident management. Health and safety is also an important part of every assessment we conduct. Any instances of noncompliance with our Code and Standards during an assessment are addressed through customized Corrective Action Plans, online training materials, and capability building with EHS experts in order to improve their future performance. In 2021, we began development of a safety culture guide to help suppliers cultivate a deeper, more sustainable culture of safety in their facilities. Health and wellness Beyond keeping people in our supply chain safe, we’re committed to creating workplaces where people can thrive. This means giving our supplier employees the tools and resources to improve their physical and mental health and well-being. Since 2017, we’ve helped make health education and resources available to more than 2.95 million supplier employees on topics such as reproductive health, disease prevention, and nutrition. In 2021, we conducted a needs assessment to give supplier employees an opportunity to share their feedback, and we are updating our resources with those results in mind. Safeguarding health through safer chemistry Our commitment starts with setting and upholding strict material safety standards that often go beyond regulatory requirements in order to protect human health and the environment. These are outlined in our Code and Standards and our Regulated Substances Specification (RSS), and are derived from international laws or directives, regulatory agencies, eco-label requirements, and environmental standards. We then go further, by intentionally designing our products and manufacturing processes to use safer materials, as well as verifying that the correct health and safety protocols are being used across our supply chain. And we’re making an impact beyond our supply chain by working with others to help make the use of safer materials the industry norm. We received the U.S. Environmental Protection Agency’s (EPA) Safer Choice Partner of the Year Award for the second year in a row, in recognition of our leadership in safer chemistry. We’re also a founding signatory of the Clean Electronics Production Network’s (CEPN) Toward Zero Exposure program, a public platform for companies across the electronics industry to commit to and report on their efforts to eliminate workers’ exposure to hazardous chemicals in manufacturing. 1000+ supplier facilities disclosed chemical and safety data, representing the majority of Apple’s direct spend 2nd Year receiving U.S. EPA Safer Choice Partner of the Year Award See more about our approach to smarter chemistry on page 20 and on page 54 of the People and Environment in Our Supply Chain Report Appendix Governance Communities Suppliers Customers Our People Environment Introduction Apple’s 2022 ESG Report 43 We work from the earliest stages of product design to ensure that the materials, machines, and processes used in the manufacturing of our products prioritize the health and safety of the people working in our supply chain.
Responsible materials sourcing From mapping our supply chain and assessing risk, to conducting independent, third-party audits, engaging with civil society and industry, and investing heavily in innovation, upholding standards in the sourcing of materials is a responsibility that requires a strategic, comprehensive approach. As we make progress toward our goal to use only recycled and renewable minerals and materials in our products and packaging, we continue to source primary materials — including tin, tantalum, tungsten, and gold (3TG), and other minerals, such as cobalt — responsibly, while working to improve conditions in and around mining communities. Our Responsible Sourcing of Materials Standard, part of our Code and Standards, covers all primary and recycled materials, including advanced and bio-based materials. Our standard aligns with leading international standards, including the United Nations Guiding Principles on Business and Human Rights and the Organisation for Economic Co-operation and Development’s Due Diligence Guidance for Responsible Supply Chains of Minerals from Conflict-Affected and High-Risk Areas (OECD Due Diligence Guidance). Every year, as part of our commitment to transparency, we publish a list of identified 3TG, cobalt, and — for the second year — lithium smelters and refiners in our supply chain. 100% of identified 3TG, cobalt and lithium smelters and refiners participated in independent, third-party audits A placer miner holds gold sourced from Alaska and the Yukon as part of the Salmon Gold Project. Learn more on page 70 of People and Environment in Our Supply Chain Report . Read more on page 69 of our People and Environment in Our Supply Chain Report and in our Conflict Minerals Report The first battery with 100% responsibly sourced key minerals We also achieved an industry first — a battery containing 100 percent responsibly sourced key minerals, whether primary or recycled. In 2021, all identified cobalt and lithium refiners — key materials used to make batteries for all Apple products — participated in OECD-aligned independent, third-party audits covering labor, human rights, and environmental policies, as well as management systems. We continue to conduct additional due diligence and carry out OECD-aligned independent, third-party audits on other battery materials such as graphite, nickel, and copper. We also map other minerals in our products such as mica, copper, graphite, and nickel, and assess new materials for compliance with our requirements prior to production. In fiscal year 2021, we conducted due diligence on 26 recycled or bio-based materials to verify that their sourcing pathways met Apple’s standards and expectations. Also in fiscal year 2021, 100 percent of the identified 3TG, cobalt, and lithium smelters and refiners in our supply chain have participated in independent, third-party audits to assess and identify a broad range of risks, including social, environmental, human rights, and governance risks. This marks seven consecutive years of 100 percent compliance for 3TG, six consecutive years for cobalt, and two consecutive years for lithium. In the event that a smelter or refiner is unable or unwilling to meet our requirements, we remove them from our supply chain. Since 2009, we have directed the removal of 163 3TG and 7 cobalt smelters and refiners from our supply chain. Appendix Governance Communities Suppliers Customers Our People Environment Introduction Apple’s 2022 ESG Report 44
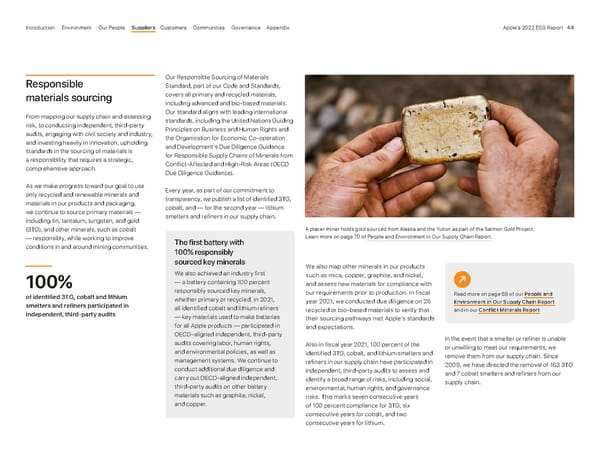
Education and professional development Through our global supply chain, we create opportunities for people around the world, including by helping to close skills gaps in manufacturing, and by helping to prepare workers across our supply chain for the jobs of today and tomorrow. Supplier Employee Development Fund and Apple Education Hub In March 2022, we announced a $50 million Supplier Employee Development Fund to amplify worker voice and expand access to learning and skill development opportunities to more people in our supply chain and surrounding communities. Part of this commitment will support new and expanded labor programs reaching more than 3.5 million supplier employees in over 40 countries, aided by our strategic partners, including the International Labour Organization (ILO) and the International Organization for Migration (IOM). As part of this fund, we also launched the Apple Education Hub, informed by our previous supplier employee learning and development programs, which 5 million supplier employees have taken advantage of since 2008. In partnership with local educational institutions and NGOs, the Apple Education Hub will provide a scalable solution through virtual- first learning, to promote and develop the skills necessary for the future of work in our supply chain and surrounding communities. With initial programming to begin in the Apple’s $50 million Supplier Employee Development Fund will expand access to learning opportunities and skills development for people across its supply chain. Using our purchasing power for good For Apple, our work to make our company more inclusive extends to how we choose the businesses we work with. When contracting with suppliers, we use our purchasing power to increase diversity in our supply chain and change outdated norms that hurt those who are underrepresented in their field or industry. Apple’s award-winning Supplier Diversity program, established in 1993, actively engages suppliers from historically underrepresented communities. We have policies and procedures that require diverse supplier participation during early-stage sourcing, key performance indicators to measure company success, and diversity awareness trainings for our global sourcing team members and related Apple business units. In 2016, Apple was the first Silicon Valley–based company to be invited into the Billion Dollar Roundtable (BDR) in recognition of our long-standing commitment to promoting diversity within our supplier base. BDR celebrates corporations that achieved spending of at least $1 billion with minority- and woman-owned businesses. In calendar year 2021, Apple spent over $7.1 billion with diverse suppliers around the world. Our Supplier Diversity program offers support to participating suppliers and seeks active engagement in industry diversity leadership activities. For example, supplier development has been a long-standing commitment within Apple’s supply chain, which is facilitated internally and externally. Externally, we partner with major universities to provide executive development and capacity building to key diverse suppliers. And we’re proud to have supported Michigan State University and Howard University on creating their first programs for diverse supplier development. A highlight of 2021 was that for the first time we engaged diverse suppliers in North America in manufacturing accessories for some of Apple’s most well- known products. We’re also promoting diversity in the companies with which we do business. For example, our agreements with our primary construction suppliers require the reporting of their efforts to include diverse subcontractors on all Apple- related projects. As a result of our efforts, we were chosen as Corporation of the Year by the National Minority Supplier Development Council (NMSDC) in October 2021. This award is NMSDC’s highest honor to a major corporation for the utilization of ethnic minority- owned suppliers, specifically those with Asian-Indian, Asian-Pacific, Black, Hispanic/Latinx, and Indigenous owners. Appendix Governance Communities Suppliers Customers Our People Environment Introduction Apple’s 2022 ESG Report 45
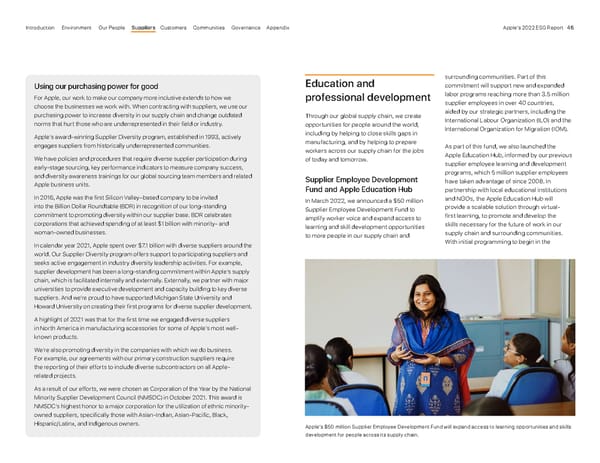
Apple helps suppliers rapidly accelerate renewable energy use around the world In April 2022, Apple announced that its suppliers more than doubled their use of clean power over the last year, with over 10 gigawatts operational today out of nearly 16 gigawatts in total commitments in the coming years. In 2021, these renewable projects avoided 13.9 million metric tons of carbon emissions. The projects online today will support greenhouse gas reductions equivalent to removing 3 million cars from the road for one year. Apple is constantly working with its global supply chain to accelerate and support its transition to clean energy. As of March 2022, 213 of the company’s major manufacturing partners have pledged to power all Apple production with renewable electricity across 25 countries. The dozens of new commitments announced this year will accelerate progress toward Apple’s 2030 goal to become carbon neutral across its entire supply chain. U.S., China, India, and Vietnam, more than 100,000 supplier employees will participate in new learning opportunities by 2023 — from leadership training and technical certifications, to classes on coding, robotics, and advanced manufacturing fundamentals. Internal leadership and technical programs We work consistently to provide meaningful educational opportunities that enrich supplier employees’ workplace experiences and provide opportunities to improve career paths. Over the past five years, more than 5000 students have participated in our Line Leader, Automation Technician, and general apprenticeship programs. These programs give participants the skills they need to pursue opportunities in highly technical roles. In 2021, 5883 supplier employees at 18 supplier sites participated in technical training, including programs on robotics, Computer Numerical Control (CNC) machines, and mobile device repair. Coding Since 2017, we’ve offered training to supplier employees on Apple’s Swift coding language — a skill that is in high demand. In 2021, we continued to build on feedback from students and suppliers to refine our curriculum by adding more opportunities for virtual learning while maintaining the quality and consistency of the programs. Environment Human rights and environmental protection are inextricably linked. And we’re taking action accordingly. As we build products that enrich the lives of people around the world, we have a profound responsibility to do so in a way that minimizes our resource use while protecting the local environments and communities where we and our suppliers operate. We work with our suppliers to help us address our environmental commitments, including our goal to become carbon neutral by 2030 across our entire product footprint. Our Supplier Energy Efficiency Program and Supplier Clean Energy Program both address direct and indirect emissions in our supply chain, while our Supplier Clean Water and Zero Waste programs help to reduce resource usage. In addition, our Code contains strict environmental protections, which require our suppliers to understand and take active steps to reduce their environmental impact while also becoming better stewards of the resources we all share and the communities in which we operate. Specifically, our Code addresses the management of regulated substances, stormwater, wastewater, air emissions, waste, and noise, as well as pollution prevention, resource reduction, and obtaining necessary environmental permits. More detail about our environment work in the supply chain is covered on page 13 , as well as in People and Environment in Our Supply Chain Report and the Environmental Progress Report . Apple has invested in the 2300-acre IP Radian Solar project in Brown County, Texas. Appendix Governance Communities Suppliers Customers Our People Environment Introduction Apple’s 2022 ESG Report 46
Customers In this section Our approach 48 Privacy 48 Accessibility 50 Inclusive design 52 Education 53 Health 54 Caring for customers 55 Design that empowers. Appendix Governance Communities Suppliers Customers Our People Environment Introduction Apple’s 2022 ESG Report 47
At Apple, our North Star is creating technology that empowers people and enriches their lives. Teams across Apple are always innovating to make technology that’s even better for our users — that protects their right to privacy, that’s durable and resilient, and that’s inclusive and accessible for everyone. And wherever we meet our customers — online, over the phone, or in person — we’re committed to treating everyone with dignity and respect. We believe that technology should be a force for good in the world. It’s why we partner with students and educators using technology to teach and learn in new ways, and collaborate with doctors and researchers to uncover new insights that help people live healthier lives. Every day, we work to infuse the technology we make with the values that define us. Responsibility for integrating privacy, accessibility, inclusion, education, and health into our products and services cuts across many teams, including Hardware Engineering, Software Engineering, Hardware Technologies, Machine Learning and AI, and Environment, Policy and Social Initiatives. Because we care about our customers, we also have programs in place to understand and support their needs. We work to provide positive customer experiences as well as products that are durable and can be used for years to come. And when we design our products, we’re focused on making them safe for anyone who assembles, uses, or recycles them. Privacy Privacy is a fundamental human right, and we’re constantly innovating to give users more transparency and control over their data. It’s why we set the industry standard for minimizing data collection and processing a user’s data on-device, and build industry-leading transparency and controls into our technology. Our approach Delivering exceptional products that enrich the lives of our customers is core to Apple’s business. We have enormous potential to help people use technology to overcome barriers to their goals, innovate to solve problems, and expand access to critical needs like health and education. With our products and services, we’re uniquely positioned to both empower our customers to take action as well as to drive positive impact on some of the biggest issues in our society today, including those addressed by the UN Sustainable Development Goals (see page 75 ). Equally important, we have a responsibility to manage the environmental footprint of our products and services (see page 13 ) and understand their impacts on customers’ rights as set out in our Human Rights Policy. Across our products and services, we consider how we respect human rights, including privacy, freedom of expression, non-discrimination, accessibility, health, education, a clean environment, and safety. Our human rights due diligence (see page 10 ) helps us identify and manage salient human rights risks across our current portfolio, as well as look ahead to fast-evolving areas like machine learning and artificial intelligence (AI). Appendix Governance Communities Suppliers Customers Our People Environment Introduction Apple’s 2022 ESG Report 48
Hand in hand with the privacy of our users are our commitments to free expression and access to information. Our products and services help our customers learn, express their creativity, exercise their ingenuity, communicate privately and securely, and share information globally, whether by text message, audio, or sign language over FaceTime video. Designed for privacy Our products and services are built with innovative privacy technologies and techniques designed to minimize how much of your data Apple — or anyone else — can access. They contain features designed and implemented over decades to protect customers’ privacy and give them control over their information. Safari was the first browser to block third- party cookies by default as far back as 2003, and in 2017, Safari added Intelligent Tracking Prevention to further limit tracking while still enabling websites to function normally. Random identifiers ensure that routes customers take and the places they search in Maps are not associated with their Apple ID, and Messages and FaceTime are end-to- end encrypted, so Apple can’t eavesdrop on user communications. Siri was designed from the very beginning in 2011 to not associate the things that users say to Siri with their Apple ID, but instead uses a random identifier generated when a user first enables Siri. That has remained the same since then, and in 2021, with newly introduced on-device speech recognition, the audio of users’ Siri requests is processed right on their iPhone or iPad by default. Throughout the App Store ecosystem, we continue to add innovative new features that advance user privacy even further. Privacy Nutrition Labels require developers, including Apple, to report their data collection and privacy practices in a standardized format. And App Tracking Transparency requires developers to obtain a user’s permission to track their data across apps or websites owned by other companies for use in advertising or shared with data brokers. Apple’s Privacy Policy ensures that privacy remains a top priority in all that we do. Our suppliers are also obligated to apply our privacy principles via our contractual terms. We respect users’ ability to know, access, change, transfer, restrict, and delete personal data, and we strive to collect the minimum amount of data necessary to power our products and services. Customers control what information is shared, where it’s shared, and when it’s backed up. We do not provide user information to any third parties without a clear legal basis, and we publish a Transparency Report detailing government requests for customer data and app removal. Users can exercise their privacy rights at our dedicated Data and Privacy page, privacy.apple.com , where they can receive a copy of the personal data that Apple holds on them across all of their interactions with us and request deletion or temporary deactivation of their account if they wish. Apple is committed to delivering advertising in a way that respects user privacy. Apple -delivered ads may appear on the App Store, Apple News, and Stocks depending on the jurisdiction. The Apple advertising platform does not track users, nor does it buy or share user personal information with other companies. To continue raising awareness and educating people on how to protect their personal information, on Data Privacy Day in January 2021 we shared a report that illustrates how companies track user data across websites and apps. And in June 2021 we shared another report exploring how Apple’s security layers and the App Review process protect users and keep them in control of their data. Privacy governance To keep privacy at the center of our work, we maintain rigorous privacy standards for both customer and employee data. Our Chief Privacy Officer reports to Apple’s Senior Vice President and General Counsel, who chairs Apple’s Privacy Steering Committee. The Committee Privacy and security on the App Store To meet the highest standards for privacy, security, and content, all the apps in our App Store agree to comply with our App Store Review Guidelines. These provide developers with clear and transparent guidance on safety, performance, business, design, and legal issues, including appeal rights. The guidelines help ensure that the apps offered on the App Store are safe, provide a good user experience, adhere to our rules on user privacy, and secure devices from malware and threats. Privacy Nutrition Labels: Product pages on the App Store feature a section that provides developers’ self-reported summaries of some of their privacy practices in a simple, easy -to -read label. Learn more . Appendix Governance Communities Suppliers Customers Our People Environment Introduction Apple’s 2022 ESG Report 49
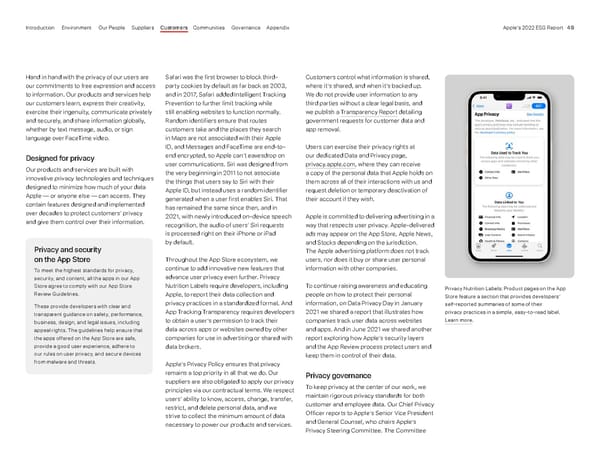
sets privacy standards for teams across Apple and addresses or escalates privacy compliance issues. Its members include Apple’s Senior Vice President of Machine Learning and AI Strategy and Senior Vice President of Software Engineering, and a cross-functional group of senior representatives from across the business. These standards are in turn implemented and assessed by our Privacy Compliance team, which works to continue to deliver on our privacy commitments across all personal data collections. We’ve created a dedicated structure with executive sponsors in each functional area, supported by privacy champions embedded in each functional area and taking direction from the Privacy Compliance team. The Audit and Finance Committee of the Board of Directors regularly reviews Apple’s privacy and data security risks, and discusses them with management. The Committee reviews reports on privacy and data security matters, including updates on Apple’s privacy program, cybersecurity risks, risk management, and relevant legislative, regulatory, and technical developments. We maintain current ISO 27001 and ISO 27018 certifications that set user security standards, for which we undergo yearly audits. Privacy and security training We communicate privacy and security guidelines with employees and strictly enforce safeguards across the company. All employees take annual training on business conduct, of which privacy is an essential component. Employees with access to customer data and personal information are required to undergo additional privacy and security training. For more information, visit Apple’s Ethics and Compliance website . Privacy Impact Assessments As part of our General Data Protection Regulation (GDPR) and human rights work, we undertake Privacy Impact Assessments (PIAs) of our major products and services. These assessments also consider decision-making that relies on algorithmic systems and the impact such decisions have on individuals and their rights. PIAs take into consideration how laws affect privacy and assess any associated risks in the relevant jurisdictions where we operate. PIA reviewers are also trained to identify and highlight potential impacts to freedom of expression. Apple regularly engages with a wide range of civil society representatives globally on various privacy and freedom of expression issues, including privacy by design and encryption. Privacy inquiries Privacy questions, concerns, or complaints can be raised online or by calling our Apple support number. Our Data Protection Officer is available for questions regarding the Privacy Policy or general privacy practices. Embedding security and privacy We’ve spoken out, time and again, for strong encryption without backdoors, recognizing that security is the foundation of privacy. We build security into our hardware, software, and services, including at the design and development phase, to provide users with maximum security and a transparent user experience, serving the ultimate goal of keeping personal information safe. And we’ve designed the Secure Enclave — a dedicated secure subsystem integrated into Apple hardware — to keep sensitive user data, like biometric information, secure. As part of our commitment, our Apple Security Bounty rewards researchers who discover and share with us critical issues in our latest operating systems and the techniques used to exploit them. Apple also uses administrative, technical, and physical safeguards to protect users’ data, taking into account the nature of that information and the threats posed. Apple employees who handle personal information are only permitted to use approved software and collaboration tools. Our employees handling personal data are required to undergo dedicated privacy training, which is updated on an ongoing basis to take into account new laws and privacy developments. All our employees can raise any privacy issues and questions with our Data Protection Officer, who is mandated to raise any issues of concern to Apple’s Privacy Steering Committee. When we become aware of a potential data security incident, we conduct prompt investigations and analysis, provide notifications in a timely manner when necessary, and determine what steps to take in response. Learn more about privacy at Apple Review privacy features Control what you share See how apps from Apple handle your data Accessibility At Apple, we believe technology can play a powerful role in helping people to create, learn, be more collaborative and independent, foster dignity, and live out their dreams. Accessibility is a human right. Nowhere is that more evident than in our work in accessibility. Our work to make technology customizable to the diverse needs of all our users has become widely known. For example, the 2021 WebAIM survey (from the Institute for Disability Research, Policy, and Practice, Utah State University), which analyzed responses from over 1,500 users around the world who have a vision disability and use a screen reader, shows that 71.9% of survey respondents use iPhone or iPad with Apple’s VoiceOver as their primary mobile platform. Apple has also been repeatedly honored for our accessibility work, including most recently receiving a FCC Chair’s Award for Advancement in Accessibility for iOS 14, which added a suite of accessibility features that have particular importance in the context of the COVID-19 pandemic. These features — People Detection, VoiceOver Recognition, sign language prominence in FaceTime, and Sound Recognition — have helped users with disabilities navigate day-to-day life during the COVID-19 pandemic. Our passion and commitment to inclusion led Apple to recently join the Valuable 500 and be designated “Iconic Partner for inclusive design.” The Valuable 500’s mission includes tangible action for disability inclusion, starting at the CEO level to grow investments in company culture, standards, recruitment, representation, and research worldwide. Appendix Governance Communities Suppliers Customers Our People Environment Introduction Apple’s 2022 ESG Report 50
Apple promotes authentic and positive portrayals of disability in films and series on Apple TV+, including CODA , See , El Deafo , and Little Voice . Apple Original content includes audio descriptions in Dolby Atmos in nine languages, and closed captions and subtitles for the deaf and hard of hearing in over 40 languages in all 100+ countries where Apple TV+ is available. Vision Our features for blind and low-vision users include VoiceOver, an industry-leading screen reader that describes exactly what’s happening on your device, and Zoom, a screen magnifier that lets you enlarge the content you see on your device. Magnifier, Apple’s built-in app for iPhone and iPad, turns the camera into a digital magnifying glass to increase the size of any physical object you point it at. The People Detection feature in Magnifier uses camera, LiDAR Scanner, and on-device machine learning to help support health and safety for users who are blind or have low vision and need to maintain social distancing. Hearing To support customers who are deaf or hard of hearing , Apple was the first to directly connect hearing aids or a cochlear implant to iPhone and other iOS devices through the Made for iPhone (MFi) program. This enables customers to make phone calls and stream high-quality audio directly to their MFi hearing devices. And in 2021, Apple added support for the latest generation of bidirectional hearing aids from Made for iPhone partners that support hands- free phone and FaceTime conversations. Sound Recognition notifies users of external environmental sounds like running water, alarms, electrical appliances, breaking glass, and more, with the newly introduced option to train your iPhone or iPad to listen for a specific alarm or electrical appliance sound. Other features include Live Captions (beta), introduced in 2022, which helps users with hearing disabilities follow along with calls and media on iPhone, iPad, and Mac; sign language prominence in FaceTime, which can detect when someone uses sign language in group calls; and Conversation Boost for AirPods Pro, which helps users better hear conversations in crowded or noisy environments. Mobility Users with limited mobility can use Switch Control to navigate their device with a variety of switches, including head-tracking, back tap, sound actions, and certified MFi switches. Voice Control helps a user control a device with voice commands across iPhone, iPad, and Mac. On Apple Watch, AssistiveTouch for Apple Watch helps users with upper-body limb differences to enjoy the benefits of Apple Watch without having to touch the display. And Apple Watch Mirroring, introduced in 2022, supports users with quadriplegia or other physical and motor disabilities in controlling Apple Watch via iPhone using assistive features such as Switch Control and Voice Control. iPadOS supports third-party eye-tracking devices, making it possible for people to control iPad using just their eyes. With Touch Accommodations, customers can control how long they touch the screen before it’s recognized and whether repeat touches are ignored, while Back Tap lets users double- tap or triple-tap the back of their iPhone to automatically perform a range of custom tasks, from opening an app to taking a screenshot. Cognitive Our products are built with an array of features to support people who are neurodivergent or have cognitive disabilities. Background sounds help minimize distractions and support users who want to focus, stay calm, or rest. With Speak Selection for iOS and macOS, audio can be used to support reading or writing comprehension, and Dictation and Siri help anyone who finds speaking easier than typing or writing. Another feature, Guided Access, limits a device to a single app and lets users control which features are available. The People Detection feature in Magnifier uses the LiDAR camera in iPhone 12 Pro, iPhone 13 Pro, and iPad Pro to help support health and safety for users who are blind or have low vision and need to maintain social distancing. Community support Apple offers extensive support documentation , engaging online training content , and in-store sessions to help anyone learn how to use our built-in accessibility features. Customers can also call or chat with Apple Support staff dedicated to supporting accessibility, or share feedback about an accessibility feature on an Apple product . Appendix Governance Communities Suppliers Customers Our People Environment Introduction Apple’s 2022 ESG Report 51
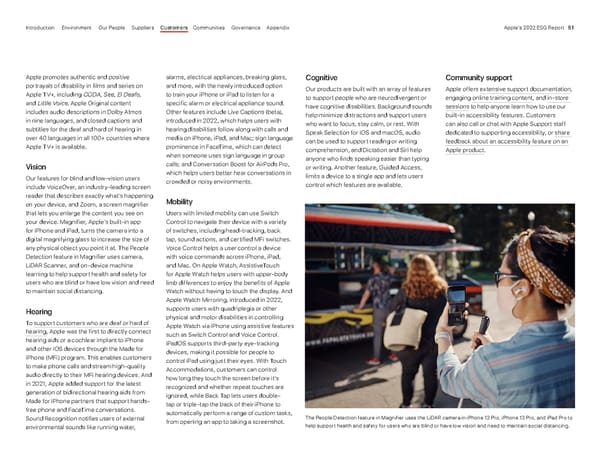
We offer world-class, on-demand sign language interpretation services with the SignTime service available in US, UK, France, and Canada, which helps Apple customers and team members request an interpreter and communicate using American Sign Language (ASL) in US and Canada, British Sign Language (BSL) in the UK, or French Sign Language (LSF) in France. External engagement Apple subscribes to the principle of participation — “Nothing About Us Without Us” — used by disability organizations to call for inclusion in work done for, by, and with persons with disabilities. In addition to hiring people with disabilities to develop and inform our accessibility features, we welcome all users to beta test features and give feedback. We work with various nonprofit organizations around the globe to strategically align and support each other, and we maintain constant contact with community organizations to help ensure that we are exceeding their expectations. We also work with international standards organizations to expand equal access to information and functionality while working to protect and improve the rights, inclusion, and equity of people with disabilities. Apple follows policy developments and shares its best practices with regulators, governments, and organizations, including the World Health Organization (WHO) and the European Disability Forum (EDF). Working with the World Federation of the Deaf, the American Council of the Blind, the Cerebral Palsy Foundation, and the National Association of the Deaf, Apple proposed the adoption of accessibility-themed emoji to the Unicode Consortium, the global body in charge of setting character standards across all computing platforms. In 2019, the consortium adopted Apple’s recommendation for more inclusive and representational emoji. And in 2021, we expanded the accessibility options for Memoji to include cochlear implants, an oxygen tube, and a soft helmet. Inclusive design Building on our accessibility work, we’ve always believed that in order to create the most personal technology in the world, we must consider the full range of human experiences. All across Apple there is a sustained commitment to making products more inclusive for a wide range of diverse groups. Apple engineers work hand in hand with teams across the business to help solve unique problems others seldom think about. For example, with iOS 14.5, Siri no longer has a default voice, allowing users to choose the voice that speaks to them when they first set up their device, and in English, users can now select more diverse voice options. We’re also taking steps to ensure equity in our cameras’ automatic person recognition features so that everyone can have the same extraordinary experience, no matter the photographic subject’s skin color, age, or gender. As a result, the machine learning models used in camera technology must show similar performance across various age groups, genders, ethnicities, skin tones, and other attributes. We’ve also published research on this work to help others learn from it. Beyond our own products and services, we’ve developed machine learning research and Human Interface Guidelines to support developers in building inclusive apps that put people first by prioritizing respectful communication and presenting content and functionality in ways that everyone can access and understand. Some of the characteristics to consider include age, gender and gender identity, race and ethnicity, language and culture, and social and economic context, among others. We also provide tools, documentation, sample code, and design best practices to help developers make their apps more accessible. We launched two videos during our Worldwide Developers Conference (WWDC) in June 2021 on the process and practice of inclusive design that were among the most popular of the week: The Process of Inclusive Design and The Practice of Inclusive Design . A preview of innovative accessibility features combining the power of hardware, software, and machine learning In May 2022, we previewed software features coming later this year that offer users with disabilities new tools for navigation, health, communication, and more. Using advancements across hardware, software, and machine learning, people who are blind or low vision can use their iPhone and iPad to navigate the last few feet to their destination with Door Detection; users with physical and motor disabilities who may rely on assistive features like Voice Control and Switch Control can fully control Apple Watch from their iPhone with Apple Watch Mirroring; and the Deaf and hard of hearing community can follow Live Captions on iPhone, iPad, and Mac. Read more here . Apple’s innovative software features introduce new ways for users with disabilities to navigate, connect, and get the most out of Apple products. Appendix Governance Communities Suppliers Customers Our People Environment Introduction Apple’s 2022 ESG Report 52
Education For more than 40 years, we’ve worked alongside educators to inspire the next generation of learners, supporting creativity, problem-solving, communication, and collaboration. We believe that education can be a great equalizing force, and our goal is to empower all educators and learners through technology that protects student privacy and is accessible for all learners. We develop products, programs, tools, and curricula for educators to create engaging learning experiences, and we support education leaders and administrators so they can get the most out of the technology in the classroom and beyond. Coding is a universal language, and a great way to help students think critically and express their creativity. We’re always working to make it easy and fun to learn to code, with supportive resources like Swift Playgrounds and the Everyone Can Code curriculum. And we work hand in hand with communities — particularly communities of color and others that are under- resourced — to bring coding, creating, and entrepreneurship opportunities to learners of all ages. Products for learning Knowing that everyone has their own way of learning and expressing themselves, we offer products that support students and educators from kindergarten through higher education. iPad provides apps and advanced technologies that help educators teach and students push the boundaries of their creativity. The Augmented Reality capabilities on iPad let students bring digital objects into the real world to spark curiosity and enhance understanding in new, exciting ways. And the powerful Mac processors are equipped for the most intensive tasks, throughout university and far beyond. We also developed Apple School Manager, a free web-based portal that helps IT administrators in K–12 and higher education institutions effortlessly configure, deploy, and manage iPad and Mac devices. Teaching tools Our teaching tools empower educators to personalize the learning experience for each student and manage the classroom to keep every student on task. Our Classroom app serves as a powerful teaching assistant that makes it easy to navigate lessons and share information, while the Schoolwork app aids the distribution and collection of assignments, tracks progress, and supports collaboration with students. Curricula and project guides Our programs help educators integrate creativity and coding into their lessons, even if they’re new to teaching with technology: Everyone Can Create: Gives educators fun and meaningful ways to bring creative expression into any lesson, topic, or assignment. The free guides teach students to develop and communicate ideas through drawing, photography, video, and music, while teacher guides help educators integrate both technology and creativity into every lesson. Everyone Can Code: Guides students through the Swift Playgrounds app on iPad and Mac. This free curriculum and the app teach coding for kids through a world of interactive puzzles Expanding horizons with Inclusive App Design Educators can also try Apple’s new one-hour Inclusive App Design activity to introduce students to the world of coding and app development. During Europe Code Week in October 2021 and through Computer Science Education Week in December 2021, Apple encouraged educators and their students to participate in an introductory Inclusive App Design activity. This new lesson from Apple helps educators guide students through a one- hour session to turn their ideas into apps with inclusion and accessibility in mind. The app design process helps students identify problems they care about, and then plan, prototype, and code creative solutions. It helps students think critically about how to build apps that are inclusive for all and prepares them to be the innovators of tomorrow. and playful characters, and introduce Swift, the same programming language used by professional app developers. Teacher guides support educators in teaching code, even if they have no experience. Develop in Swift: Teaches students ages 14 and over how to use Swift for designing and developing apps through Apple’s integrated development environment, Xcode. In 2020, we launched a free online course taught by Apple experts that helps instructors learn to teach Swift and Xcode. Learn more about how Apple empowers educators and learners of all ages. Read more about Apple’s community education initiatives in Communities ( page 62 ). Appendix Governance Communities Suppliers Customers Our People Environment Introduction Apple’s 2022 ESG Report 53
Apple Distinguished Educators and Apple Distinguished Schools Our community of nearly 3000 Apple Distinguished Educators in 45 countries model, advise, advocate, and publish materials on ways to integrate Apple technology into teaching and learning. These educators are active leaders, helping to make learning deeply personal for every student. Apple Distinguished Schools are centers of leadership and educational excellence that demonstrate the impact of learning with Apple technology. The nearly 700 schools across 36 countries cultivate environments where students are excited and curious about learning. Inspiration and support for teachers We help educators share experiences, ideas, and inspiration, so that they too can get more out of the technology in their classrooms. Apple Teacher is a free online, self-paced professional learning program that helps teachers build their skills and confidence in teaching with Apple technology and earn Apple Teacher recognition. Our Apple Professional Learning Specialists are experts who provide one-on-one coaching sessions and group professional learning workshops for educators, in addition to the support resources available online or via phone. The majority of our educator tools are free, and we offer special pricing on Mac, iPad, and other Apple hardware for education institutions, eligible college students, and education faculty and staff. In March 2022, we unveiled Apple Learning Coach, which is a free professional learning program that trains instructional coaches, digital learning specialists, and other coaching educators to help teachers effectively use Apple technology in the classroom. Through a mix of self-paced lessons and virtual workshop sessions with Apple Professional Learning Specialists, participants come away from the experience with an actionable portfolio, a cohort of peers, and the opportunity to apply for continuing education credits from Lamar University through the Texas Education Agency. Each Apple Learning Coach gains a deeper understanding of how to support teachers where they are, as they integrate technology into learning. Health Apple empowers our users to take control of their health by making it easier to track and share their health and wellness information while always keeping their data secure. This allows for a more informed dialogue with loved ones and doctors, offering the ability to make better health choices on a daily basis. Privacy is a fundamental aspect of our health work. The right place for health information to exist is with a user on their device, and where or how that information is shared should be completely up to the individual. Professional learning is a key piece of Apple’s education offerings. Technology for better health Since launching Apple Watch in 2015, we’ve been constantly inspired by the stories we hear from our users about how using Apple Watch for health and fitness has changed their lives. These range from users who found closing their Activity rings every day motivated them to be in the best shape of their lives to those alerted to a potential irregular heart rhythm who sought medical care to confirm. Stories like those continually drive us to do more for our users. Building on innovative features for Apple Watch like the ECG app, irregular rhythm notifications, and fall detection, Apple recently introduced a variety of services and features to help people on their health and fitness journeys. Apple Fitness+ is an award-winning fitness and wellness service powered by Apple Watch and designed to be welcoming to all, wherever they are in their journey. Fitness+ helps users train their body and mind with a personalized and engaging experience that can be done anytime, anywhere; intelligently incorporates workout metrics from Apple Watch right on the screen; and motivates users from start to finish with music from today’s top artists. Features like Handwashing, Sleep, and Blood Oxygen offer more insights into users’ overall wellness to make more informed decisions for themselves. Apple Watch users can also view a classification of their Cardio Fitness Level — a powerful predictor of overall health — in the Health app, and receive a notification if it falls within the “low” range. The breakthrough technology allows users to better understand their cardio fitness measurements taken right from their own wrist. Appendix Governance Communities Suppliers Customers Our People Environment Introduction Apple’s 2022 ESG Report 54
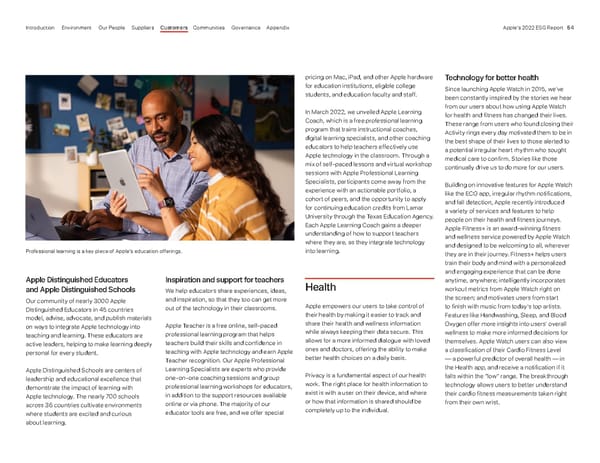
and the UK. Additionally, users have the option to securely share their health data with a loved one, a caregiver, and, in the U.S., their doctor through the Health app. Health research Everything Apple does in health is based in science. We have a history of enabling the medical community through platforms like ResearchKit and CareKit, which help researchers produce medical insights and discoveries on conditions from epilepsy to Parkinson’s at a pace and scale never seen before. Apple technology is helping democratize medical research by giving users the ability to opt in to share data through the Research app using their iPhone or Apple Watch. There are currently three public landmark studies in the Research app: Apple Women’s Health Study: The Harvard T.H. Chan School of Public Health has teamed up with Apple and the National Institute of Environmental Health Sciences to gain a deeper understanding of how certain demographic and lifestyle factors could have an impact on menstrual cycles and gynecologic conditions, including infertility, menopause, and polycystic ovary syndrome. See the latest updates . Apple Hearing Study: The Apple Hearing Study is a partnership between the University of Michigan and Apple to study sound exposure and its impact on hearing health. This groundbreaking study helps advance our understanding of how hearing could be impacted over time by exposure to sound at certain levels. The study data is also being shared with the World Health Organization as a contribution to its Make Listening Safe initiative. See the latest updates . Apple Heart and Movement Study: Conducted in collaboration with the American Heart Association and Brigham and Women’s Hospital, the Apple Heart and Movement Study explores factors that affect heart health and potentially cause deterioration in mobility or overall well-being, in an effort to promote healthy movement and improved cardiovascular health. By collecting heart health, workout, mobility, and activity data from Apple Watch and iPhone users, as well as survey data, this study will provide insights on heart health and potential early warning signs in ways that were not possible before. See the latest updates . Partnering with the medical industry Our technology gives healthcare providers the tools they need to work effectively within hospitals and connect remotely with patients. Apps on iPad, iPhone, and Apple Watch can help medical professionals deliver personalized care. We have seen how our technology can also empower clinicians to be more mobile, leading to time savings and more time spent taking care of patients. Our devices are designed to protect patient data yet remain accessible and easy to use across providers. The result is care that becomes more efficient, more personalized, and ultimately, more human. Learn more about how our products support medical professionals . Caring for customers At Apple, we want to create products and services that enrich people’s lives. To us, that means making the best, not the most, and only building things that make us proud. A world-class experience We’re motivated by creating the best user experience through our products and in every interaction with our customers. We focus on breakthrough technologies and innovative features that set us apart and keep people coming back to Apple. Consumer surveys have consistently shown high satisfaction ratings for our revolutionary products, including iPhone (97 percent or higher), Mac (over 87 percent), iPad (93 percent or higher), and Apple Watch (90 percent or higher). 21 Support through retail Our focus on our customers extends to a retail experience that puts the people we serve at the center of everything we do. Our retail teams inspire our customers to discover, learn about, and choose Apple products, services, and accessories by delivering a personalized experience like no other. Apple Specialists in our retail stores and contact centers help customers find the right products with one-on-one shopping and support sessions — in person, over the phone, or via chat. Today at Apple and Online Personal sessions help customers learn how to get the most from their devices and take their creativity further. Investigator Support Program Inspired by the innovative ways the research, clinical, and developer communities leverage our products and platforms, we launched the Investigator Support Program that provides researchers with opportunities to receive Apple Watch to include in their research study. We have witnessed firsthand how researchers and clinicians are able to accomplish even more with the addition of Apple Watch to their research and care programs, and through this program we hope even more people can have the same kind of success. Currently, studies around the globe are integrating Apple Watch into their research across heart, mobility, activity, and other focus areas. See more about the program . On iPhone, Walking Steadiness is an industry first, providing insight into fall risk by leveraging important mobility data as users walk with their iPhone, directly within the Health app. The Health app provides a consolidated view of users’ health information — data from iPhone, third-party apps, and Apple Watch. And since introducing the Health Records feature in 2018, it is supported at over 800 healthcare institutions with over 12,500 care locations across three regions — the U.S., Canada, Appendix Governance Communities Suppliers Customers Our People Environment Introduction Apple’s 2022 ESG Report 55
Apple’s Education team works to ensure that students, teachers, and parents have the best learning tools for the classroom. For business customers, the dedicated teams in every Apple Store provide the advice, pricing, and support small businesses need in our communities. We work closely with Apple Authorized Resellers, like carriers, and retailers to enhance the customer shopping experience beyond our own retail locations and the Apple website. Listening and improving To help ensure quality, we continually monitor customer feedback, assess key drivers, and leverage analytics to improve the customer experience. Customer feedback is shared with team members as well as leaders, so that everyone understands their impact and is focused on making the customer experience the best it can possibly be. Throughout the pandemic, our retail teams continue to work diligently to be flexible through ever-changing operational challenges, as well as health and government guidelines. All the while they keep the focus on helping our customers, and as a result our Store teams earned our highest-ever customer satisfaction scores. As we continue delivering exceptional products, we remain committed to high-quality standards and transparent communication with customers. We maintain a System Status page to actively report on identified system issues and offer service programs to address hardware issues. We encourage our customers to contact us with questions, provide feedback, or request support. As just one example, learn more about how we responded to customer feedback on AirTag. Safety for children and families Families love iPhone, iPad, Mac, Apple Watch, and Apple TV because they are some of the most powerful tools ever made for learning, exploring, and staying in touch. We’re committed to providing tools that let caregivers know, and feel good about, what kids are doing. A range of features offer flexibility to track app usage, set limits on screen time and community, choose which apps children can use, and manage the content and websites they can access. Features also help protect kids from what they see and send. With the latest versions of iOS, iPadOS, and macOS, families can set up kids’ devices to show warnings when receiving or sending images containing nudity. The image is blurred, and the child gets an alert along with Building durability and repairability into our designs Designing and building durable hardware is core to delivering this customer experience. We assess our designs against our strict durability standards through testing methods that mimic realistic conditions in which our customers use their products. Every aspect of our products is thoroughly assessed by engineers in our Reliability Testing Lab who measure the performance of materials, components, and fully assembled products. We continue to design our products with features that enhance repairability and durability. For instance, we’ve continued to increase the number of repairable modules on iPhone while also adding durability features like water resistance. Making repairs more convenient If a repair is needed, we believe our customers should have convenient access to quality repair services to get their product back up and running as quickly as possible. Over the past three years, we’ve nearly doubled the number of service locations with access to genuine Apple parts, tools, and training, offering more ways for consumers to get repairs. These repair options include Apple Store locations, Apple Authorized Service Providers (AASP), participating Independent Repair Providers, mail-in repair centers, or onsite service and, starting in 2022, Self Service Repair. Our repair network has grown to over 5000 AASP locations and over 3000 Independent Repair Providers around the world — in addition to our 500 Apple retail locations. Visit our Families site and Child Safety site to learn more The App Store: A safe place for kids The Made for Kids section on the App Store is carefully curated to be a great space for children. And we review apps to help make sure they do what they say they do. In Content Restrictions, you can also tap an age range and, just like that, your kids can buy or download only apps appropriate for them. Messages can warn children when receiving or sending photos that contain nudity. helpful resources and the option to message someone they trust for help. End-to-end encryption is maintained, and Apple doesn’t get access to your messages. Apple has also expanded guidance in Siri, Spotlight, and Safari Search by providing additional resources to help children and families stay safe online and get help with unsafe situations. For example, users who ask Siri how they can report child exploitation will be pointed to resources for where and how to file a report. Product longevity We believe long-lasting products are best for the environment. We also believe products that minimize the need for repair or replacement encourage our customers to come back to Apple. We design our products with this goal in mind. Appendix Governance Communities Suppliers Customers Our People Environment Introduction Apple’s 2022 ESG Report 56
Apple’s Safety Compliance Policy defines procedures to monitor products in the field and investigate potential safety issues. This policy requires escalation of safety issues to Apple management and timely reporting to regulators where necessary. It also requires mechanisms for employees to confidentially report safety or compliance concerns, as well as training for employees on how to address the concerns. Our Product Integrity and Legal teams are responsible for ensuring that Apple’s Safety Compliance Policy is followed. We collect devices for refurbishing and reuse through several programs, including Apple Trade In, the iPhone Upgrade Program, AppleCare, and our corporate Hardware Reuse Program. In fiscal year 2021, we sent 12.2 million devices and accessories to new owners for reuse. Our Trade In program extends to 25 countries, providing customers with options for product end-of-life — to access the value of their current device if they want to upgrade to a newer model, or to recycle their devices for free. Product safety We design our products to make sure they’re safe for anyone who assembles, uses, or recycles them. Commitment to safety The well-being of those who design, make, use, and recycle our products is a priority for Apple, which is why we’re committed to using safer materials to create safer products. We assess the health and safety of all our products, during every stage of their life cycle — from early concept development, through use, service, and repair, to recycling. During the design and prototyping process, cross-functional Apple teams analyze potential failures and their effects from a quality and safety perspective. The results drive product design improvements and manufacturing process controls. Apple is committed to helping customers understand how to safely use Apple products. Apple’s product user manuals include important safety and handling information, and Apple offers additional topical content to provide tips and help customers understand features. For example, Apple published articles to make sure customers with potential skin sensitivities understand what materials are used in our wearable products. We also explained how to clean and disinfect Apple products, and provided guidance on keeping Apple products with magnets a safe distance from medical devices. Safety compliance Apple’s products are designed, tested, and certified to comply with international and regional safety standards. They also meet our own specifications, which often go above and beyond what is required. For example, Apple’s Regulated Substances Specification restricts the use of certain chemical substances in Apple products, and we apply rigorous additional controls for materials that may have prolonged contact with the skin. Components that are critical to safety are subject to enhanced requirements and additional supplier audits. Apple tracks customer reports of potential product safety issues, and employees are trained on how to handle, document, and properly escalate such reports. Apple investigates reported incidents and also analyzes products for potential safety issues. In the rare event that Apple determines a product poses a potential safety risk, we take action to recall the product, which includes notifying customers and helping customers have their products repaired, replaced, or refunded. Apple products also help customers in emergencies and in caring for their well-being, with features like emergency calling, fall detection, medical ID, and hearing health notifications. Keeping our products current with software updates Apple provides free software upgrades to improve our customers’ experience and help our products last longer. Our customers can count on the latest software features and security updates to their existing devices for years. We continually improve the operating systems that power our products and engineer each software release to run seamlessly on all supported devices. Extending the life of products and parts through refurbishment and reuse We can lower the impact each device has on the environment — including carbon intensity per year of life — by finding ways to refurbish and reuse these products. And by building our products to serve more than one owner and encouraging customers to exchange devices for an upgrade, we extend the life of our products. Now available: Self Service Repair Self Service Repair became available in April 2022, providing repair manuals and genuine Apple parts and tools through the Apple Self Service Repair Store . Self Service Repair is available in the U.S. and will expand to additional countries, beginning in Europe, later in 2022. The new online store offers more than 200 individual parts and tools, enabling customers who are experienced with the complexities of repairing electronic devices to complete repairs on the iPhone 12 and iPhone 13 lineups and iPhone SE (3rd generation). We also released “ Expanding Access to Safe, Reliable, and Secure Service and Repair ,” which details Apple’s approach to designing long-lasting products and increasing access to repairs. Appendix Governance Communities Suppliers Customers Our People Environment Introduction Apple’s 2022 ESG Report 57
Communities In this section Our approach 59 Racial Equity and Justice Initiative 60 Education 62 Affordable housing initiative 64 Corporate donations 65 Employee giving 67 Job creation 68 A force for good. Appendix Governance Communities Suppliers Customers Our People Environment Introduction Apple’s 2022 ESG Report 58
Our approach At Apple, we’re committed to leaving the world better than we found it. That means supporting communities with global and local initiatives, investments, and donations that combat inequity, expand access to opportunity, and help respond to urgent needs. Many of these initiatives also contribute to the UN Sustainable Development Goals (see Appendix page 75 ). Some of our largest community initiatives address racial equity and justice, education, affordable housing, and other critical issues where we can use our presence, expertise, and resources to make a difference. Through these efforts, we foster open communication with local community partners and stakeholders to understand dynamic challenges in order to drive meaningful impact. Apple supports these initiatives through program development, donations to nonprofit partners, and values-based investments, which go beyond financial returns to promote positive social and environmental impact. People at Apple don’t just serve our communities — we’re a part of them. That’s why everywhere Apple is, we feel a deep sense of responsibility to be a force for equity and opportunity, to protect the planet we share, and to help our users get the most out of their technology. Whether we’re working with educators, nonprofit leaders, or the global developer community, we believe in using our technology, our resources, and our voice to help people make a difference in their communities. We can achieve so much more when we work together — with our neighbors — to build a better future for all. $3B+ Since FY18, we’ve committed over $3 billion in strategic, values-based investments and community donations. Total corporate donations (excluding values-based investments) FY21: $250M+ FY20: $250M+ FY19: $190M+ In total, we’ve committed over $3 billion toward corporate donations and values- based investments since fiscal year 2018. Our corporate donations alone were over $250 million in fiscal year 2021. Fulfilling our commitments to our communities requires teamwork across the entire company. Lisa Jackson, our Vice President for Environment, Policy and Social Initiatives is responsible for Apple’s environmental initiatives, community education programs, product accessibility, and community investment, and she leads Apple’s Racial Equity and Justice Initiative. Community initiatives are managed through cross-functional collaboration with teams across Apple, including Treasury, People, Real Estate and Development, Legal, and Education. We also know that we can impact communities around the world by creating and sustaining local jobs. As our teams continue to grow, we’re proud to foster innovation, opportunity, and economic support across the globe. Through our values-based investments, we see an important opportunity to continue to invest our capital for good — often through multiyear commitments in which Apple plays a substantive role in the project development. Our affordable housing initiative, Racial Equity and Justice Initiative, clean energy investments, and the Restore Fund (see page 17 ) are all examples of initiatives in which values-based investments play a significant role. Our corporate donations support work undertaken across the company to address society’s toughest problems. We donate to nonprofits and other organizations with which we partner to support specific initiatives, as well as directly to organizations supporting our objectives to accelerate social change, strengthen communities, and amplify Apple’s values. We empower employees to contribute to the causes they care about, and we multiply their efforts through matching their donations. Appendix Governance Communities Suppliers Customers Our People Environment Introduction Apple’s 2022 ESG Report 59
Apple is partnering with California State University, Northridge’s Global HSI Equity Innovation Hub as part of our Racial Equity and Justice Initiative. Racial Equity and Justice Initiative We have an urgent responsibility to help dismantle systemic racism and support opportunities for Black, Hispanic/Latinx, and Indigenous communities. Our Racial Equity and Justice Initiative (REJI) is focused on three key areas: expanding access to education, supporting criminal justice reform, and removing economic barriers for communities of color. The initiative began in June 2020 with an initial commitment of $100 million, followed by an additional $30 million commitment in August 2021, to help elevate equity-focused solutions across the academic and advocacy landscapes, and a $25 million commitment in May 2022 to expand access to capital for community financial institutions supporting communities of color. REJI has spurred new partnerships and projects while inspiring us to weave a focus on equity and justice into everything we do — including our existing community programs and business operations. Education: Greater access and greater opportunity REJI builds on our long-standing commitment to education and works hand in hand with our Community Education Initiative ( page 62 ). Historically Black Colleges and Universities (HBCUs), Hispanic-Serving Institutions (HSIs), and Tribal Colleges and Universities (TCUs) are critical leaders in expanding educational access, as are community colleges and other centers of learning. To support their continued leadership, Apple is collaborating with minority- serving institutions on programs designed to build a more inclusive workforce. Propel Center: In January 2021, Apple, in collaboration with Southern Company and a range of community stakeholders, helped launch the Propel Center, a global innovation and learning hub for the HBCU community. The Propel Center supports HBCU students and faculty through a robust virtual platform, a physical campus in the historic Atlanta University Center, as well as on-campus activations at partner institutions. The center is designed to support the next generation of diverse leaders, providing innovative curricula, technology support, career opportunities, and fellowship programs. Experts from Apple support the development of curricula and provide ongoing mentorship and learning support. HSI Innovation Hub: In August 2021, we announced our partnership with California State University (CSU) Northridge’s Global HSI Equity Innovation Hub, which aims to transform HSIs throughout the CSU system and the U.S. in order to increase student success and equip Latinx and other students from historically underserved groups with skills for high- demand careers in STEM. Apple’s commitment will support the initiative’s main location on the California State University, Northridge campus in Los Angeles, and provide Apple technology, design support, and thought partnership as the project expands. HBCU C 2 Initiative: In partnership with Tennessee State University, Apple supports the HBCU C 2 initiative, launched in 2019 to empower and support HBCUs to bring coding and creativity experiences to their communities, using Apple hardware and its Everyone Can Code and Everyone Can Create curricula. In 2021, we announced the expansion of the program to 11 new schools, bringing the total number of community coding centers and regional hubs on HBCU campuses to 45 across the U.S. In addition to donating equipment and professional development services, Apple provided funding to support program development. Taking Action on Racial Equity and Justice series: This set of conversation guides and learning-based challenges on race and inequality issues provides a framework and resources for educators, community leaders, and families to use with young people. Criminal justice: An unfair system is unfit for everyone The criminal justice system disproportionately fails communities of color. We support organizations working to end mass incarceration and defend civil rights. Apple has donated to organizations that support racial justice, including the Anti-Recidivism Coalition, the Council on Criminal Justice, the Innocence Project, The Last Mile, Recidiviz, The Sentencing Project, and the Vera Institute of Justice. These commitments will help to promote racial, ethnic, economic, and gender justice, as well as the safeguarding of youth, and work to end the practice of extreme sentences in the criminal justice system. Appendix Governance Communities Suppliers Customers Our People Environment Introduction Apple’s 2022 ESG Report 60
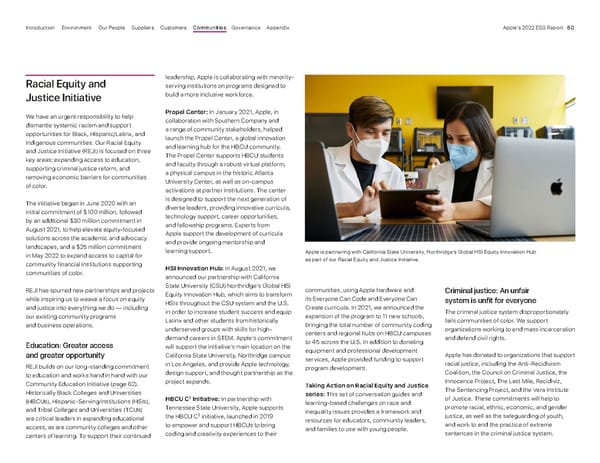
To further advance our work in this area, Apple is also partnering with a number of community colleges to implement programs that are helping incarcerated and paroled individuals learn new skills and work to prevent recidivism. As one example, at Houston Community College in Texas, Apple is contributing funding and technology to a program that supports individuals on parole and probation to prepare for career and college readiness. Economic empowerment: For today’s entrepreneurs Black, Hispanic/Latinx, and Indigenous business owners deserve a fair shot and a fair share. Through mentorship and financial investments, we back founders who have historically been cut out of opportunities to access capital in order to achieve economic prosperity. Since 2021, we’ve announced $75 million in financial commitments to support Black, Hispanic/Latinx, and Indigenous entrepreneurs, businesses, and financial institutions. These include $25 million in venture capital investments in three Black- and Hispanic/ Latinx-founded firms — Harlem Capital, VamosVentures, and Collab Capital. And $25 million of our commitment is to Siebert Williams Shank’s Clear Vision Impact Fund, which works to increase loan capital for small- and medium-size minority-owned businesses and underserved communities. We also committed $25 million to expand access to capital for financial institutions supporting communities of color in historically underserved markets across the U.S. through CNote’s Impact Cash product. Through our Impact Accelerator, we’re taking steps to help better position businesses led by people of color to benefit from investments in green technology and clean energy, bringing together our commitments to equity and the environment. Launched in 2020, the Impact Accelerator is a three-month virtual program that includes customized training along with access to Apple expert mentors and a growing alumni community — to expand participants’ opportunities within Apple’s supply chain. Read more about the first class of the Impact Accelerator on page 18 . We are also supporting economic empowerment for communities of color through two of our existing programs, Entrepreneur Camp (see page 64 ) and Apple Developer Academy (see page 63 ). In early 2022, Entrepreneur Camp welcomed its first cohort of Hispanic/Latinx founders. And in October 2021, we partnered with Michigan State University to open an Apple Developer Academy in Detroit, a city with a vibrant Black entrepreneur and developer community and over 50,000 minority-owned businesses. Our work to provide access and opportunity to communities of color extends to our own business activities, including supporting inclusion and diversity among our employees (see page 23 ) and increasing Apple’s spend with diverse suppliers (see page 45 ). African American Male Teacher Initiative at Huston-Tillotson University Currently, only 2 percent of all U.S. teachers are Black men, something the program at Huston-Tillotson is working to change. When Black students are taught by a Black teacher, they’re significantly more likely to graduate from high school and consider attending college. To support Huston-Tillotson University’s African American Male Teacher Initiative, Apple is providing scholarships for the program’s students, called Pre-Ed Scholars, as well as hardware, software, and professional development courses for students and faculty. Apple’s multiyear partnership with Huston-Tillotson complements other engagements we’ve established through our Racial Equity and Justice Initiative, working alongside the HBCU community to develop curricula and provide new learning and workforce opportunities. Using FaceTime, Rhys Richard chats with his music professor, Dr. Samuel Rowley, as part of his coursework at Huston-Tillotson University. Appendix Governance Communities Suppliers Customers Our People Environment Introduction Apple’s 2022 ESG Report 61
Education Access to education is a human right, and we work hard to ensure that our resources are used to uplift communities around the world, creating opportunities for educators and students to gain coding skills and unlock creativity. Our efforts also support the UN Sustainable Development Goals, including goal 4 on access to education, goal 8 on decent jobs, and goal 10 on reducing inequality (see Appendix page 75 ). Community Education Initiative Inspired by the impact of our ConnectED initiative and programs like Everyone Can Create and Everyone Can Code, we launched our Community Education Initiative (CEI) in 2019 with a focus on expanding learning opportunities in communities that are historically underrepresented and underresourced in technology. CEI partners with K–12 and higher education institutions, community-based organizations, and nonprofits to bring coding, creativity, and workforce development opportunities to educators and learners of all ages. CEI aims to build knowledge and skills for high-demand, high-growth technical careers alongside communities that have been traditionally underresourced to advance education equity. Our support includes hardware grants, monetary grants to support scholarships and programming, resources for educator training, curriculum development, and employee engagement opportunities. Through educational partnerships across the U.S., we’ve been able to reach tens of thousands of students and educators who might not have had access to our technology and education resources. As of April 2022, we’ve supported and partnered with 147 education institutions and nonprofit organizations — including 47 HBCUs — in over 500 different locations across 36 states in the U.S. and four locations across the UK since the initiative launched in 2019. Grounded in the positive relationships that we’ve established with these organizations, we’re working to deepen our impact in three areas: Educator development: We’re providing educator development and training opportunities to build the knowledge and skills that educators need to teach coding in underrepresented communities through Teacher Coding Academies and the CEI Learning Series. These programs allow hundreds of teachers from around the U.S. to meet virtually and in person to share best practices for integrating and teaching coding and creativity concepts. Through our Academies and CEI Learning Series, we’re connecting CEI educators with Apple Distinguished Educators from all around the world. Apple Distinguished Educators lead and participate in learning workshops, along with our Apple Professional Learning Specialists. Out-of-school-time learning: We’re partnering with nonprofits, NGOs, and community-based organizations that provide out-of-school-time learning experiences to increase exposure, awareness, and experiences through coding and creativity. A new collaboration between Apple and Boys & Girls Clubs of America will bring coding with Swift to tens of thousands of young learners across the country. Appendix Governance Communities Suppliers Customers Our People Environment Introduction Apple’s 2022 ESG Report 62
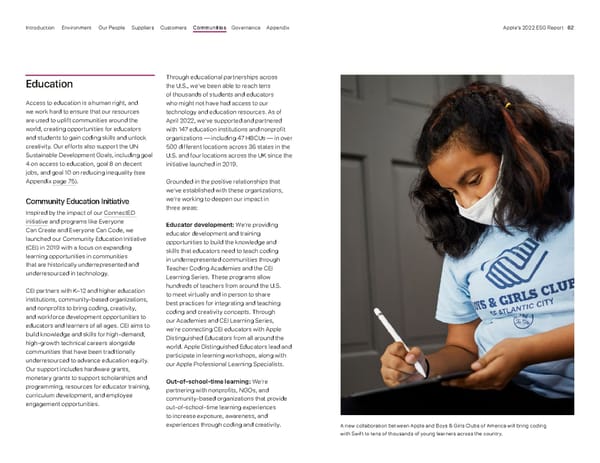
Support for minority-serving institutions: We’re especially focused on expanding our engagement with minority-serving institutions, including HBCUs, HSIs, and TCUs, as well as community colleges and public schools in underserved communities. In 2021, many of our CEI projects were undertaken in support of REJI’s education focus ( page 60 ). For example, in December 2021, Apple and Boys & Girls Clubs of America launched a new collaboration to bring coding with Swift to tens of thousands of students across the U.S., building on Apple’s existing partnership with the organization to use iPad and Apple’s free Everyone Can Code curriculum. And in Canada, we’ve supported learning for Indigenous people through an app- based literacy assessment tool, which drove significant literacy outcomes, encouraged a community-based approach, and provided learning activities for children to build oral skills. In addition, we partnered with the Assembly of First Nations on an interactive collection of Apple Books that explore Canadian history from an Indigenous perspective. Apple Developer Academy As the iOS app economy continues to grow, we’re investing in educational programs and opportunities that prepare learners of all ages and backgrounds for the jobs of the future. In 2013, we started the Apple Developer Academy to empower entrepreneurs, creators, and coders by helping them cultivate the skills necessary to pursue new career opportunities. The program focuses on communities with high youth unemployment and is open to anyone, regardless of academic background or experience. We seek to spark interest among the next generation of developers and bring diverse representation to the growing app ecosystem, particularly among women and individuals from underrepresented communities. A larger and more diverse developer community helps create more new ideas and businesses, and it gives more people access to employment and opportunities for economic mobility. Some participants are also undertaking practical projects in collaboration with NGOs to help use technology to solve challenges related to their missions, which amplifies impact even further. We offer two distinct training programs as part of the Apple Developer Academy: 1) 30-day foundations courses that cover specific topic areas, including an introductory course for those considering app development as a career path, and 2) a more intensive academy program of at least 10 to 12 months that dives deeper into coding and professional skills. In addition to partnering with institutions, the academy works closely with employers to provide direct pathways to career opportunities. Participants also have access to a strong alumni network as they move forward in their careers. As of April 2022, we have 23 foundation programs and 17 academy programs across the globe working in close collaborations with institutions that provide content and experience opportunities. The programs are based in seven countries with over 2600 participants in total in calendar year 2021 — and more than 15,000 since the inception of the Apple Developer Academy in 2013. 22 On average, job-seeking graduating students receive three job offers, and 92 percent of alumni are employed. 23 We also see high rates of students staying in the industry. For example, 62 percent of students are still working in iOS coding and design positions seven years after graduating from the Brazil program, and 79 percent of Indonesian alumni are still involved in app development on Apple platforms. 24 We’re also making progress on our commitment to support underrepresented groups. In 2021, 40 percent of academy students were female, a 63 percent year-on-year increase, and 39 percent came from non-STEM backgrounds, a 56 percent year-on-year increase. In the foundation programs, 34 percent of students were female in 2021. Aristide Lauga (left), from France, is a new student at the Apple Developer Academy who looks forward to pursuing his newfound passion for coding. Giada Di Somma (right) graduated from the academy in 2017 and now works full-time as a UX design lead in Milan. Appendix Governance Communities Suppliers Customers Our People Environment Introduction Apple’s 2022 ESG Report 63
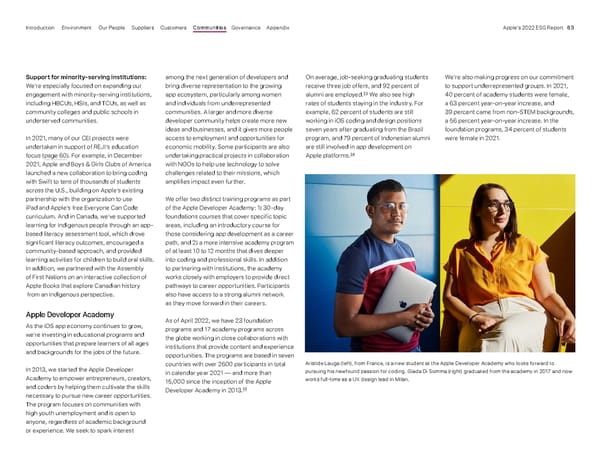
Located in downtown Detroit, the Apple Developer Academy space is designed to facilitate collaboration and engagement, preparing students for success in the iOS app economy. In 2021 and early 2022, the Apple Developer Academy has continued to grow with these new developments: • The first U.S. Apple Developer Academy, launching in Detroit in October 2021 as part of our REJI initiative (see page 60 ) • The first women-dedicated Apple Developer Academy, launching in Riyadh, Saudi Arabia, in November 2021 • The first Korean Apple Developer Academy, launching in Pohang in March 2022 and serving 200 students from across Korea • A new foundation program location in France • A significant new investment in Naples, Italy, in September 2021, expanding academy programming through 2025 and launching a new alumni resource program Entrepreneur Camp Research shows that founders from underrepresented communities face unique challenges, especially when starting and leading technology companies. We created Apple Entrepreneur Camp with the goal of supporting these founders and their app-driven businesses as they build the next generation of cutting-edge apps, and to form a global alumni network that encourages the pipeline and longevity of underrepresented founders and developers in technology. The program includes cohorts for female, Black, and Hispanic/Latinx founders and developers from underrepresented communities. During these app-focused technology labs, participants receive one-on-one code-level guidance on their apps from Apple experts and engineers, as well as support, inspiration, and insights from top Apple leaders. The core programming is based on Developer Labs at WWDC, where participants work on improving a specific app in bespoke, one-on-one sessions with Apple engineers and experts. The program also includes community sessions, networking, and opportunities for ongoing support. After the lab concludes, participants become part of a growing community of other exceptional alumni who can help them build their business. Apple Entrepreneur Camp alumni have gone on to secure major funding rounds, garner numerous awards and accolades, and significantly expand both their teams and app users worldwide. Alumni apps are featured on the Entrepreneur Camp website . There have been 12 Entrepreneur Camp cohorts since our first class of female founders and developers in 2019. Since the launch of REJI, we expanded to hosting cohorts for Black founders in 2021 and Hispanic/Latinx founders in early 2022. Participants have also received additional guidance from Harlem Capital, Collab Capital, and Vamos Ventures as part of REJI (see page 61 ). Entrepreneur Camp alumni hail from 26 countries, and we continue to focus on expanding our outreach to underrepresented founders and developers around the world. Affordable housing initiative Through our affordable housing initiative, announced in 2019, we’ve made a comprehensive $2.5 billion commitment to address the housing availability and affordability crisis in California. Together with government and community-based organizations, the initiative has sought to jump-start long-term developments, help first-time buyers purchase homes, and support new housing and related programs to alleviate homelessness. As of July 2021, we’ve deployed more than $1 billion supporting projects and communities in more than 25 counties across California. 92% Apple Development Academy alumni employment rate* 40% female and 39 percent non-STEM students in 2021 academy program 34% female in 2021 foundations program * As of our last alumni survey in December 2021 Appendix Governance Communities Suppliers Customers Our People Environment Introduction Apple’s 2022 ESG Report 64
In partnership with the California Housing Finance Agency (CalHFA), Apple has provided mortgage and down payment assistance to thousands of first-time buyers with low and moderate incomes, with additional benefits for teachers, veterans, and firefighters. Apple has also partnered with CalHFA to launch an affordable housing investment program, the first of its kind in California, which has increased the availability of funding to develop and build very low- to moderate-income housing at a lower cost. And we’re supporting several new affordable housing projects funded through our partnership with Housing Trust Silicon Valley. Many of the new units are reserved for veterans, the homeless or formerly homeless, and residents with developmental disabilities. In 2022, residents moved into the new Veterans Square development in Pittsburg, California. The 30-unit building offers 100 percent free housing to local veterans, along with a community garden, courtyard, community room, on-site management, and other amenities and services. Apple’s affordable housing initiative also includes a partnership with Destination: Home, which has helped fund the construction of thousands of new units of affordable and supportive housing for the most vulnerable populations across Silicon Valley. With our support, Destination: Home has also been able to expand its Homelessness Prevention System to keep thousands of families from losing their homes each year. Learn more about this initiative. Corporate donations Whether it’s racial injustice, food insecurity, a natural disaster, or a health emergency, our community giving program is agile enough to allow us to respond in a timely, efficient, and effective way. We support nonprofit organizations in a variety of ways, including financial resources, Apple technology, and expertise from our teams. Accelerating social change We’ve designed our corporate donations to address immediate needs and to build community resilience. Several initiatives described on previous pages fall into this area of focus, including our REJI commitment to further racial equity and justice (see page 60 ) and addressing housing scarcity and homelessness in California (see page 64 ). In 2021, Apple marked its 15th anniversary of partnering with (RED) to fight HIV/AIDS in sub- Saharan Africa. Since 2006, Apple customers have helped raise nearly $270 million to fund prevention, testing, and counseling services for people impacted by HIV/AIDS, as well as programs to support this community during COVID-19. Apple-supported grants have enabled care and support services for over 11 million people, provided over 192 million HIV tests, and allowed over 13.8 million people access to lifesaving antiretroviral treatments. By redirecting donations to the Global Fund’s COVID-19 Response at the onset of the pandemic, Apple customers were able to help fund programs that mitigated the impact of COVID-19 on existing HIV/AIDS programs and rural clinics were able to purchase motorbikes that were used to transport samples to laboratories in order to expedite test results for immunocompromised people, such as those living with HIV. Strengthening local communities We believe we can have an impact on communities by supporting grassroots organizations that work directly with local stakeholders. We focus our donations on programs that are building strong communities and empowering creatives in the places where we live and work. In fiscal year 2021, we provided 79 small grants across seven Part of the Global Fund’s broader investment in health system strengthening in Zambia includes getting COVID and HIV tests and blood samples safely delivered to labs. Access to advanced testing equipment is limited so it’s critical to have efficient transport services in place so that samples can get consistently and swiftly delivered in time for processing. Enos Mumfwa is pictured here with his motorbike about to deliver a cooler of samples. Credit: Adam Sjoberg/(RED) Appendix Governance Communities Suppliers Customers Our People Environment Introduction Apple’s 2022 ESG Report 65
countries. The grants provide support for arts and digital media education programs for youth and young adults, education and workforce development organizations, and Black-, Hispanic/Latinx-, and Indigenous-led organizations that are grounded in advancing environmental justice and advocating for communities most impacted by climate change and environmental disparities. Some examples of grant recipients include: • Outdoor Afro, which is working to preserve and protect our environment and connect with Black communities and leaders in Oakland, California, and around the country. • The African American Youth Harvest Foundation (AAYHF) in Austin, Texas, which provides community-based resources for African American and low-income youth and families. • Nasc, which works to support migrants and refugees in Ireland and offers a number of different resources, including the Gateway program for women. In partnership with nonprofits, Today at Apple Creative Studios encourages underrepresented creators to pursue their creative ambitions across music, design, and the visual arts. In the studio, they’ll collaborate with mentors and peers, and learn from top-tier artists as they build their body of work. In fiscal year 2021, Today at Apple partnered with 23 nonprofits in nine cities around the world, reaching more than 4000 creators with our programming. This summer, Creative Studios will host programs in 13 cities with over 28 nonprofit partners. Amplifying Apple values We’re always looking for ways to support efforts that align with our Apple values. The following are just a few examples of this support. Malala Fund: In 2018, Apple became Malala Fund’s first Laureate partner, supporting the organization’s work with local advocates and teachers in countries where girls face significant education challenges. The fund champions every girl’s right to 12 years of safe, free, quality education. Apple also assists with technology, curriculum, and research into policy changes related to girls’ education. Apple’s 2021 grant invested in six Education Champion projects in Brazil, India, and Nigeria, impacting nearly eight million students. Thurgood Marshall College Fund: To continue building a diverse talent pipeline, Apple has a long-standing commitment with the Thurgood Marshall College Fund (TMCF). In 2021, Apple and TMCF expanded the partnership to include the Engineering and Innovation Scholars Program and the New Silicon Initiative at HBCUs. Apple Scholars Program: In partnership with a variety of organizations supporting underrepresented communities, the Apple Scholars Program provides scholarship support, professional development and experiential learning opportunities to students from underrepresented backgrounds interested in research and development (R&D). In 2022, Apple welcomed its first cohort of Apple Scholars, representing over 30 colleges and universities across the country. Today at Apple Creative Studios D.C. This Apple retail program featured a partnership with Shout Mouse Press, a nonprofit writing and publishing program dedicated to elevating overlooked voices. In partnership with Shout Mouse Press and Latin American Youth Center, Today at Apple Creative Studios D.C. supported a group of teens who authored a collection of bilingual children’s books with themes of cultural celebration, grief, family, and friendship. The program equipped the authors with Apple technology, including iPad Pro, Apple Pencil, and Magic Keyboard, so they could continue to share their stories and explore new media for creative expression in illustration and audio. For many of the students, who had neither imagined they’d write books nor worked in these apps prior to the program, the sessions sparked inspiration for future endeavors and opened doors to new modes of storytelling. Through an Apple grant, Shout Mouse Press was also able to further support the students’ post-program journey with scholarship funding for authors applying for college and post-secondary programs. The books these students authored can be enjoyed and downloaded for free on Apple Books. Joy Ugwu (pictured), a participant of Creative Studios D.C., co-authored a book with fellow participant Tseganesh Chala. Appendix Governance Communities Suppliers Customers Our People Environment Introduction Apple’s 2022 ESG Report 66
Environment programs: We’re supporting efforts to restore areas within the Amazon forest that are under threat from forest fires. The Alliance’s reforestation work also includes training and outreach programs to empower local communities in protection and governance practices, while developing and strengthening livelihood models that support economic development. We also support the National Park Foundation in the U.S., which has provided more than 1,000,000 students with meaningful national park experiences since 2011, encouraging young people to connect with the natural world. In addition, we’re backing the Foundation’s work to advance outdoor equity by eliminating barriers and promoting access. And in the Chyulu Hills region of Kenya, we’re supporting community empowerment programs for Maasai smallholder farmers, including educational scholarships for local students as well as pastureland management training. Crises and natural disasters: We also mobilized funding for a number of unexpected events in fiscal year 2021 and early 2022, including flooding in Australia, China, Eastern and Western Europe, and the U.S; tornados, hurricanes, and significant storms in the U.S.; support for COVID-19 in several countries around the world; the typhoon in the Philippines; wildfires in Canada and the Western U.S.; the earthquake in Haiti; and humanitarian support in Afghanistan. Volunteers from retail participated in a gardening activity that included seeding, weeding, mulching, composting, planting, and harvesting to create micro farms and edible gardens in Orlando, Florida, in honor of Earth Day 2022. Responding to the war in Ukraine We are deeply concerned about the ongoing war in Ukraine and have provided support in several ways. We made corporate donations to humanitarian efforts helping people on the ground, including to relief agencies and non-profits, such as World Central Kitchen, Doctors Without Borders, and the International Rescue Committee. We facilitated contributions to UNICEF — which is supporting children and families affected by the war — through a tile on our website and services like Apple Music and the App Store. We also offered our employees opportunities to donate and volunteer, including holding a 2-to-1 matching campaign to amplify employee donations to organizations providing shelter, food, and medicine to those affected by the war. Employees also took part in virtual activities, including providing language support to refugees, recording video messages and making cards for children, and supporting the Missing Maps Project, which helps map vulnerable places, like Ukraine, so that NGOs and individuals can use the maps and data to better respond to crises. At the same time, we have worked to support our teams in Ukraine and across the region. In Ukraine, we contacted every employee, assisting them and their families in any way we could. We are also offering support to our Ukrainian team members located outside of the country, as well as any employee who needs support. Employee giving Our Employee Giving program provides opportunities for employees to contribute to the causes they care deeply about with the support of Apple. From volunteering to donations to smaller individual actions, Apple is committed to giving, hand in hand with our team members. Our program promotes charitable giving to qualified organizations by matching donations of time, money, eligible stock, or Apple products. In 2021, Apple’s Employee Giving program celebrated its 10th anniversary, having raised nearly $725 million for 39,000 organizations worldwide — with over $120 million distributed to organizations around the globe in 2021 alone. 25 The funds raised through Apple’s Employee Giving program include the work of 68,000 employee volunteers who have logged almost 2 million volunteer hours since 2011. Appendix Governance Communities Suppliers Customers Our People Environment Introduction Apple’s 2022 ESG Report 67
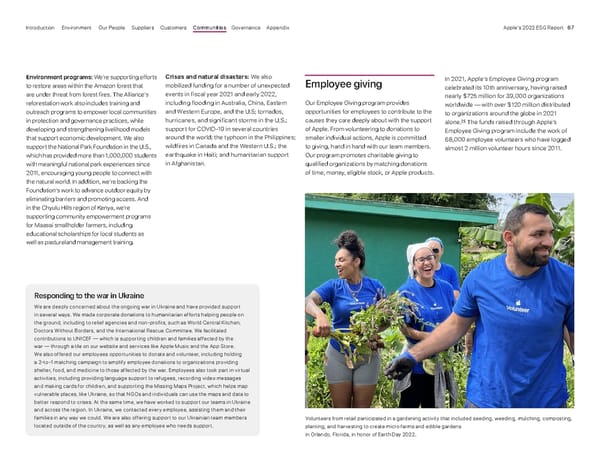
45,000+ employee donors in FY21 Nearly $725M raised for nonprofit organizations through Employee Giving since 2011 Almost 2M employee volunteer hours since 2011. FY21: 256,000+ hours Giving time Apple makes a financial contribution for each hour volunteered with a qualified organization. Some of the ways employees give their time include lending skills in person or online, mentoring youth, and participating in outdoor cleanups or other local events with nonprofit organizations. Apple employees can also participate in the Global Volunteer Program, an in-role leadership experience that empowers employees to organize and lead volunteer activities for their colleagues in their communities. Giving a donation When our employees donate money, Apple matches their donations, on a dollar-for-dollar basis up to $10,000 per year per employee. That way, every contribution goes further, every act inspires another, and every effort is amplified. Apple matches donations year- round, but in times of greater need, we have often increased the match to 2:1 and the match cap up to $20,000 per employee. Job creation Apple supports millions of jobs in countries around the world, across North America, Europe, Asia, Central and South America, Australia, and Africa. In the U.S., Apple is one of the biggest job creators, and we continue to expand our commitment to fostering innovation and opportunity in the U.S. economy. We support 2.8 million jobs across all 50 states through direct employment, spending with U.S. suppliers and manufacturers, and the iOS app economy. In April 2021, Apple announced an acceleration of its U.S. investments, with plans to make new contributions of more than $430 billion and add 20,000 new jobs across the country over the next five years. This includes a new North Carolina campus, which will create at least 3000 new jobs in machine learning, artificial intelligence, software engineering, and other cutting-edge fields. Employees Apple has over 165,000 employees worldwide that span an increasingly wide range of roles, including hardware and software engineering, science, construction, manufacturing, retail, customer support, marketing, and design. Suppliers and manufacturers Apple has a supply chain that spans the globe, with manufacturing and assembly taking place around the world, including in the U.S., Europe, Asia, Central and South America, and Australia. From component manufacturers to logistics providers, Apple directly or indirectly supports hundreds of thousands of jobs, working with suppliers and businesses in all 50 states in the U.S. and every European country. These suppliers provide equipment, parts, and materials for all of our core products. Jobs in the iOS app economy Since the App Store launched in 2008, the iOS app economy has become one of the world’s fastest-growing sectors. The App Store ecosystem supports millions of jobs across the world, empowering entrepreneurs from Argentina and Alaska to Zimbabwe and beyond. In the U.S., it supports more than 2.2 million jobs, and in Europe, it supports another 2.2 million jobs. In January 2021, we launched the App Store Small Business Program, which benefits the vast majority of developers who sell digital goods and services on the App Store. The program cuts the App Store commission in half — to 15 percent — for small businesses that earned up to $1 million in proceeds during the previous year. The reduced commission means small entrepreneurs and app makers have more resources to create new jobs, expand their businesses, explore cutting-edge technologies, and pioneer new innovations that reach users around the world. Volunteers from retail in the San Francisco Bay Area participated in a food sort and packaging event at the San Francisco-Marin Food Bank. During the two hour shift, the team bagged a total of 700 bags of food, equaling 14,760 lbs. Appendix Governance Communities Suppliers Customers Our People Environment Introduction Apple’s 2022 ESG Report 68
Governance In this section Corporate governance 70 Ethics and compliance 71 Tax payments 72 Standards that raise the bar. Appendix Governance Communities Suppliers Customers Our People Environment Introduction Apple’s 2022 ESG Report 69
Across our different lines of business, Apple has developed internal systems and procedures for managing environmental, social, and governance topics, including engaging with external stakeholders (see page 77 ) to learn about their priorities and get their feedback, and to coordinate relevant projects and initiatives. Board oversight of risk management The Board believes that evaluating the executive team’s management of the risks confronting Apple is one of its most important areas of oversight. In carrying out this responsibility, the Board is assisted by each of its committees that considers risks within its areas of responsibility and apprises the full Board of significant matters and management’s response. Apple has an Enterprise Risk Management Program that is designed to identify, assess, monitor, manage, and mitigate Apple’s significant business risks, including financial, operational, compliance, and reputational risks. In 2021, key areas of focus included health and safety, environment, people, privacy and data security, supply chain and operations, and legal and regulatory risks, including antitrust matters. Apple conducts business ethically, honestly, and in compliance with applicable laws. We believe that how we conduct ourselves is as critical to Apple’s success as making the best products in the world. Our Business Conduct and Global Compliance policies are foundational to how we do business and how we put our values into practice every single day. Corporate governance Our corporate governance structure is designed to foster principled actions, informed and effective decision-making, and appropriate monitoring of compliance and performance, so that the long-term interests of shareholders are being served. Environmental, social, and governance (ESG) matters are overseen and managed at multiple levels within Apple. Board oversight of ESG Apple’s Board, assisted by its standing committees, has ultimate responsibility for oversight of significant risks affecting the company’s business, including environmental, social, and governance matters. Apple’s Board and its committees exercise oversight of our values and our people through review and discussion with management of progress relating to our values: accessibility, education, environment, inclusion and diversity, privacy, and supplier responsibility. Matters that benefit from specialized attention are reserved to certain committees. For example, the Audit and Finance Committee oversees our Green Bond Impact reporting (see page 14 ), while the Compensation Committee has incorporated an ESG Modifier based on our values and other key community initiatives to our executive compensation program (see page 28 ). The full Board also directly oversees certain issues such as Apple’s progress toward implementation of our Human Rights Policy (see page 10 ) and our environmental goals and initiatives (see page 13 ). Management of ESG Work on environmental and social initiatives is embedded across different lines of business, with broad collaboration to drive forward initiatives that are important to Apple. For example, Apple’s Vice President of Environment, Policy and Social Initiatives is responsible for the development, review, and execution of plans designed to minimize Apple’s impact on the environment, whereas Apple’s Senior Vice President, Operations leads our efforts and progress in the critical work of protecting people and the planet across our supply chain. The Enterprise Risk Management Program is supported by a Risk Oversight Committee, composed of our Chief Financial Officer, General Counsel, Head of Business Assurance, and other senior business leaders, reporting to the Audit and Finance Committee, with its general responsibility for overseeing enterprise risk management. For more information on our corporate governance framework and Board, see our 2022 Proxy Statement . Appendix Governance Communities Suppliers Customers Our People Environment Introduction Apple’s 2022 ESG Report 70
Ethics and compliance Apple is committed to conducting business ethically, honestly, and in full compliance with applicable laws and regulations. Business Conduct and Global Compliance Apple’s Business Conduct Policy provides a guide to our ethical requirements for our employees. This policy includes the principles that guide our business practices — honesty, respect, confidentiality, and compliance. It is available to employees in over 20 languages. Apple expects its suppliers, contractors, consultants, and other business partners to follow these principles when providing goods and services to Apple or acting on our behalf. Apple’s Business Conduct and Global Compliance team focuses on business conduct, political compliance, export and sanctions compliance, health compliance, antitrust compliance, anti-corruption compliance, and third-party compliance. Additional compliance functions are integrated into our business organizations. The Business Conduct and Global Compliance team conducts internal and independent third- party assessments of its programs to ensure that they are effective and meet or exceed best practices. We make changes to our programs, policies, procedures, and training to reflect emerging trends and ensure that the respective compliance programs are aligned with Apple’s business and risk profile. Apple’s Chief Compliance Officer provides regular updates to the Board’s Audit and Finance Committee on the work done by the Business Conduct and Global Compliance team and other compliance functions. Third-party compliance program Apple has a robust third-party compliance program that has been noted as mature and a leading practice by two external parties. The program utilizes a risk calculator that includes factors specific to Apple’s risk profile to determine the level of diligence to conduct on a third party. We also utilize predictive analytics and data visualization through our custom internal tool. This tool also provides a broad range of insights about third parties, including due diligence findings, ongoing monitoring hits, audits, payment reviews, and remediation. Training and resources We take our values seriously, and our training helps guide our employees in making good decisions. All employees are required to take an annual scenario-based online Business Conduct training that is updated each year. Training topics include workplace behaviors, conflicts of interest, gifts, confidentiality, competition, privacy, and Apple’s Human Rights Policy. Our internal Business Conduct website provides additional resources for our employees to learn more about the Business Conduct Policy, including regularly updated FAQs, featured topics, and toolkits for managers. Our Business Conduct Helpline is available for employees to ask questions and report concerns. Additionally, all employees receive mandatory annual or biannual training on Privacy, Respect at Apple, and Inclusion and Diversity. Employees receive between two and five hours of training annually, depending on location and the risks and responsibilities of their role. Additional required and recurring training includes Anti-Corruption, Antitrust, Export and Sanctions, and manager-specific training. Our Board also regularly receives training and updates on ethics and compliance at Apple. Managers get supplementary resources and training on topics such as disability awareness and accommodations, discriminatory behavior, and their responsibilities to receive and report all allegations of misconduct. Apple also trains eligible contractors on our expectations for ethical behavior; topics include workplace behaviors, secrecy, privacy, and important laws. Compliance policies Apple’s ethical business practices are set out in our Business Conduct Policy and additional key compliance policies. We make key compliance policies, including those applicable to our third parties, publicly available on our Ethics and Compliance website . Anti-corruption Apple does not tolerate any form of corruption by Apple employees or by third parties when working with or on behalf of Apple. Apple’s Anti-Corruption Policy details how to comply with global anti-corruption laws. If employees are unsure of the proper course of action, or whether something constitutes corruption, we encourage them to contact Apple’s Business Conduct team. 98% employees completing business conduct training in calendar year 2021 902,000 Apple training courses completed in 2021 432,000 hours spent on Apple-recommended and required trainings in 2021 For more information, see Apple’s Ethics and Compliance website . Appendix Governance Communities Suppliers Customers Our People Environment Introduction Apple’s 2022 ESG Report 71
Export and sanctions Apple is committed to compliance with applicable export and sanctions laws, and the requirements that apply to Apple and its employees are clearly set out in Apple’s Export and Sanctions policies. We also provide internal resources for employees to help them understand applicable laws and how to report possible violations. Antitrust and competition Apple is committed to conducting business in compliance with competition laws around the world. Misconduct and violations of Apple’s Antitrust and Competition Law Policy and the law must promptly be reported to our Antitrust Compliance Officer or to the Business Conduct team. Apple’s Antitrust Compliance Officer, together with Apple’s General Counsel and Apple’s Chief Compliance Officer, regularly reports to the Audit and Finance Committee of the Board on matters including the Antitrust Compliance Program’s alignment with potential antitrust risks, as well as the effectiveness of the program’s design in detecting and preventing antitrust issues and promoting compliance with laws and Apple’s policies. Public policy advocacy Apple engages in policy discussions where they matter to our business and customers. Our Public Policy Advocacy website defines our position on corporate political contributions and describes how Apple participates in public debate in the United States through direct and indirect advocacy. Apple does not make political contributions to individual candidates or parties, and we do not have a political action committee. Any political contributions made by Apple are made in the interests of the company and without regard for the private political preferences of individual executives or employees. Political contributions are promptly reported publicly on Apple’s website. Reporting concerns Our employees are required to speak up about any violation of Apple’s Business Conduct Policy, other Apple policies, or legal or regulatory requirements, and we make it easy for employees and third parties to report concerns. Our employees can contact Apple’s Business Conduct team by phone, email, or web form. Apple’s third-party reporting service, EthicsPoint, is also available to employees and external parties to report concerns to the Business Conduct team, and provides the option of anonymous reporting, where permissible under local law. The external reporting service is available 24/7, and provides a multilingual reporting option with local, toll- free numbers. Business Conduct partners with appropriate teams at Apple to investigate concerns and determine appropriate resolutions, including corrective action up to and including termination where necessary. Apple will not retaliate — and will not tolerate retaliation — against any individual for reporting a good-faith concern or complaint, or for participating in the investigation of any complaint. Tax payments Taxes play a necessary and important role in our society and Apple believes every corporation has a responsibility to pay all the taxes they owe. As one of the largest taxpayers in the world, we comply with the law wherever we operate and pay taxes on everything we earn around the world. Over the past decade, Apple has paid more than $120 billion in corporate income taxes — and our annual effective tax rate was 22 percent on average. 26 The Audit and Finance Committee of the Board of Directors regularly reviews and discusses Apple’s reports on tax matters from Apple’s Chief Financial Officer, General Counsel, the heads of global Tax, Business Assurance, and Internal Audit, and Apple’s independent auditor. These reports include, among other matters, updates on significant domestic and international tax-related developments, worldwide tax audits, international tax structure, international tax policy, and other tax-related legislative matters. Appendix Governance Communities Suppliers Customers Our People Environment Introduction Apple’s 2022 ESG Report 72
Appendix In this section Awards and recognition 74 United Nations Sustainable Development Goals 75 Stakeholder engagement 77 ESG data summary 78 About the report 84 Endnotes 85 Appendix Governance Communities Suppliers Customers Our People Environment Introduction Apple’s 2022 ESG Report 73
Awards and recognition UN Climate Action Award (2019) Global Climat e Actio n Women’s Enterprise USA Magazine — Best of the Decade in Supplier Diversity (2019) Financial Times Innovative Lawyers Award for Inclusion, Diversity and Social Justice (2020) OMNIKAL Top 50 Corporation for Inclusion in Procurement (received for past five years) Thomson Reuters Stop Slavery Award (2018) Apple was ranked #6 on the Top HBCU Supporters List; ratings are a result of voting by HBCU Engineering Deans (2021) JUST Capital #1 for Environment in Technology Hardware (2021) Apple awarded the first Corporate Information Transparency Index Master’s Level designation by China’s Institute of Public and Environmental Affairs (IPE) Alliance for Water Stewardship: World’s First AWS Certified Data Center (2020) RE100 Leadership Award for Best Green Catalyst (2020) “A-” rating on CDP Climate Change Safer Choice Partner of the Year award from the EPA (2021) for the second consecutive year A+ Mind the Store (2021), recognized for the fourth year in a row 2 022 Ethisphere World’s Most Ethical Companies (2022) National Minority Supplier Development Council Corporation of the Year (2021) World Benchmarking Alliance, Digital Inclusion Benchmark Ranked #4 (2021) Human Rights Campaign Corporate Equality Index (2022), 20th year in a row that we received a perfect score Appendix Governance Communities Suppliers Customers Our People Environment Introduction Apple’s 2022 ESG Report 74
UN Sustainable Development Goal Apple’s supporting initiatives Goal 1 End poverty in all its forms everywhere Commitment to combat the housing crisis in California (page 64) Community Education Initiative (page 62) Supplier Standards relating to minimum wages and benefits Commitment to competitive wages (page 28) Support for Malala Fund (page 66) Donations help to alleviate poverty (page 65) Goal 2 End hunger, achieve food security and improved nutrition and promote sustainable agriculture Donations to food banks, soup kitchens, and Meals on Wheels (page 65) Goal 3 Ensure healthy lives and promote well-being for all at all ages Our work to promote health (page 54) Smarter chemistry in our products (page 20) Benefits to support team member physical and mental health (page 27) Environmental, health, and safety practices at Apple (page 33) and at supplier facilities (page 43) Support for product (RED) (page 65) UN Sustainable Development Goal Apple’s supporting initiatives Goal 4 Ensure inclusive and equitable quality education and promote lifelong learning opportunities for all Our work to support education (page 53) Racial Equity and Justice Initiative (page 60) Community Education Initiative (page 62) Apple Developer Academy (page 63) Apple Entrepreneur Camp (page 64) Supplier programs to promote education and professional development (page 45) Support for Malala Fund (page 66) Goal 5 Achieve gender equality and empower all women and girls Gender pay equity and diversity policies and programs (page 28) Anti-human trafficking policy and programs Supplier diversity programs (page 45) Support for Malala Fund (page 66) Goal 6 Ensure availability and sustainable management of water and sanitation for all Apple’s water stewardship programs at our facilities and in our supply chain (page 19) Apple’s Restore Fund and support for ecosystem restoration and protection projects Responsible packaging initiatives Goal 7 Ensure access to affordable, reliable, sustainable and modern energy for all 100% renewable energy for Apple facilities (page 16) Supplier Clean Energy Program Supplier Energy Efficiency Program (page 46) Power for Impact program (page 16) United Nations Sustainable Development Goals We believe businesses have an important role to play in creating peace and prosperity for people and the planet, now and into the future. Initiatives across Apple help advance a number of the Sustainable Development Goals (SDGs) set out by the 193 Member States of the United Nations. Appendix Governance Communities Suppliers Customers Our People Environment Introduction Apple’s 2022 ESG Report 75
UN Sustainable Development Goal Apple’s supporting initiatives Goal 8 Promote sustained, inclusive and sustainable economic growth, full and productive employment and decent work for all Job creation and economic contributions of App Store ecosystem Our work to support education (page 53) Community Education Initiative (page 62) Apple Developer Academy (page 63) Apple Entrepreneur Camp (page 64) Supplier diversity programs (page 45) Racial Equity and Justice Initiative (page 60), including Apple’s Impact Accelerator (page 18) Our commitment to a highly competitive wage (page 28) Gender pay equity and diversity policies and programs (page 28) Programs to respect labor and human rights in our manufacturing supply chain (page 40) Anti-human trafficking policy and programs Goal 9 Build resilient infrastructure, promote inclusive and sustainable industrialization and foster innovation Job creation (page 68) Commitment to combat the housing crisis in California (page 64) Supplier Clean Energy Program Apple’s procurement and generation of 100% renewable energy for its facilities (page 16) Apple’s R&D investments in and creation of new technology Goal 10 Reduce inequality within and among countries Inclusion and diversity at Apple (page 23) Racial Equity and Justice Initiative (page 60) Our work to support education (page 53) Community Education Initiative (page 62) Apple Developer Academy (page 63) Apple Entrepreneur Camp (page 64) Accessibility (page 50) Our commitment to a highly competitive wage (page 28) Supplier diversity programs (page 45) Training supplier employees on their rights and for professional development Goal 11 Make cities and human settlements inclusive, safe, resilient and sustainable Commitment to combat the housing crisis in California (page 64) UN Sustainable Development Goal Apple’s supporting initiatives Goal 12 Ensure sustainable consumption and production patterns Transitioning all materials in Apple’s products and packaging to recycled and renewable sources (page 18) Advancing zero waste initiatives at our facilities and in our supply chain (page 20) Incorporating smarter chemistry in our products (page 20) Advancing smarter chemistry in manufacturing (page 43) Product trade-in and recycling programs (page 57) Responsible materials sourcing (page 44) Responsible packaging initiatives Goal 13 Take urgent action to combat climate change and its impacts Our ambitious goals and programs to mitigate climate change , including our commitment to carbon neutrality for all of our products by 2030 (page 13) Advocating for strong climate change policy (page 9) Goal 14 Conserve and sustainably use the oceans, seas and marine resources for sustainable development Reducing our impact on ocean acidification through our climate change mitigation activities (page 13) Mangrove conservation Goal 15 Protect, restore and promote sustainable use of terrestrial ecosystems, sustainably manage forests, combat desertification, and halt and reverse land degradation and halt biodiversity loss Responsible packaging initiatives Apple’s Restore Fund and support for ecosystem restoration and protection projects Goal 16 Promote peaceful and inclusive societies for sustainable development, provide access to justice for all and build effective, accountable and inclusive institutions at all levels Racial Equity and Justice Initiative , criminal justice reform (page 60) Supplier Code of Conduct (anti-corruption and non- discrimination practices) (page 37) Apple’s Business Conduct Policy and Practices (page 71) Our work on privacy (page 48) Supplier diversity programs (page 45) Inclusion and diversity at Apple (page 23) Goal 17 Strengthen the means of implementation and revitalize the Global Partnership for Sustainable Development Developing solutions to global challenges is never an easy journey, and it isn’t one that can be undertaken alone. We pursue partnerships with organizations around the world to further efforts to make the world better. These partnerships are described throughout this report and on apple.com . Appendix Governance Communities Suppliers Customers Our People Environment Introduction Apple’s 2022 ESG Report 76
Stakeholder engagement Apple engages with stakeholders as part of our commitment to advance meaningful change and find novel solutions to pressing challenges. Every day, at all levels of the business, we interact with a variety of stakeholders to listen and learn from others’ perspective and experiences, share our progress, and promote best practices. Stakeholders provide valuable expertise as we develop our programs, and by collaborating with other stakeholders, we can drive more impact on the issues we care about than any one of us could make on our own. Throughout the year, we proactively engage with a wide range of stakeholders and rights holders, including: Our people We believe that open and honest communication among team members, managers, and leadership fosters an open, collaborative work environment where everyone can participate, develop, and thrive. Our peoples’ voices and ideas drive innovation in everything we do — from informing diversity initiatives to the inclusive benefits that support employees of all backgrounds through every life stage. In addition to managers listening to their teams, we conduct surveys to better understand team member views across key topics, and we provide channels for employees to share concerns with leadership. Read more in Our People on page 22 . Suppliers Whether through social dialogue and formal employee representation, workplace satisfaction surveys, anonymous hotlines, focus groups, or interviews during annual assessments, the feedback we receive directly from supplier employees helps us ensure that labor and human rights are respected throughout our global supply chain. We also use this feedback to address emerging risks, improve rights training for supplier employees and management, and continually strengthen our Supplier Code of Conduct and Supplier Responsibility Standards. Customers We’re motivated by creating the best user experience through our products and in every interaction with our customers. To help ensure quality, we continually monitor customer feedback, assess key drivers, and leverage analytics to improve the customer experience. Customer feedback is shared with team members as well as leaders, so that everyone understands their impact and is focused on making the customer experience the best it can possibly be. See more on page 55 . NGOs, multi-stakeholder initiatives, and community organizations Listening to NGOs and engaging in multi- stakeholder initiatives and community organizations is a critical way to understand our impacts and inform our work. Teams across Apple interact with and rely on the expertise of external organizations. Just a few examples include: Inclusion and diversity: AnitaB.org, American Indian Science and Engineering Society (AISES), FIRST, Girls Who Code, Hispanic Association of Colleges and Universities (HACU), Human Rights Campaign (HRC), National Center for Women & Information Technology (NCWIT), National Society of Black Engineers (NSBE), The Prince’s Trust, Rewriting the Code, Society of Hispanic Professional Engineers (SHPE), Society of Women Engineers (SWE), and Thurgood Marshall College Fund (TMCF). Supply chain: European Partnership for Responsible Minerals (EPRM), Fund for Global Human Rights, IMPACT, International Labour Organization (ILO), International Organization for Migration (IOM), Pact, Public-Private Alliance for Responsible Minerals Trade (PPA), Responsible Labor Initiative (RLI), RESOLVE, Responsible Minerals Initiative (RMI), Working Capital Innovation Fund (incubated by Humanity United.) Accessibility: World Federation of the Deaf, American Council of the Blind, the Cerebral Palsy Foundation and the National Association of the Deaf, as well as World Health Organization (WHO) and the European Disability Forum (EDF). Environment: Alliance for Water Stewardship (AWS), Aluminium Stewardship Initiative, Ceres, ChemFORWARD, China Association of Circular Economy (CACE), Clean Electronics Production Network (CEPN), Clean Energy Buyers Alliance (CEBA), Institute of Public and Environmental Affairs (IPE), Japan Climate Leaders’ Partnership, MIT Climate and Sustainability Consortium (MCSC), Platform See page 32 of People and Environment in our Supply Chain Report and page 78 of the Environmental Progress Report for more detail. Investors and shareholders We proactively engage with shareholders and other stakeholders throughout the year to learn their perspectives on significant issues, including company performance and strategy, corporate governance, executive compensation, and environmental, social, and governance topics. This engagement helps us better understand shareholder priorities and perspectives, gives us an opportunity to elaborate upon our initiatives with relevant experts, and fosters constructive dialogue. We take feedback and insights from our engagement with shareholders and other stakeholders into consideration as we review and evolve our practices and disclosures, and further share them with our Board as appropriate. Since the date of the 2021 annual meeting of shareholders to the date of our 2022 Proxy Statement, management engaged shareholders representing more than a majority of shares held by institutional shareholders, based on the number of institutional shares reported as of September 30, 2021, the latest date that information was available prior to the filing of the 2022 Proxy Statement . for Accelerating the Circular Economy (PACE), RE100, Responsible Business Alliance (RBA), World Business Council for Sustainable Development (WBCSD). Appendix Governance Communities Suppliers Customers Our People Environment Introduction Apple’s 2022 ESG Report 77
ESG data summary Fiscal year 2021 2020 2019 2018 2017 Corporate emissions 1 (metric tons CO 2 e) Scope 1 (gross emissions) 55,200 47,430 52,730 57,440 47,050 Natural gas, diesel, propane 40,070 39,340 40,910 42,840 36,210 Fleet vehicles 12,090 4,270 6,950 11,110 8,300 Process emissions 2 3,040 3,830 4,870 3,490 2,540 Scope 2 (market-based) 2,780 0 0 8,730 36,250 Electricity 0 0 0 8,730 36,250 Steam, heating, and cooling 3 2,780 - - - - Scope 3 (gross emissions) 4 23,130,000 22,550,000 24,980,000 25,070,000 27,330,000 Business travel 5 22,850 153,000 326,000 337,000 121,000 Employee commute 6 85,570 134,000 195,000 183,000 172,000 Corporate carbon offsets 7 -167,000 -70,000 - - - Product life cycle emissions 8 (metric tons CO 2 e) Manufacturing (purchased goods and services) 16,200,000 16,100,000 18,900,000 18,500,000 21,100,000 Product transportation (upstream and downstream) 1,750,000 1,800,000 1,400,000 1,300,000 1,200,000 Product use (use of sold products) 4,990,000 4,300,000 4,100,000 4,700,000 4,700,000 End-of-life treatment 80,000 60,000 60,000 50,000 40,000 Product carbon offsets 9 -500,000 - - - - Total gross carbon footprint (without offsets) 10 (metric tons CO 2 e) 23,200,000 22,600,000 25,100,000 25,200,000 27,500,000 Total net carbon footprint (after applying offsets) 10 (metric tons CO 2 e) 22,530,000 22,530,000 25,100,000 25,200,000 27,500,000 1. Apple is carbon neutral for corporate emissions as of April 2020. 2. Emissions from R&D processes. 3. Beginning in FY2021, we’re accounting for scope 2 emissions from the purchase of district heating, chilled water, and steam. 4. In fiscal year 2017, we started calculating scope 3 emissions not listed in this table. In fiscal year 2021, these include electricity transmission and distribution losses amounted to about 28,000 metric tons CO 2 e and life cycle emissions associated with renewable energy amounted to about 95,000 metric tons CO 2 e. We have not accounted for emissions resulting from employees working from home, because we anticipated these emissions are small relative to our carbon footprint and we are still evolving our methodology. 5. We regularly revisit our methodology to hold ourselves to high accountability standards. So in fiscal year 2018, we changed how we calculate emissions from business travel in order to better account for classes of service in air travel. As a result of this change, our scope 3 transportation emissions increased by 77 percent between 2017 and 2018. Without the methodology change, these emissions would have increased by 14 percent, which reflects the growth in our business. 6. Beginning in fiscal year 2020, we updated our methodology to reflect the impact of COVID-19 on employee commute. 7. We retired 167,000 metric tons of carbon credits from the Chyulu Hills project in Kenya to maintain carbon neutrality for our corporate emissions in fiscal year 2021. This project is certified to the VCS and CCB standards. 8. Because we’re committed to accuracy and transparency, we regularly refine our product life cycle assessment model and sources of data. For example, we recently obtained more granular data summarizing in which countries our products are sold and used, resulting in more granularity possible for grid emission factors used in the carbon footprint of the product use phase. The net result was an increase in our 2021 carbon footprint. When using the same level of data granularity and model as 2021, our product use carbon emissions in 2021 would have been about 2.5 percent lower. 9. For fiscal year 2021, we retired credits from the Chyulu Hills project in Kenya, and purchased carbon credits from two additional projects to offset a total of 500,000 metric tons of direct emissions across our value chain. The first project, a REDD+ coastal conservation project in Guatemala, protects and conserves forests from deforestation and degradation. The second project aims to establish forests on about 46,000 hectares of barren land that is not otherwise in use across seven counties in the Guizhou Province of China. Both projects are certified to the same high standards that we require for projects in the Restore Fund, including VCS and CCBS. These projects are all certified to the VCS and CCB standards. 10. Due to rounding, our gross and net carbon footprints do not always the sum of the subtotals disclosed above. Notes: For data on previous years, please reference past Environmental Progress Reports, available at apple.com/environment. Dash indicates data that are not available. Due to rounding, totals may not be the sum of the subtotals above. Greenhouse gas emissions Environment Appendix Governance Communities Suppliers Customers Our People Environment Introduction Apple’s 2022 ESG Report 78
Fiscal year Unit 2021 2020 2019 2018 2017 Corporate facilities energy use Electricity Total MWh 2,854,000 2,580,000 2,427,000 2,182,000 1,832,000 U.S. MWh 2,377,000 2,192,000 2,075,000 1,830,000 1,536,000 International MWh 477,000 389,000 351,000 351,000 296,000 Fuel Total MWh 476,280 439,170 462,680 494,460 420,650 Natural gas MWh 203,010 202,360 202,340 204,970 174,420 Biogas MWh 208,620 210,820 217,140 226,660 193,280 Propane liquid MWh 40 140 280 280 280 Gasoline MWh 34,880 14,910 23,950 37,740 31,310 Diesel (other) MWh 9,780 9,610 16,450 20,270 20,670 Diesel (mobile combustion) MWh 10,950 1,330 2,520 4,540 690 Other Steam, heating, and cooling 1 MWh 22,480 - - - - Energy efficiency 2 Corporate facilities Electricity savings 3 MWh/year 260,390 244,690 208,640 113,200 69,980 Fuel savings mmBTU/year 299,780 297,090 277,120 254,140 245,340 Supplier facilities 3 Electricity savings MWh/year 1,418,825,350 1,101,440 943,890 798,930 473,510 Fuel savings mmBTU/year 1,047,440 752,680 25,120 25,120 5,620 Renewable electricity Corporate facilities Renewable electricity use MWh 2,854,000 2,580,000 2,430,000 2,170,000 1,770,000 % Renewable electricity 4 percent of total energy 100% 100% 100% 99% 97% Scope 2 emissions avoided metric tons CO₂e 1,063,720 948,000 899,000 690,000 589,000 Supply chain 5 Renewable electricity capacity (operational) GW 10.3 4.5 2.7 1.9 1.2 Renewable electricity capacity (committed) GW 15.9 7.9 5.1 3.3 2 Renewable electricity use MWh 18,100,000 11,400,000 5,700,000 4,100,000 1,900,000 Notes: For data on years prior to 2017, please reference past Environmental Progress Reports, available at www.apple.com/environment Dash indicates data that are not available. 1. Beginning in FY2021, we’re accounting for the purchase of district heating, chilled water, and steam. 2. Because energy efficiency measures have lasting benefits, energy efficiency savings are calculated cumulatively since 2012. All efficiency measures are retired based on their effective useful lifetime as documented by the California Energy Commission. Due to the COVID-19 pandemic, corporate facilities energy use declined temporarily as we adjusted lighting and climate controls due to shutdowns and reduced occupancy. These savings are not included in the total savings from our energy efficiency program initiatives. We also recognize that energy use at our employees’ homes likely increased during this period. We have not accounted for this energy use, because we anticipated this impact is small relative to our overall energy use and we are still evolving our methodology. 3. Energy savings from supplier energy efficiency improvements are reported as annualized annual numbers. Prior to 2020, supplier energy savings are calculated on a calendar year basis. Beginning in 2020, supplier energy savings are calculated based on the fiscal year. 4. Beginning January 1, 2018, 100 percent of the electricity we use to power our global facilities is sourced from renewable energy. 5. Supply chain renewable electricity capacity (operational) and renewable electricity use for FY2021 do not include REC purchases Apple made, equivalent to 0.3 GW and 500,000 MWh, respectively, to address a small increase to its carbon footprint. Energy Appendix Governance Communities Suppliers Customers Our People Environment Introduction Apple’s 2022 ESG Report 79
Fiscal year KPI Unit 2021 2020 2019 2018 2017 Water Corporate facilities Total million gallons 1,407 1,287 1,291 1,258 1,000 Freshwater 1 million gallons 1,259 1,168 1,178 1,190 973 Recycled water 2 million gallons 141 113 106 63 24 Other alternative sources 3 million gallons 7 5 7 4 3 Supply chain Freshwater saved million gallons 12,300 10,800 9,300 7,600 5,100 Waste Corporate facilities 4 Landfill diversion rate percent 68% 70% 66% 67% 71% Landfilled (municipal solid waste) pounds 33,202,200 25,826,550 38,317,120 32,372,890 31,595,200 Recycled pounds 73,489,220 63,812,300 72,338,130 66,380,630 68,509,300 Composted pounds 4,844,960 6,302,410 10,882,120 10,397,430 14,567,500 Hazardous waste pounds 3,525,840 4,053,770 6,096,600 6,277,800 3,342,700 Waste to energy pounds 657,890 786,250 1,129,080 1,105,140 645,000 Supply chain Waste diverted from landfill metric tons 491,000 400,000 322,000 375,000 351,000 Product packaging footprint Total packaging metric tons 257,000 226,000 189,000 187,000 169,000 Recycled fiber percent 63% 60% 59% 58% 56% Responsibly sourced virgin fiber 5 percent 33% 35% 33% 32% 30% Plastic percent 4% 6% 8% 10% 14% 1. We define freshwater as drinking-water quality, the majority of which comes from municipal sources and less than 5 percent comes from onsite groundwater sources. 2. Recycled water represents a key alternative water source. Our recycled water is sourced primarily from municipal treatment plants, with less than 5 percent from onsite treatment. Recycled water is primarily used for irrigation, make-up water in cooling, or toilet flushing. 3. Other alternative sources of water include rainwater and recovered condensate that is captured onsite. Water used for construction activities like dust control is not included in this total, and represents 13 million gallons of water used in fiscal year 2021. 4. Total does not include construction and demolition waste nor electronic waste. We’re refining our methodology for collecting this data and plan to include it in future years. We have also re-stated the total for 2018 without these categories of waste. 5. Responsible sourcing of wood fiber is defined in Apple’s Sustainable Fiber Specification. Since 2017, all of the virgin wood fiber used in our packaging has come from responsible sources. Resources Appendix Governance Communities Suppliers Customers Our People Environment Introduction Apple’s 2022 ESG Report 80
Calendar year 2021 2020 Inclusion and diversity Global Gender Open leadership roles filled by women globally 47% 37% Open R&D leadership roles filled by women globally 34% 26% Open retail leadership roles globally filled by women 58% 49% Overall Female 34.8% 34% Male 65.2% 66% Tech 1 Female 24.4% 24% Male 75.6% 76% Nontech Female 43.3% 42% Male 56.7% 58% Leadership 2 Female 31.4% 31% Male 68.6% 69% Retail Female 37.1% 35% Male 62.9% 65% Retail leadership Female 39.8% 38% Male 60.2% 62% U.S. Race and Ethnicity Open leadership roles filled by URCs in the U.S. 59% 43% Open R&D leadership roles filled by URCs in the U.S. 38% 29% Open retail leadership roles in the U.S. filled by people from URCs 76% 67% Overall Asian 27.9% 27% Black 9.4% 9% Hispanic/Latinx 14.8% 14% Indigenous 0.7% 1% Multiracial 3.2% 3% White 43.8% 47% People Appendix Governance Communities Suppliers Customers Our People Environment Introduction Apple’s 2022 ESG Report 81
Calendar year 2021 2020 Tech 1 Asian 41.2% 39% Black 5.5% 6% Hispanic/Latinx 7.8% 8% Indigenous 0.5% 1% Multiracial 2.4% 2% White 42.6% 44% Nontech Asian 13.8% 13% Black 13.7% 12% Hispanic/Latinx 22.3% 21% Indigenous 0.9% 1% Multiracial 4.0% 4% White 45.2% 49% Leadership 2 Asian 29.2% 27% Black 4.0% 4% Hispanic/Latinx 7.8% 8% Indigenous 0.5% 0% Multiracial 1.7% 2% White 56.9% 59% Retail Asian 9.1% 8% Black 17.9% 15% Hispanic/Latinx 25.4% 23% Indigenous 1.1% 1% Multiracial 4.7% 5% White 41.6% 48% Retail leadership Asian 5.5% 5% Black 10.8% 8% Hispanic/Latinx 13.7% 13% Indigenous 1.1% 1% Multiracial 2.5% 2% White 66.4% 70% 1. Tech roles are based on U.S. Federal Employer Information Report EEO-1 skill designations. At Apple, this includes all technical roles across the company, such as engineering roles and Apple Store Geniuses. 2. Leadership roles include managers at all levels of our company. Data supplied by the People team at Apple. Totals may not add up to 100% due to rounding. To align with U.S. government reporting requirements, data on this website uses the traditional gender categories of male and female. Apple deeply respects that gender is not binary. Appendix Governance Communities Suppliers Customers Our People Environment Introduction Apple’s 2022 ESG Report 82
Communities Fiscal year 2021 2020 Corporate donations $250M+ $250M+ Number of employee donors 45,000 3 53,000 3. In FY2021, we strengthened our program’s eligibility requirements so that volunteer hours clearly supported charitable organizations. As a result, some activities that were previously eligible then became ineligible. Governance Calendar year 2021 2020 Employees completing business conduct training 98% 98% Apple training courses completed 902,000 555,000 Hours spent on Apple-recommended and required trainings 432,000 296,000 Read more about compliance and ethics at Apple on page 71 . Suppliers Fiscal year 2021 2020 Supplier employees trained on their rights since 2008 23.6 million 21.5 million Recruitment fees paid back by suppliers to their employees since 2008 $33.2 million $32.4 million Supplier employees directly engaged about their workplace experiences, through interviews and satisfaction surveys 352,589 254,265 Assessments conducted 1,177 1 1,121 2 Identified 3TG, cobalt, and lithium smelters and refiners participated in independent, third-party audits 100% 100% 1. Apple reports 3TG smelter and refiner assessment information on a calendar year per U.S. Securities and Exchange Commission (SEC) requirements. See our annual Conflict Minerals Report by visiting https://www.apple.com/ supplier-responsibility/. 2. This number is for calendar year. Read more and see additional data about our suppliers on page 36 and in People and Environment in Our Supply Chain . Calendar year Training 2021 2020 Inclusion and diversity training 185,000 129,000 Read more and see additional data about growth and development at Apple on page 26 . Appendix Governance Communities Suppliers Customers Our People Environment Introduction Apple’s 2022 ESG Report 83
About the report Reporting year: This report focuses primarily on fiscal year 2021 activities, unless otherwise noted. All references to a year throughout the report refer to Apple’s fiscal years, unless “calendar year” is specified. Apple’s fiscal year is the 52- or 53-week period that ends on the last Saturday of September. Alignment to reporting frameworks: The report leverages reporting frameworks and standards such as the Global Reporting Initiative (GRI), Sustainable Accounting Standards Board (SASB), and the Task Force on Climate-related Financial Disclosures (TCFD). Apple’s ESG Index maps the disclosures in this report and other Apple publications against the metrics in these reporting frameworks, as relevant to our business. Data assurance: We obtain third-party verification for scope 1, 2, and 3 greenhouse gas emissions, as well as energy use, paper use, and waste and water impacts for our data centers, offices, and retail stores worldwide. Apex Companies (Apex) provides “reasonable assurance” — one of the highest levels of verification in the industry — for this environmental impact data.. Apex also provides “limited assurance” of scope 3 renewable energy production and avoided carbon emissions related to our Supplier Clean Energy Program as well as energy savings associated with our Supplier Energy Efficiency Program. Scope 3 greenhouse gas emissions related to our products, calculated using life cycle assessment, are checked for quality and accuracy by the Fraunhofer Institute in Germany in accordance with the internationally recognized ISO 14000 environmental management standards: ISO 14040 and 14044. Finally, Apple’s plastic packaging footprint is also reviewed by Fraunhofer Institute. These assurance statements are available on pages 100-120 of Apple’s 2022 Environmental Progress Report . Data in this report reflects estimates using methodologies and assumptions believed to be reasonable and accurate. Those estimates, methodologies and assumptions may change in the future as a result of new information or subsequent developments. Those estimates, methodologies and assumptions may change in the future as a result of new information or subsequent developments. Forward-looking statements: The report does not cover all information about our business. References in this report to information should not be construed as a characterization regarding the materiality of such information to our financial results or for purposes of the U.S. securities laws. The information covered by the report contains forward-looking statements within the meaning of the Private Securities Litigation Reform Act of 1995, including statements regarding our ESG goals, targets, commitments, and strategies and related business and stakeholder impacts. These statements involve risks and uncertainties, and actual results may differ materially from any future results expressed or implied by the forward-looking statements, including any failure to meet stated ESG goals and commitments, and execute our strategies in the time frame expected or at all, as a result of many factors, including changing government regulations or stakeholder expectations, and our expansion into new products, services, technologies, and geographic regions. Forward- looking statements can also be identified by words such as “future,” “anticipates,” “believes,” “estimates,” “expects,” “intends,” “plans,” “predicts,” “will,” “would,” “could,” “can,” “may,” and similar terms. More information on risks, uncertainties, and other potential factors that could affect our business and performance is included in our filings with the SEC, including in the “Risk Factors” and “Management’s Discussion and Analysis of Financial Condition and Results of Operations” sections of the company’s most recently filed periodic reports on Form 10-K and Form 10-Q and subsequent filings. We assume no obligation to update any forward-looking statements or information for any reason, which speak as of their respective dates. Terminology: “Carbon emissions” refers to carbon dioxide equivalent emissions. “Team members” generally refers to Apple employees unless otherwise specified. Imagery: All photographs in the report showing people without masks were taken prior to the COVID-19 pandemic or in accordance with Apple and other local COVID-19 protocols. Appendix Governance Communities Suppliers Customers Our People Environment Introduction Apple’s 2022 ESG Report 84
Endnotes 1 Apple’s 2030 carbon neutrality goal means that we plan to reach net zero beginning with our fiscal year 2030 carbon footprint. 2 61.7 percent emissions reduction by fiscal year 2030 relative to our fiscal year 2019 emissions. 3 Based on sales-weighted averages of Mac, iPad, iPhone, Apple Watch, Apple TV, HomePod, AirPods, and Beats. 4 Eligible products are those in a product category for which ENERGY STAR certification exists. For more information, visit www.energystar. gov. ENERGY STAR and the ENERGY STAR mark are registered trademarks owned by the U.S. Environmental Protection Agency. 5 Calculated in accordance with the SASB standard, metric TC-HW-410a.2. Apple lists eligible products sold in the United States and Canada on the Electronic Product Environmental Assessment Tool (EPEAT) Registry. To calculate this metric, we considered “eligible for the EPEAT Registry” all products sold globally that correspond to those listed on the EPEAT Registry. Eligible products are those in a product category for which EPEAT registration exists, which includes desktop computers, notebook computers, computer displays, and mobile phones. For more information, visit www.epeat.net . 6 Includes the 13-inch MacBook Air, Apple TV 4K, 13-inch MacBook Pro, Mac mini, iPad mini, 11-inch iPad Pro, iPad, and the 24-inch iMac. Recycled content accounts for materials that are third-party certified and supplier reported. The actual total recycled content may be higher given industry- average recycled content not included here. 7 Total recycled material shipped in products is driven by product material composition and total sales, and may fluctuate based on the number and type of products sold each year. 8 Plastic packaging components refer to any packaging part made of majority plastic, including plastic wraps, plastic trays, or plastic screen films. Some plastic is still found on packaging components made primarily of fiber. 9 These savings do not include reduction in water use from facility closures and reduced occupancy due to the COVID -19 pandemic. We consider those savings temporary and also acknowledge that the water use was transferred to employees’ homes. 10 This total includes freshwater use as well as alternative water sources, including recycled water, rainwater, and recovered condensate. We define freshwater as drinking-water quality, the majority of which comes from municipal sources and less than 5 percent comes from onsite groundwater sources. Recycled water represents a key alternative water source. Our recycled water is sourced primarily from municipal treatment plants, with less than 5 percent from onsite treatment. Recycled water is primarily used for irrigation, make-up water in cooling, or toilet flushing. Other alternative sources of freshwater include rainwater and recovered condensate that is captured onsite. Water used for construction for activities like dust control is not included in this total, and represents 13 million gallons of water used in fiscal year 2021. Our actual water discharge may vary by 10 percent relative to our estimates. In these estimates, we’ve taken into account consumptive activities including irrigation and cooling towers. 11 We are now accounting for savings through this program on a fiscal year basis, rather than a calendar year basis as was reported in previous years. 12 Waste diversion rates do not include construction and demolition waste or electronic waste for fiscal year 2020. Electronic waste is accounted for in the total metric tons of electronic waste we sent to recycling found on page 49 of the Environmental Progress Report. 13 Our Mesa and Prineville data centers are third- party certified as Zero Waste by USGBC TRUE. TRUE requires 90 percent diversion or higher from the landfill without the use of waste-to-energy to achieve Zero Waste to Landfill. 14 These sites have been third-party verified by UL LLC against the UL 2799 Standard. UL requires at least 90 percent diversion through methods other than waste to energy to achieve Zero Waste to Landfill (Silver 90–94 percent, Gold 95–99 percent, and Platinum 100 percent) designations. 15 Apple benefit programs vary by country, are subject to eligibility requirements, and may be modified from time to time. Many programs extend to full-time and part-time employees globally, but there can be significant variations by country due to local law. 16 Free, confidential counseling for employees and eligible dependents, subject to annual limits. 17 Family and reproductive healthcare benefits described in this report are specific to U.S. employees. 18 In the U.S., full-time employees accrue up to 12 days per year and part-time employees accrue up to six days per year up to a maximum of 240 hours. 19 For full-time U.S. employees, Pregnancy Leave is 10–12 weeks, which is followed by six weeks for New Parent Leave, and then four weeks of a gradual return to work. 20 Apple reports 3TG smelter and refiner assessment information on a calendar year per U.S. Securities and Exchange Commission (SEC) requirements. See our annual Conflict Minerals Report by visiting https://www.apple.com/supplier-responsibility/ 21 Based on surveys conducted by 451 Research in the U.S. considering quarterly ratings over the past three years. 22 As of December 2021. 23 As of our latest alumni survey in December 2021. 24 As of our latest alumni survey in December 2021. 25 As of the end of December 2021. ( https://www. apple.com/newsroom/2021/12/apple-marks-a- year-of-giving-in-the-communities-it-calls-home/ ) 26 Total tax payments and average annual effective tax rate reflect data through fiscal year 2021. Appendix Governance Communities Suppliers Customers Our People Environment Introduction Apple’s 2022 ESG Report 85