AT&T ESG Summary
conne c tivit y ESG Sum mar y March 2022 The value of connectivity
Live true Do the right thing, no compromise. This underpins all our other values and it begins with how we treat our customers and each other. None of us is perfect. But when we make a mistake, we have the character and courage to make it right and learn from it. Think big Innovate and get there first. AT&T is where people come to invent the future. That’s been our legacy since the very beginning. In everything we do, we aim to set the pace for everyone else. Pursue excellence In everything, every time. We work tirelessly to make sure that everything we deliver represents our very best. We may not be perfect, but we always learn from our experiences and constantly improve. Be there When customers & colleagues need you most. Whether it’s restoring service during a natural disaster or helping a community recover from hardship, that’s when we’re at our best. Stand for equality Speak with your actions. Whatever a person’s race, ethnicity, gender, sexual orientation, religion, physical ability or other characteristic, we respect and value them. We know that building a greater understanding of our differences makes us stronger. Make a difference Impact your world. This defines who we are, both as a company and as individuals. We can each make a difference in our communities and for the people around us. AT&T Values This report reflects the global operations of AT&T, Inc., except where otherwise noted. I n July 2021, we completed a transaction with TPG Capital involving our North America video business – including DIRECTV, AT&T TV and U-verse – to form a new company called DIRECTV. In November 2021, we completed the sale of our Latin America video operations, Vrio, to Grupo Werthein. In December 2021, we entered into an agreement with Microsoft to sell our programmatic advertising marketplace component of Xandr Inc. The transaction is subject to customary cl osing conditions, i ncluding regulatory reviews. In April 2022, we comple ted a tr ansaction to combine our WarnerMedia segment, subject to certain exceptions, with a subsidiary of Discovery Inc. 2 3 4 6 12 20 26 30 38 44 47 50 • CDP Climate Change disclosure • Diversity, Equity & Inclusion (DE&I) report • Political engagement report • Transparency report • 2022 Proxy statement • ESG reporting indexes (GRI, SASB , UNGC, UN SDGs) • ESG issue briefs • ESG material topics assessment • TCFD report Contents Le tter from our Chief Executive Officer E SG at A T&T How we create value AT&T and S h areholders Customers and C ommunities Employees Suppliers Environment Governance Progress towar d our goals Key p erformance i ndic ators Endnotes Note: Certain environmental or diversity, equity and inclusion metrics in this report may be estimated or reflect FY2020 performance, as specified in associated text or end notes. An updated version of this report including final FY2021 metrics will be published on our ESG reporting website in May 2022. Inclusion of information in this report should not be construed as a characterization of the financial materiality or impact of that information. Please see our corporate Annual Report or Form 10-K for the year ended December 31, 2021 and other publicly-filed documents available at https://investors.att.com/. The AT&T ES G reporting website provides comprehensive ESG disclosure additional to this ESG Summary: AT&T ESG SUMMARY REPORT 2022 1

Letter from our Chief Executive Officer We’re at the dawn of a new era of connectivity, one which we believe represents an opportunity to make positive and lasting contributions to the world around us. To deliver on that promise and maximize our performance as a company, we actively monitor and adjust the way our operations intersect with the environment and society, and work to effectively manage those impacts. This report illustrates how AT&T is enhancing our resilience and supporting our stakeholders by addressing leading environmental, social and governance (ESG) issues. For example: • Our employees tell us they want their work to serve others in a meaningful way. There’s perhaps no better model than our belief in internet for all and our pledge to help the millions of Americans who still cannot access or afford fast, reliable connectivity. Our efforts include advocating for thoughtful governmental policies and strategically deploying our $2 billion commitment to help close the digital divide – which includes broadening our low-cost connectivity offerings and launching AT&T Connected Learning SM resources across the country. • AT&T has set an industry-leading target to help businesses collectively reduce a gigaton of greenhouse gas (GHG) emissions by 2035 – equivalent to roughly 15% of all 2020 U.S. GHG emissions. We’ve established a Connected Climate Initiative to advance this effort alongside talented business, research and community leaders. And we’re executing plans to aggressively reduce our own operational emissions, to be carbon neutral by 2035. • As we continue to work toward a more equitable society, I’m proud that AT&T has been recognized for our efforts to build a company culture where every employee is treated with fairness and provided equal opportunities to advance. But there is always more we can do, which is why we now make public our traditional measurements of workforce demographic data and are looking to our senior leaders to help improve diverse representation across all levels. I invite you to read on and learn more about our ESG focus areas and commitments, how these efforts are creating long-term value across our operations and how we’re positively impacting the lives of others and the environment around us. John Stankey Chief Executive Officer, AT&T Inc. March 23, 2022 OVERVIEW ABOUT THIS REPORT Our ESG approach focuses on: ESG operational integration We ensure operational resilience and promote strong corporate governance by integrating environmental and social issues into our core business operations. Social impact We use our network, connections and scale to address issues that matter to our customers and communities. Environmental impact We're empowering the transition to a low carbon economy through technological innovation and broad stakeholder engagement. AT&T and Shareholders Customers and Communities Employees Suppliers Environment ADJUSTED EARNINGS PER SHARE 1 $3.40 DIVIDENDS RETURNED TO STOCKHOLDERS $15 .1B DIGITAL DIVIDE COMMITMENT THROUGH 2024 $2B CONNECTED LEARNING CENTERS COMMITTED THROUGH 2022 20+ OPEN POSITIONS FILLED BY DIVERSE CANDIDATES 2 55% PROMOTIONS FILLED BY DIVERSE CANDIDATES 2 53% SUPPLIERS THAT HAVE SET SCIENCE-BASED EMISSIONS TARGETS 47% SPEND WITH DIVERSE SUPPLIERS 3 $13.2B SCOPE 1 AND 2 EMISSIONS REDUCTION SINCE 2015 4 36.4% TOTAL RENEWABLE ENERGY COMMITMENTS 1.7GW ESG at AT&T Highlights Effectively managing ESG risks and opportunities is a business imperative at AT&T. We integrate environmental and social issues throughout our strategy and governance, to help sustain long-term performance and positively impact our stakeholders. This report details how ESG-related programs and policies support our business success and how we’ve created value in 2021 across key stakeholder groups. OVERVIEW AT&T AND SHAREHOLDERS CUSTOMERS AND COMMUNITIES EMPLOYEES SUPPLIERS ENVIRONMENT GOVERNANCE GOALS SUMMARY KPI s AT&T ESG SUMMARY REPORT 2022 AT&T ESG SUMMARY REPORT 2022 2 3
AT&T and Shareholders We sustain long-term business performance by maximizing network reliability and security, and by constantly innovating to maintain and grow our customer base. Employees We empower our people to deliver on our corporate purpose and advance their careers, while fostering a diverse, equitable and inclusive workforce. Customers and Communities We leverage our network for positive social impact, providing critical connectivity, helping bridge the digital divide and supporting disaster response and recovery. Suppliers We extend our ESG efforts throughout our supply chain, helping lead industry practice and enhance resilience for our business and others. Environment We’re enhancing operational resilience on our way to carbon neutrality and are helping customers reduce emissions through smart connectivity solutions. Our purpose We create connection – with each other, with what people need to thrive in their everyday lives and with the stories and experiences that matter. Key inputs The resources that we rely upon to create value. Outcomes The value we create through our operations and actions. ESG approach We integrate ESG issues into our operations and use our platform to drive positive impact. What we do We create new and exciting customer experiences that connect people with who and what they love. How we create value W i r e l e s s • 5 G • I n t e r n e t & fi b e r • B u s i n e s s s o l u t i o n s • P u b l i c s e c t o r & F i r s t N e t W a r n e r M e d i a • H B O M a x N e t w o r k • T e c h n o l o g y & i n n o v a t i o n • A T & T L a t i n A m e r i c a Network The physical infrastructure that supports our world-leading communications network. Brand and Intellectual Capital Our brand, our reputation and our capacity for innovation. Employees Our ~202,600 employees, located across 50 states and 63 countries. Customers and Communities Our millions of customers and the local communities where we live and work. Suppliers Our supply chain of more than 20,000 suppliers across the globe. 5 Environment The energy, water and other natural resources that we use to create and preserve value. Financial Financial resources available to us, and the strength of our balance sheet. E N T E R T A I N C O N N E C T W i r e l e s s • 5 G • I n t e r n e t & fi b e r • B u s i n e s s s o l u t i o n s • P u b l i c s e c t o r & F i r s t N e t W a r n e r M e d i a 8 • H B O M a x N e t w o r k • T e c h n o l o g y & i n n o v a t i o n E N T E R T A I N W H A T W E D O E S G A P P R O A C H C O N N E C T Social Impact Environmental Impact ESG Operational Integration E N T E R T A I N C O N N E C T W H A T W E D O E S G A P P R O A C H Social Impact Environmental Impact ESG Operational Integration ESG material topics We regularly assess and prioritize the material ESG risks and opportunities impacting AT&T, as well as issues where AT&T significantly impacts external stakeholders (page 42). page 30 page 26 page 20 page 12 page 6 OVERVIEW HOW WE CREATE VALUE OVERVIEW AT&T AND SHAREHOLDERS CUSTOMERS AND COMMUNITIES EMPLOYEES SUPPLIERS ENVIRONMENT GOVERNANCE GOALS SUMMARY KPI s AT&T ESG SUMMARY REPORT 2022 AT&T ESG SUMMARY REPORT 2022 4 5
Unlocking value for WarnerMedia, 8 AT&T and shareholders Long-term success requires continuous transformation. Opportunities in streaming media are rapidly evolving, such that maintaining a leadership position requires global scale, access to capital and a broad array of high- quality content and industry-leading talent. Recognizing these needs, AT&T is combining our WarnerMedia unit with Discovery to create a standalone global entertainment company. We expect this deal will lead to accelerated growth for both AT&T and WarnerMedia. Separating these businesses into 2 independent companies – 1 focused on broadband connectivity and the other on media – can attract investors whose interests are aligned with the respective growth and income aspects of each company. The result will be a more streamlined AT&T with better flexibility to invest in our unique position as a trusted connectivity provider. Through sharp execution and emphasis on our core connectivity business, we delivered strong financial results in 2021. Looking ahead, we’re focusing on opportunities that align with our capabilities and strengths as a leading connectivity provider. Throughout 2021, we invested in strategic growth areas such as fiber, 5G and HBO Max, while refining our operations to better grow customer relationships and enhance shareholder value. We’re squarely focused on profitability and achieved a mobility customer acquisition cost per gross add 23% lower than a year ago – reflecting our improved operating leverage and cost control activities across the business. Our transformation is about becoming a simpler, more focused business – growing customer relationships and winning over the long term as America’s best broadband connectivity provider. We continue to invest in our strengths and are working to extend our fiber footprint to 30 million locations by the end of 2025. 2021 financial results AT&T a n d Shareholders REVENUES (EX VIDEO) 6 $153.2B FREE CASH FLOW 7 $26.8B AT&T AND SHAREHOLDERS 2021 FINANCIAL RESULTS DIVIDEND PAYOUT RATIO 7 56% DIVIDENDS RETURNED TO STOCKHOLDERS $15.1B ADJUSTED EARNINGS PER SHARE 1 $3.40 (up from $3.18 in 2020) Customer growth across mobility and broadband Total U.S. Mobility Subscribers thousands 2019 2019 2019 2020 2020 2020 2021 2021 2021 165,889 182,558 201,791 U.S. Postpaid Phone Subscribers thousands AT&T Fiber Connections thousands 63,018 64,216 6 7, 26 0 3,887 4,951 5,992 Communications segment operating contribution by business unit Mobility $ millions 2019 2019 2019 2020 2020 2020 2021 2021 2021 22,321 22,372 23,312 Business Wireline $ millions Consumer Wireline $ millions 5 ,137 2,357 4,564 1,377 3,990 977 Read more: 2021 Annual Report • 2021 10-K • 2022 Proxy Statement • SASB Index 2021 financial results page 7 Network quality and reliability page 8 Climate resilience page 9 Network and data security page 10 Innovation page 11 OVERVIEW AT&T AND SHAREHOLDERS CUSTOMERS AND COMMUNITIES EMPLOYEES SUPPLIERS ENVIRONMENT GOVERNANCE GOALS SUMMARY KPI s AT&T ESG SUMMARY REPORT 2022 AT&T ESG SUMMARY REPORT 2022 6 7
Read more: TCFD Report • CDP Climate Change disclosure • Climate Change Issue Brief AT&T AND SHAREHOLDERS CLIMATE RESILIENCE Millions o f in dividuals, f amilies, b usinesses an d public s af ety a gencies dep end on ou r netwo rk every day. T o s uppo rt t his ess ential c onnectivity, w e c ontinually invest t o en hance t he speed, quality an d reliability ou r c usto mers r equ ire. We c ollect bi llions o f service-assurance m easurements ac ross o ur w ireline a nd w ireless networks every hour and analyze this data in near-real time to help improve performance and deliver the best customer experience. Over the past 6 years (201 6 –2021), we’ve invested more than $ 135 billion in our wire less and wireline networks. 9 We’ve also shifted 100% of our layer 3 core network to software-defined control, which allows us to provision new services faster and rapidly adjust capacity in response to traffic demand. Network quality and reliability Climate resilience Our commitment to fast and reliable technologies As demand for bandwidth and connectivity surged during the COVID-19 pandemic, our network has remained stable – supporting millions as they work, learn and socialize online. AT&T continues to invest in fiber and 5G infrastructure to enable the best connectivity experience across our broadband and wireless networks. Fiber network connections support more bandwidth and faster uploads than standard cable – in addition to >99% proven reliability. Throughout 2021, we built fiber to 2.6 million new customer locations – the equivalent of nearly 300 connections per hour, every day. Today, more than 5.9 million businesses and households subscribe to AT&T Fiber for critical bandwidth to power video, collaboration, cloud services and more. And in 2022, we launched fiber service up to 5Gbps – the fastest offering among major internet service providers. Since becoming the first carrier to make mobile 5G a reality in the U.S., we’ve continued to expand the quality and availability of our 5G network – which now reaches more than 255 million Americans in more than 16,000 cities. The speed and reliability of our 5G network is supported by our leading fiber footprint, which provides critical bandwidth connecting our cell towers back to the internet. Looking ahead, we’ll continue our 5G momentum by expanding the availability of C-band spectrum (AT&T 5G+) that will support even faster connections and innovative wireless solutions. 2021 GROSS CAPITAL INVESTMENT 26 $2 1.6B PETABYTES OF TRAFFIC PER DAY (Q4 2021) ~485 LAYER 3 CORE NETWORK UPTIME IN 2 021 99.99937% LAYER 3 CORE NETWORK AVERAGE INTERRUPTION PER CUSTOMER PORT IN 2021 3.3 s e conds INVESTMENT IN OUR NETWORK DISASTER RECOVERY PROGRAM >$650M 2021 HOME INTERNET FOOTPRINT ~16M customer locations EXPANDING FIBER FOOTPRINT TO 30M customer locations by 2025 EXPECT TO REACH 200M Points of presence in the U.S. with 5G C-band spectrum by the end of 2023 Climate change is increasing the frequency and severity of extreme weather, worsening the risk of physical damage and operational disruptions to our network. Climate change is also contributing to longer-term shifts in environmental conditions, which we take into account as we make upgrades and extend our network reach. To enhance the operational resilience of our network today and help ensure future availability of our services, we integrate climate change considerations throughout our network planning. Key initiatives include: • Regular analysis to help ensure our network infrastructure, such as cell sites, data centers and wireline switching offices, can withstand natural disasters • High-capacity battery backup or permanent generators at our cell sites, data centers and wireline switching offices, helping ensure service continuity in the event of temporary power loss • Proactive monitoring of potential threats to our network, employees and infrastructure through the AT&T Weather Operations Center Considering physical climate risk To help us plan, build and maintain our network in the face of extreme weather and long-term climate change, in 2019 we developed our Climate Change Analysis Tool (CCAT). By modeling the potential for extreme weather within our geographic information system, our industry-leading CCAT helps network engineers analyze how inland and coastal flooding, drought, wind or wildfires may impact existing infrastructure or future network builds – up to 30 years into the future. In 2021, we continued expanding CCAT’s capabilities to generate a holistic climate change risk score for additional segments of our business. For example, in 2022 our energy management teams are leveraging CCAT data as a critical input to power resiliency planning, to support the positioning of additional Bloom Energy fuel cells in the Southeast U.S. Physical climate risk is just one consideration in our approach to environmental issues. See page 31 for additional detail on our climate-related efforts. Supporting the resilience of public infrastructure Over the last 2 years, we’ve been sharing data developed for CCAT with municipalities and other organizations, to help inform climate resilience efforts beyond our network and operations. For example, our work with the New York Power Authority (NYPA) is exploring the similarities in climate-related risk to utility and telecommunications infrastructure, to help New York State become more resilient to extreme weather. This effort builds upon collaborations with additional organizations such as EcoRise and the National Fish & Wildlife Foundation National Coastal Resilience Fund. Read more: 2021 Annual Report • SASB Index • Network Quality & Reliability Issue Brief We're committed to keeping our customers connected – even in the wake of unpredictable, catastrophic events. Our Network Disaster Recovery program is one of the largest and most advanced of its kind – existing solely to rapidly restore communications to areas affected by disasters. OVERVIEW AT&T AND SHAREHOLDERS CUSTOMERS AND COMMUNITIES EMPLOYEES SUPPLIERS ENVIRONMENT GOVERNANCE GOALS SUMMARY In 2021, AT&T was named best network overall for the 4th consecutive year, and best 5G network, by Global Wireless Solutions’ OneScore survey. KPI s AT&T ESG SUMMARY REPORT 2022 AT&T ESG SUMMARY REPORT 2022 8 9
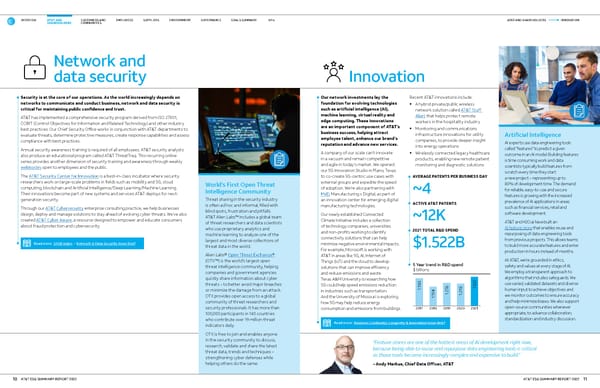
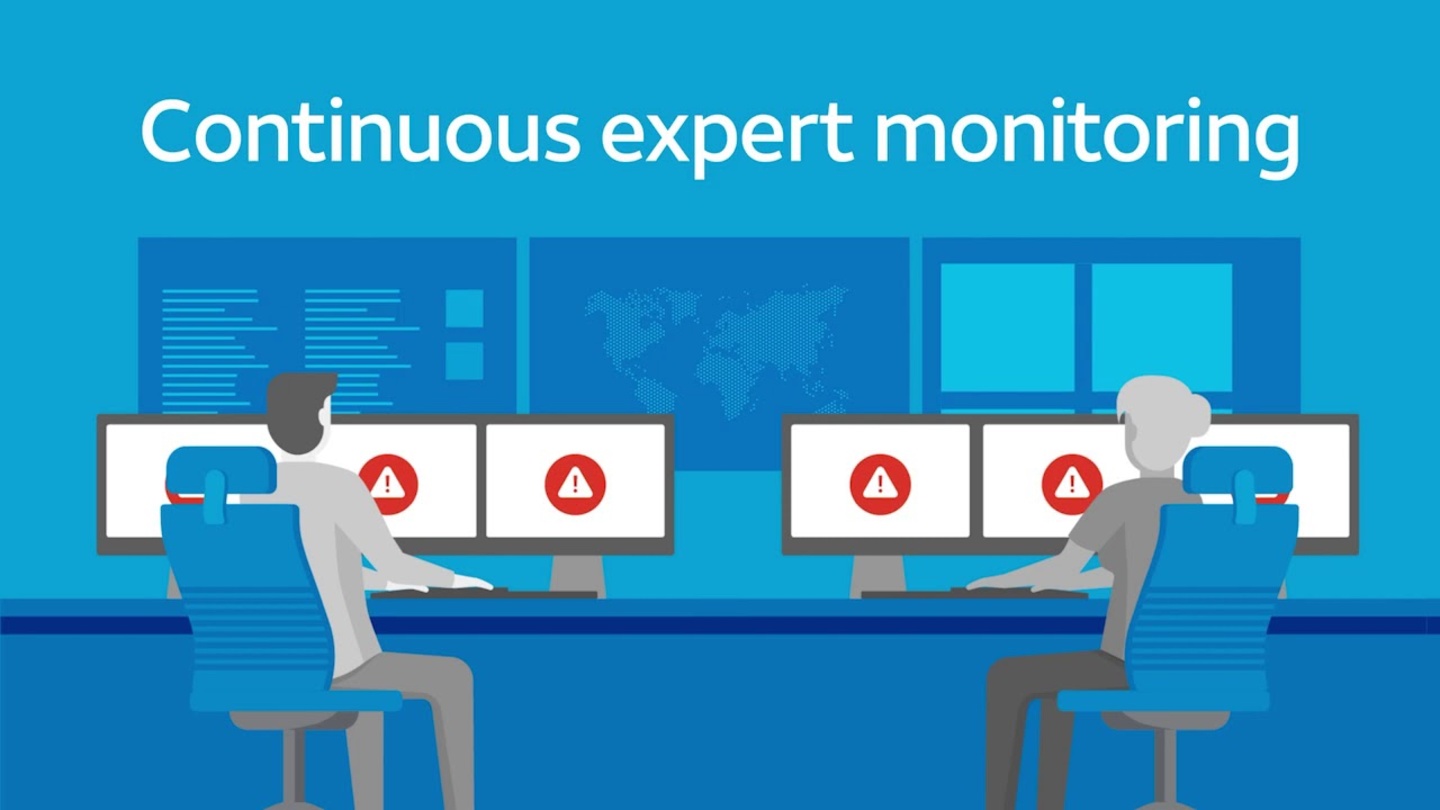
AT&T AND SHAREHOLDERS INNOVATION Security is at the core of our operations. As the world increasingly depends on networks to communicate and conduct business, network and data security is critical for maintaining public confidence and trust. AT&T has implemented a comprehensive security program derived from ISO 27001, COBIT (Control Objectives for Information and Related Technology) and other industry best practices. Our Chief Security Office works in conjunction with AT&T departments to evaluate threats, determine protective measures, create response capabilities and assess compliance with best practices. Annual security awareness training is required of all employees. AT&T security analysts also produce an educational program called AT&T ThreatTraq. This recurring online series provides another dimension of security training and awareness through weekly webisodes open to employees and the public. The AT&T Security Center for Innovation is a best-in-class incubator where security researchers work on large-scale problems in fields such as mobility and 5G, cloud computing, blockchain and Artificial Intelligence/Deep Learning/Machine Learning. Their innovations become part of new systems and services AT&T deploys for next- generation security. Through our AT&T Cybersecurity enterprise consulting practice, we help businesses design, deploy and manage solutions to stay ahead of evolving cyber threats. We’ve also created AT&T Cyber Aware , a resource designed to empower and educate consumers about fraud protection and cybersecurity. Network and data security Innovation World’s First Open Threat Intelligence Community Threat sharing in the security industry is often ad hoc and informal, filled with blind spots, frustration and pitfalls. AT&T Alien Labs™ includes a global team of threat researchers and data scientists who use proprietary analytics and machine learning to analyze one of the largest and most diverse collections of threat data in the world. Alien Labs® Open Threat Exchange® (OTX™) is the world’s largest open threat intelligence community, helping companies and government agencies quickly share information about cyber threats – to better avoid major breaches or minimize the damage from an attack. OTX provides open access to a global community of threat researchers and security professionals. It has more than 100,000 participants in 140 countries who contribute over 19 million threat indicators daily. OTX is free to join and enables anyone in the security community to discuss, research, validate and share the latest threat data, trends and techniques – strengthening cyber defenses while helping others do the same. Our network investments lay the foundation for evolving technologies such as artificial intelligence (AI), machine learning, virtual reality and edge computing. These innovations are an important component of AT&T’s business success, helping attract employee talent, enhance our brand’s reputation and advance new services. A company of our scale can’t innovate in a vacuum and remain competitive and agile in today’s market. We opened our 5G Innovation Studio in Plano, Texas to co-create 5G-centric use cases with external groups and expedite the speed of adoption. We’re also partnering with MxD , Manufacturing x Digital, as part of an innovation center for emerging digital manufacturing technologies. Our newly established Connected Climate Initiative includes a collection of technology companies, universities and non-profits working to identify connectivity solutions that can help minimize negative environmental impacts. For example, Microsoft is working with AT&T in areas like 5G, AI, Internet of Things (IoT) and the cloud to develop solutions that can improve efficiency and reduce emissions and waste. Texas A&M University is researching how 5G could help speed emissions reduction in industries such as transportation. And the University of Missouri is exploring how 5G may help reduce energy consumption and emissions from buildings. Read more: SASB Index • Network & Data Security Issue Brief Read more: Business Continuity, Longevity & Innovation Issue Brief AVERAGE PATENTS PER BUSINESS DAY ~4 ACTIVE AT&T PATENTS ~12K 2021 TOTAL R&D SPEND $1.522B “Feature stores are one of the hottest areas of AI development right now, because being able to reuse and repurpose data engineering tools is critical as those tools become increasingly complex and expensive to build.” – Andy Markus, Chief Data Officer, AT&T Artificial Intelligence AI experts use data engineering tools called “features” to predict a given outcome in an AI model. Building features is time consuming work and data scientists typically build features from scratch every time they start a new project – representing up to 80% of development time. The demand for reliable, easy-to-use and secure features is growing with the increased prevalence of AI applications in areas such as financial services, retail and software development. AT&T and H2O.ai have built an AI feature store that enables reuse and repurposing of data engineering tools from previous projects. This allows teams to build more accurate features and enter production in hours instead of months. At AT&T, we’re grounded in ethics, safety and values at every stage of AI. We employ a transparent approach to algorithms that includes safeguards. We use varied, validated datasets and diverse human input to achieve objectives and we monitor outcomes to ensure accuracy and help minimize biases. We also support open-source communities whenever appropriate, to advance collaboration, standardization and industry discussion. Recent AT&T innovations include: • A hybrid private/public wireless network solution called AT&T Staff Alert that helps protect remote workers in the hospitality industry • Monitoring and communications infrastructure innovations for utility companies, to provide deeper insight into energy operations • Wirelessly connected legacy healthcare products, enabling new remote patient monitoring and diagnostic solutions 5 Year trend in R&D spend $ billions 2018 2017 2019 2020 2021 1.194 1.503 1.276 1.210 1.522 OVERVIEW AT&T AND SHAREHOLDERS CUSTOMERS AND COMMUNITIES EMPLOYEES SUPPLIERS ENVIRONMENT GOVERNANCE GOALS SUMMARY KPI s AT&T ESG SUMMARY REPORT 2022 AT&T ESG SUMMARY REPORT 2022 10 11
Customers and Communities PEOPLE IN NEED SUPPORTED BY AT&T CONNECTED LEARNING >72K PEOPLE REACHED BY DIGITAL INCLUSION INITIATIVES >51K PEOPLE REACHED BY DIGITAL LITERACY AND INITIATIVES ~21K CONNECTIONS TO FIRSTNET >3M Privacy and Accessibility page 13 Digital divide page 14 FirstNet page 18 Community resilience page 19 Our customers expect AT&T to protect their information and respect their privacy. We maintain comprehensive network and data security protocols (page 10), train our employees on privacy at least annually and are committed to compliance with all privacy laws and regulations where we operate. We also have strong governance around the use of AI technologies, to be accountable to all our stakeholders ( page 11 ). Our Chief Privacy Office oversees compliance with privacy principles, policies and commitments across our business, including efforts to ensure consumers can exercise their individual rights under applicable privacy laws. Our global privacy program is based on 4 principles: • Transparency - We’re open and honest about how we use your data. • Security - We use strong safeguards to keep your data confidential and secure. • Choice and control - We give you choices about how we use your data. • Integrity - We do what we say. We create opportunities for people with disabilities to connect to the online world more easily, by requiring manufacturers to build accessibility into their products and providing consumers and employees with accessible solutions. AT&T adopted a Universal Design Statement more than 20 years ago to reflect our commitment to digital inclusion. Our Chief Accessibility Office defines corporate standards and provides training, tools and resources to determine when and how accessibility gaps or needs should be addressed. Our Chief Accessibility Officer, who reports to our Chief Compliance Officer, oversees these efforts. Our commitment to accessible design and inclusion begins with our employees. Through end-of-year 2021, more than 1,000 new hires and 7,000 existing employees have confidentially self-identified as having a disability. 10 Based on regular engagement with the disability community, such as our expert Advisory Panel on Access and Aging , our internal training programs help developers think about accessibility from the beginning of the product life cycle and help customer- facing employees better serve the needs of those with disabilities. We offer more than a dozen courses for employees to help create a more accessible workplace. And through our Accessibility and Inclusion initiative, internal volunteer teams regularly evaluate and improve accessibility for our people. AT&T received the 2021 Corporate Leadership Award from the American Association of People with Disabilities and we were named a Leading Disability Employer by the National Organization on Disability. Privacy Accessibility Safeguarding Children As stated in the AT&T Human Rights Policy , we’re committed to working with industry partners and stakeholders to preserve young people’s rights to freedom of expression and help safeguard them from online predators or exploitation. We support and comply with the Children's Online Privacy Protection Act, as well as other laws governing the collection and handling of children’s data. Our Online Safety Committee provides internal oversight and guidance on digital safety issues, including an impact assessment across our portfolio of services – to better understand risks related to potential online child exploitation and sexual abuse material. We collaborate with groups such as the National Center for Missing and Exploited Children and the WePROTECT Global Alliance, an international movement dedicated to ending child sexual exploitation and abuse online. CUSTOMERS AND COMMUNITIES PRIVACY AND ACCESSIBILITY Read more: Privacy Issue Brief • Network and Data Security Issue Brief Transparency Report Read more: AT&T Accessibility website • Accessibility Issue Brief OVERVIEW AT&T AND SHAREHOLDERS CUSTOMERS AND COMMUNITIES EMPLOYEES SUPPLIERS ENVIRONMENT GOVERNANCE GOALS SUMMARY KPI s AT&T ESG SUMMARY REPORT 2022 AT&T ESG SUMMARY REPORT 2022 12 13
Digital Inclusion In 2021, we began opening the first of more than 20 AT&T Connected Learning Centers SM planned in under-resourced areas across the country – including neighborhoods in Atlanta, Cleveland, Dallas, Detroit, Houston, Los Angeles, Miami and San Francisco. Each center is housed within a local community organization and provides students and families with free access to high-speed AT&T Dedicated Internet , Wi-Fi, computers and technical resources. AT&T employees volunteer at the centers and through digital platforms to provide learners with tutoring and mentoring opportunities. To help students and families participate in virtual learning and gain digital literacy skills, the centers offer educational content through our joint initiative with WarnerMedia, 8 The Achievery SM (see below), plus digital literacy training developed in collaboration with the Public Library Association. Dell Technologies donates computers and monitors with integrated audio and webcams, and the systems are configured by Overland-Tandberg, a Black-owned technology company that is part of AT&T’s supplier diversity program (page 27). Through March 2022, we’ve opened 8 Connected Learning Centers. As additional centers open, we’ll begin reporting the number of students served. CUSTOMERS AND COMMUNITIES DIGITAL DIVIDE Digital divide UNDERSERVED STUDENTS RECEIVING WI-FI HOTSPOTS IN 2021 ~40K COMPUTERS DISTRIBUTED TO FAMILIES AND STUDENTS ~7.7 K DIGITAL LITERACY AND LEARNING WEBSITE VISITS >21K “Our nation’s most under-resourced communities need immediate solutions for overcoming barriers to access, affordability and adoption.” – Charlene Lake, Senior Vice President, Corporate Social Responsibility and ESG, a nd Chief Sustainability Officer Read more: Digital Divide Issue Brief • Community Engagement Issue Brief Safeguarding Children Issue Brief • Responsible Use of Products and Services Issue Brief FROM 2 021-202 3 $2B committed to address the di gital di vi de Digital Learning and Literacy AT&T Connected Learning includes digital learning and literacy initiatives to help students, parents and families make the most of broadband connections. Connectivity alone is not enough to keep students engaged in learning, especially in a remote or hybrid setting. In 2021, AT&T created The Achievery in collaboration with WarnerMedia, to help make online learning more entertaining, engaging and inspiring for today’s connected students everywhere they learn. The Achievery is a free digital learning platform featuring popular entertainment content from WarnerMedia and other world class NGO and programming partners, alongside lesson plans and learning activities developed by leading education organizations. When working to address the homework gap, helping kids also means helping parents. Together with the Public Library Association, we’ve launched a series of digital literacy courses to help parents and caregivers build skills and confidence using technology so they can better support their child’s online learning. Topics include using computers and mobile devices, navigating the internet and using teleconferencing tools. All are available free at digitalliteracy.att.com . Through AT&T ScreenReady ® , we’re also helping parents and caregivers create the right online experience for their families, with information such as how to set parental controls on connected devices – plus online safety and digital parenting tips from experts including Common Sense Media, Family Online Safety Institute and others. Progress: Open 20 Connected Learning Centers by 2023 8 0 20 Committed Today, a n e stimated 4 2 milli on 11 Americans don’t have broadband internet access at home. Affordable and reliable connectivity is critical for remote work, learning and c ommerce – an d for s t aying di gitally c onnected t o f amily, f riends, ne ws an d information. A ddressing the digital divide is strategically important to AT&T, as it helps drive social c hange wh ile e xpanding ou r ne twork r each and deepening v aluable c ol laboration w ith communities, authorities and non-government organizations (NGOs). In 2021, AT&T announced an expanded commitment to invest $2 billion over the next 3 years to help address the digital divide. This effort includes our low-cost broadband offerings, ongoing c ommunity i nvestments and mo re t o he lp the n a t ion's mo st v ulnerable co mmunities. Our digital divide strategy includes efforts to promote broadband affordability, availability and a doption. W e’re al so i n vesting ou r r esources and k no wledge t o advance the d igital skills needed to thrive in the classrooms and workplaces of today and tomorrow. This work involves collaboration across our entire company – engaging teams such as Product Development, CSR, Public Policy, External and Legislative Affairs, Network Technology and Operations, Finance and Marketing. A T&T Connected Learning A T&T-commissioned research shows that 35% of parents and 39% of teachers say their children rely on internet connectivity outside the home. As part of our $2 billion c ommitment, w e’ve es tablished AT&T C onnected L earning , a multi-year initiative focused o n n arrowing the ho mework g ap b y c onnecting k ids a cross the c ountry to high quality digital learning resources. We’re investing in digital inclusion, digital literacy and digital learning to help connect today’s students and their families with skills, tools and opportunities for success – in and out of the classroom. W e’re tracking progress toward our 2025 goal to provide 1 million people in need with digital resources through AT&T Connected Learning. Through 2021, we engaged more than 72,000 individuals through digital inclusion initiatives such as partnerships to provide refurbished devices to low-income students and families, resources to support digital learning and l iteracy, and i nvestments i n pr ograms th at boost e mployment o pp ortunities. Progress: Provide 1 million people in need with digital resources by 2025 >72,000 0 1,000,000 Digital Inclusion Digital Literacy Digital Learning Employment Opportunities AT&T CONNECTED LEARNING PILLARS OVERVIEW AT&T AND SHAREHOLDERS CUSTOMERS AND COMMUNITIES EMPLOYEES SUPPLIERS ENVIRONMENT GOVERNANCE GOALS SUMMARY KPI s AT&T ESG SUMMARY REPORT 2022 AT&T ESG SUMMARY REPORT 2022 14 15
Vanderburgh County broadband expansion AT&T collaborates with federal, state and local government to extend broadband throughout rural America. In 2021, we announced a $39 million project with Vanderburgh County, Indiana to expand high- speed fiber broadband to more than 20,000 households and businesses – s upporting a region where approximately one-third of the county population is without access to fixed broadband solutions. Our public-private collaboration with Vanderburgh County builds on over $1 billion invested by AT&T in our Indiana wireless and wireline networks between 2018–2020. Supporting employment opportunities The technology and media industries need a qualified, robust and diverse talent pipeline to remain competitive in the global economy. This includes individuals with “hard” skills such as coding and data analytics as well as “soft” skills that technology cannot replace, including leadership, collaboration and effective decision-making. For that reason, AT&T is investing in programs that address the multidimensional nature of today’s skills gaps to prepare people for career success. Our 2021 contributions support organizations such as All Star Code, Code.org, Per Scholas, Roadtrip Nation and Techbridge Girls. We also contributed to programs focused on empowering girls and young women with tech and STEM skills, and increasing the representation of women in STEM careers. We support organizations including Black Girls CODE, Girls Inc., Girl Scouts and Girls Who Code. WarnerMedia 8 Access to Action provides individuals who haven’t traditionally had pathways into the entertainment industry with access to below-the-line jobs at WarnerMedia. The program fosters a more creative and inclusive production workforce and to date has placed more than 500 candidates in 4 countries on WarnerMedia film and television productions. Our collaboration with Year Up We’re collaborating with Year Up, an organization that prepares young people for careers while earning college credits through a year-long program. In alignment with our commitment to help narrow the digital divide, by 2023 we plan to host 200 Year Up interns and alums annually. Since 2019, we’ve hosted 162 Year Up program participants and hired 50 former Year Up interns and alums across the country. As we move further into a post-pandemic workplace, we look forward to accelerating efforts and bringing more Year Up interns to AT&T locations. AT&T Year Up interns gain access to multiple departments and company platforms during their internship. They work alongside employees such as financial analysts or software engineers and can use our internal learning website, which features skills training for topics like customer service and business intelligence. We also host a regular speaker series and mentoring opportunities to build upon interns’ networking skills and experience with corporate culture. Affordable connectivity AT&T is driving down the cost of home internet for eligible households in our 21-state wireline footprint to the best monthly rate possible – $0. This free option is made possible by combining a new service plan from our low-cost Access f r om A T&T ® program with federal benefits from the Affordable Connectivity Program (ACP) . Our new service plan provides internet up to 100 Mbps for $30 per month. Households that qualify for ACP also qualify for our Access from AT&T p rogram and those that t ake advantage of the ACP benefit (up to $30 per month, or up to $75 per month for those on qualified Tribal lands) can then receive internet service at no monthly charge. Taking our impact abroad The COVID-19 pandemic has severely impacted the livelihood and health of families, workers and businesses across Asia – where micro, small and medium-sized businesses (MSMEs) help drive the region's economy. In Malaysia, the MSME sector suffered more than $9 billion in losses last year. And in Indonesia, more than 30 million MSME's have closed. Female entrepreneurs have been among the most affected. AT&T, in collaboration with Visa and the Asia Foundation, is launching the Accelerate initiative to help 6,000 women-led MSMEs in rural and remote communities gain access to technology, training and practical skills to reach customers, grow their business and engage in the digital economy of today and tomorrow. CUSTOMERS AND COMMUNITIES DIGITAL DIVIDE Read more: Digital Divide Issue Brief Read more: Digital Divide Issue Brief Digital divide “I discovered the Access from AT&T program. It was the segue for me to apply for benefits, look for childcare programs, look for jobs and attend training. It literally was my foundation to be able to get back on my feet.” – Ebony Ford, Access from AT&T customer in Atlanta Connecting rural America Many rural Americans are poorly served by fixed broadband, impacting their ability to connect with others and access products and services. Through our participation in the Federal Communications Commission (FCC) Connect America Fund (CAF) program, we’ve been working to meet the connectivity needs of customers in predominantly rural areas. Through the end of 2021, we’ve used funds from this program to help deploy, offer and maintain internet and voice services to over 1.1 million homes and small-business locations in FCC-identified areas of need. We're also working to improve connectivity in rural communities with AT&T Wireless Internet service, which provides cellular voice and internet service for homes or offices that aren’t easily reached by terrestrial network solutions. AT&T YEAR UP PROGRAM PARTICIPANTS SINCE 2019 162 FORMER YEAR UP INTERNS AND ALUMS HIRED SINCE 2019 50 PREDOMINANTLY RURAL LOCATIONS REACHED BY AT&T THROUGH CAF FUNDING >1 .1M OVERVIEW AT&T AND SHAREHOLDERS CUSTOMERS AND COMMUNITIES EMPLOYEES SUPPLIERS ENVIRONMENT GOVERNANCE GOALS SUMMARY Access from AT&T Plan Federal ACP Benefit + Free Internet KPI s AT&T ESG SUMMARY REPORT 2022 AT&T ESG SUMMARY REPORT 2022 16 17
FirstNet is the only nationwide, high-speed broadband communications platform dedicated to America’s fi rst responders and public safety community. Built by AT&T in public-private partnership with the First Responder Network Authority, FirstNet covers more than 2.71 million square miles – reaching over 99% of the U.S. population. We’ve launched nearly 1,000 cell sites across the country to expand rural, remote and Tribal coverage, enabling more first responders and the communities they serve to access critical communications capabilities when needed most. For the 4th consecutive year, Frost & Sullivan has commended AT&T for innovation, market-leading performance and unmatched customer care in public safety solutions. In 2021, we earned their Public Safety Solutions Company of the Year award. FirstNet focuses on mental health By its very nature, emergency response is stressful. When we began the historic FirstNet initiative, we committed to Be There for America’s first responders. Now, we’ve established the FirstNet Health & Wellness Coalition to support their holistic health and wellness. Mental health is a key priority for AT&T and FirstNet, as the rates of PTSD, depression, anxiety – and even suicidal thought – among public safety personnel far exceed the general population. We’re supporting first responder mental health programs with organizations such as the Quell Foundation, Boulder Crest Foundation, Blue Help, the National Association of Emergency Medical Technicians and the International Association of Chiefs of Police. And we’re adding health and wellness apps to the FirstNet App Catalog. We’re committed to supporting local communities impacted by natural disasters. When disaster strikes, AT&T and employees demonstrate our corporate value Be There by assisting victims and affected communities through disaster response activities, corporate giving, volunteerism and support for impacted coworkers. AT&T is committed to working with strategic non-profit partners to provide solutions across all phases of the disaster lifecycle, including resiliency preparedness and long-term recovery. In 2021, we supported more than 200,000 individuals impacted by natural disasters such as Winter Storm Uri, historic California wildfires and the third-busiest hurricane season on record. Our community resilience efforts are motivated by our 2030 goal to help 1 million people prepare for and recover from the impacts of disasters. Progress: Help 1 million people prepare and recover by 2030 200,000 0 1,000,000 We also proactively monitor potential nature-related threats to our network, employees and communities through our Weather Operations Center. In the event of a disaster or other emergency, we implement procedures to quickly restore network functionality, provide critical resources to impacted employees, field customer inquiries and return or establish service in the communities where we operate. CUSTOMERS AND COMMUNITIES COMMUNITY RESLIENCE Read more: Community Engagement Issue Brief FirstNet Community resilience Read more: Business Continuity, Longevity & Innovation Issue Brief Network Quality & Reliability Issue Brief “AT&T’s commitment to innovation has provided public safety agencies with the tools to deliver reliable, mission-ready solutions that transform the way first responders prepare, react and respond to emergency events.” – Brent Iadarola, Vice President, Frost & Sullivan CONNECTIONS NATIONWIDE 3M+ Meet ROG the Dog In 2021, we launched FirstNet ROG the Dog - animal assisted therapy to support public safety on the front lines. Affectionately named after the FirstNet Response Operations Group (ROG) – the team led by former first responders that guides deployment of the FirstNet fleet of dedicated deployable network assets – ROG the Dog is a pack of more than 2 dozen trained labradoodles that specialize in animal assisted therapy for first responders. Agencies using FirstNet can request a therapy dog in the same way they request a deployable network asset, such as a mobile cell site or drone, from the FirstNet fleet. And just like the fleet, the therapy dogs are available at no additional charge to support personnel on the front lines. Enhancing consumer preparedness Unless families have experienced natural disasters in the past, most are not fully prepared for an emergency. These are stressful and potentially life-threatening situations. And for vulnerable families, a crisis can destabilize their lives for years to come. Planning ahead and being prepared makes people more resilient in the face of disasters. That’s why a team of AT&T employees collaborated with non-profit SBP , a social impact organization focused on disaster resilience and recovery, to develop the Equip app. By combining easy-to-use tools, shareable resources and expert advice consolidated in one place, Equip makes it simple and engaging for households to prepare for a disaster long before it happens. We released the Equip app at the onset of the 2021 disaster season and are working with SBP to launch an awareness campaign and video tutorials to enhance the use and capacity of Equip even further. AGENCIES SUBSCRIBED 19,500+ U.S. POPULATION COVERED >99% SQUARE MILES COVERED 2.81M OVERVIEW AT&T AND SHAREHOLDERS CUSTOMERS AND COMMUNITIES EMPLOYEES SUPPLIERS ENVIRONMENT GOVERNANCE GOALS SUMMARY AT&T Employee Relief Fund Through the AT&T Employee Relief Fund, our employees can support each other when natural disasters, house fires or other unexpected personal hardships arise. EMPLOYEE RELIEF FUND DISTRIBUTIONS IN 2021 $1.4M+ EMPLOYEES RECEIVING SUPPORT IN 2021 1,600+ 2021 AT&T FOUNDATION DISASTER RELIEF $1.2M 2021 AT&T NETWORK DISASTER RECOVERY SPEND >$300M KPI s AT&T ESG SUMMARY REPORT 2022 AT&T ESG SUMMARY REPORT 2022 18 19
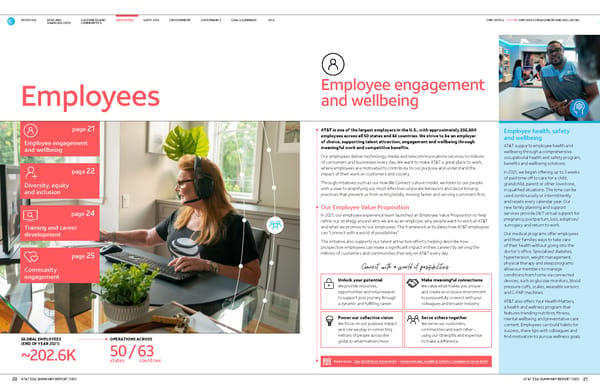
Employee engagement and wellbeing AT&T is one of the largest employers in the U.S., with approximately 202,600 employees across all 50 states and 63 countries. We strive to be an employer of choice, supporting talent attraction, engagement and wellbeing through meaningful work and competitive benefits. Our employees deliver technology, media and telecommunications services to millions of consumers and businesses every day. We want to make AT&T a great place to work, where employees are motivated to contribute to our purpose and understand the impact of their work on customers and society. Through initiatives such as our How We Connect culture model, we listen to our people with a view to amplifying our most effective corporate behaviors and discontinuing practices that prevent us from acting boldly, moving faster and serving customers first. Our Employee Value Proposition In 2021, our employee experience team launched an Employee Value Proposition to help refine our strategy around who we are as an employer, why people want to work at AT&T and what we promise to our employees. The framework articulates how AT&T employees can “connect with a world of possibilities”. The initiative also supports our talent attraction efforts, helping describe how prospective employees can make a significant impact in their careers by serving the millions of customers and communities that rely on AT&T every day. Employee health, safety and wellbeing AT&T supports employee health and wellbeing through a comprehensive occupational health and safety program, benefits and wellbeing solutions. In 2021, we began offering up to 3 weeks of paid time off to care for a child, grandchild, parent or other loved one, in qualified situations. The time can be used continuously or intermittently and resets every calendar year. Our new family planning and support services provide 24/7 virtual support for pregnancy, postpartum, loss, adoption/ surrogacy and return to work. Our medical programs offer employees and their families ways to take care of their health without going into the doctor’s office. Specialized diabetes, hypertension, weight management, physical therapy and sleep programs allow our members to manage conditions from home via connected devices, such as glucose monitors, blood pressure cuffs, scales, wearable sensors and C-PAP machines. AT&T also offers Your Health Matters, a health and wellness program that features trending nutrition, fitness, mental wellbeing and preventative care content. Employees can build habits for success, share tips with colleagues and find motivation to pursue wellness goals. Employees GLOBAL EMPLOYEES (END OF YEAR 2021) ~202.6K Employee engagement and wellbeing page 21 Diversity, equity and inclusion page 22 Training and career development page 24 Community engagement page 25 Read more: Our Workforce Issue Brief • Environment, Health & Safety Compliance Issue Brief OPERATIONS ACROSS 50/ 63 states countries EMPLOYEES EMPLOYEE ENGAGEMENT AND WELLBEING Connect with a world of possibilities Unlock your potential We provide resources, opportunities and total rewards to support your journey through a dynamic and fulfilling career. Power our collective vision We focus on our purpose, impact and role we play in connecting millions of people across the globe to what matters most. Make meaningful connections We value what makes you unique – and create an inclusive environment to purposefully connect with your colleagues and broader industry. Serve others together We serve our customers, communities and each other – using our strengths and expertise to make a difference. OVERVIEW AT&T AND SHAREHOLDERS CUSTOMERS AND COMMUNITIES EMPLOYEES SUPPLIERS ENVIRONMENT GOVERNANCE GOALS SUMMARY KPI s AT&T ESG SUMMARY REPORT 2022 AT&T ESG SUMMARY REPORT 2022 20 21
“We have a longstanding value of standing for equality, which starts by demonstrating diversity, equity and inclusion within our own workforce. “ – Corey Anthony, Senior Vice President, Chie f Diversity and Development Officer Diversity on screen and behind the camera Since formalizing the industry’s first Production Diversity Policy in 2018, WarnerMedia 8 has shown measurable progress toward increased equity and inclusion: On-screen representation Behind-the-camera representation From our Board of Directors to front-line workers across the globe, we seek talented p eople w h o r epres ent a m ix o f backgro unds, i dentities, ab ilities an d experiences. This is critical to ensure the services we offer and content we create reflect the diversity and interests of society and of the world around us. Our focus on DE&I dates back decades. In 1968, AT&T became one of the first American corporations to launch a supplier diversity program. And in 1975, we were one of the first to adopt a policy prohibiting employee discrimination based on sexual orientation. Supporting a diverse workforce AT&T’s diverse and inclusive workforce is a product of continuous effort to create a culture where employees from every segment of society are treated with fairness and provided equal opportunities for career advancement. In 2021, more than 55% of open positions and 53% of promotions at AT&T were filled by diverse candidates. 2 AT&T’s Chief Diversity and Development Officer , a member of our CSR Governance Council, lead s our strategy for employee DE&I, as well as our equal employment opportunity and affirmative action policies. To promote employe e engagement and cross-functional DE&I initiatives across our operating companies, we also convene 4 diversity councils, including the CEO’s Diversity Council led by our most senior executive. We monitor indicators of employee diversity, which help us understand the makeup of our workforce across management levels and geographies. In 2021, we also enhanced the transparency of our workforce diversity by publicly releasing both AT&T and WarnerMedia Federal EEO-1 data. Diversity, equity and inclusion (DE&I) Read more: Our Workforce Issue Brief • AT&T DEI Report and website AT&T and WarnerMedia EEO-1 repor ts Read more: Our Workforce Issue Brief • AT&T DE&I Report and website Recognition of our DE&I efforts We’re proud of the external recognition we receive for our dedication to DE&I. In 2021, AT&T was named to several DiversityInc specialty lists, including recognition as a company for: • Executive Diversity Councils • Supplier Diversity • Mentoring • Employee Resource Groups • LGBTQ+ Employees • Black Executives This rec ognition follows our 2020 induction into the DiversityInc Hall of Fame. IN 2021, AT&T RECEIVED A 100% score on the Disability Equality Index for the 7th consecutive year. WOMEN 34.3% Global INDIVIDUALS WITH DISABILITIES 13 7K U.S. LGBTQ+ INDIVIDUALS 13 ~3.2K U.S. WOMEN 33.6% U.S. PEOPL E OF COLOR 12 45.8% U.S. VETERA NS 13 ~12.5K U.S. Fostering an inclusive culture AT&T recognizes a diverse workforce is most effective when supported by an inclusive culture. Our DE&I strategy includes a range of initiatives designed to create a workplace where diversity is respected, valued and celebrated. Across the enterprise, we have more than 37 employee groups and networks with more than 145,250 memberships representing the diverse cultural and experiential dimensions of our workforce. All groups are open to all employees. Several of our employee groups, such as Mujeres en Acción and Pulse of India, specifically engage employees outside of the U.S. In 2021, we launched Faith@Work to bring employees together for education and dialogue on religious diversity, plus interfaith collaboration and community engagement. These organizations exemplify our company’s commitment to DE&I through efforts in the workplace, marketplace and community – while focusing on members’ professional development and opportunities for community service. EMPLOYEE GROUP MEMBERSHIPS >145K Over the past year we also launched the Equality First app, which encourages employees to gain new perspectives and get to know each other better through guided discussions. The platform also features a podcast series, employee videos and a tool to help participants access and build their understanding of social bias. Our support for DE&I business collaboration AT&T recognizes the injustices and social inequities often faced by Black Americans, including higher unemployment levels. To help address these challenges, we joined the OneTen coalition – a group of corporations pledging to collectively hire 1 million Black Americans by 2030. Beyond our own workforce, we’re committing our corporate influence to champion equity and combat injustices that impact employees in the communities we serve. AT&T supports: • The Business Coalition for the Equality Act – a group of U.S. employers supporting the addition of LGBTQ+ individuals to groups afforded basic protections under U.S. federal law • The United Nations (U.N.) Standards of Conduct for Business , which offer a holistic framework of best practices to help combat discrimination based on sexual orientation and gender identity globally • The U.N. Women’s Empowerment Principles , signaling our commitment to promoting gender equality and women’s empowerment in the workplace, marketplace and community. • The Hispanic Promise , a first-of-its-kind national pledge to hire, promote, retain and celebrate Hispanics in the workplace EMPLOYEES DIVERSITY, EQUITY AND INCLUSION 2020 WarnerMedia Scripted Shows 2020 Warner Bros. Films Women 36% 2% 30% 4% 28% 5% 27% 4% People of color 29% 5% 29% 5% 29% 6% 27% 4% OVERVIEW AT&T AND SHAREHOLDERS CUSTOMERS AND COMMUNITIES EMPLOYEES SUPPLIERS ENVIRONMENT GOVERNANCE GOALS SUMMARY Employee demographics (end of year 2020) Since 2019 Since 2019 KPI s AT&T ESG SUMMARY REPORT 2022 AT&T ESG SUMMARY REPORT 2022 22 23
AT&T Believes SM combines our employees’ generosity of time and resources with AT&T’s longstanding external relationships, corporate contributions and foundation grants, to make a difference in our communities. In 2021, we launched AT&T Believes in Spain and Belgium, adding to more than 40 U.S. and international markets where we’re making a positive impact. We’re advancing opportunities in education, careers and quality of life through activations that help bridge the digital divide, build job skills and provide basic necessities in times of crisis. In 2022, through AT&T Believes our employees will begin tutoring and mentoring learners at AT&T Connected Learning Centers across the U.S. (page 15). Internal research shows that employees participating in volunteerism and other community engagement initiatives are more likely to recommend AT&T as a place to work, stay at AT&T longer and feel better about working for the company. We’ve set a target to engage 50% of our employees worldwide in communities through grassroots volunteerism and giving initiatives by 2030. In 2021, AT&T employees volunteered more than 443,838 hours in community outreach activities – valued at more than $12 million. 14 AT&T’s community engagement efforts and philanthropic giving – including corporate contributions and foundation grants – support initiatives that promote academic success, provide job skills training, drive innovation, empower women and underrepresented communities and respond to worldwide disasters and emergencies. TOTAL OF 2021 EMPLOYEE DONATIONS 16 $20.9M 202 1 CORPORATE AND AT& T FOUNDATION GIVING 15 $2 02 . 0 5 M E MPLOYEE VOLUNTEER HOURS 16 >443.8K VALUE OF 2021 EMPLOYEE VOLUNTEERISM 14 >$12M AT&T invests in employee development programs to train – and retain – a skilled and capable workforce. Our internal training organization, AT&T University, works across our business to create and deliver best-in-class training, helping develop diverse leadership and energize our workforce to drive innovation. We assess the effectiveness of our training initiatives by measuring employee performance and career progression, as well as our ability to fill positions internally. Our metrics show that those who take part in our training and development initiatives are: • more likely to receive a higher performance rating at the end of the year • more likely to receive a higher key contributor award at the end of the year • more likely to move laterally • less likely to leave the company Targeting training to employee needs We seek innovative ways to develop our people with the right training opportunities. Our Real Time Training program delivers small-bite content to individual employees, to improve role-specific key performance indicators (KPIs). We identify who needs training and when, as well as which training solution is most likely to drive the greatest performance improvement for an employee’s respective KPIs. In 20 21 , approximately 1,950 employees received real time tutorial recommendations, resulting in: • ~4.3K incremental new customers • ~$4.5M in incremental annual revenue Monitoring training effectiveness We monitor employee training through a platform called the Personal Learning Experience (PLE), where employees book, complete and log online courses. PLE also features a skills assessment tool to help employees identify their competencies, see what jobs are available within the company, the skills required for each position and whether demand in that particular area is projected to grow or decline in the years ahead. Training and career development Community engagement Rewarding community service AT&T applauds employees who make an outsized contribution to community engagement efforts. The President’s Volunteer Service Award (PVSA) is recognition from the President of the United States of individuals who have dedicated at least 100 hours to their communities during the year. In 2021, AT&T recognized 1,273 U.S. employees as PVSA recipients for their 2020 volunteer time. We also recognized 22 international employees who volunteered 100 hours or more in 2020. INVESTED IN EMPLOYEE TRAINING AND DEVELOPMENT PROGRAMS IN 2021 2 $158M HOURS OF EMPLOYEE TRAINING IN 2021 2 15M EMPLOYEES REACHED IN 2021 2 210K INVESTMENT IN EMPLOYEE TUITION ASSISTANCE IN 2021 2 >$13M 2021 HOURS DEVOTED TO SKILLS TRANSFORMATION TRAINING 2 ~670K MANAGEMENT EMPLOYEE ENGAGEMENT IN SKILLS TRANSFORMATION TRAINING 2 ~58% In 2020, Chief Learning Officer magazine awarded AT&T Organization of the Year for Learning and Development, and the Editor’s Choice Award for Best in Learning Execution. EMPLOYEES COMMUNITY ENGAGEMENT Read more: Our Workforce Issue Brief Progress: Engage 50% of employees in volunteerism and giving by 2030 Read more: Community Engagement Issue Brief 95% of employees with more than 3 months of service receive a performance appraisal and review. 2 We utilize a 360-degree feedback structure that delivers well-rounded performance insights from supervisors, peers and direct reports. AT&T Environmental Champions We encourage employees to reduce their personal environmental footprint and launched the Environmental Champions program in 2020, as an employee-led platform for those with a passion to protect the environment. In 2021, membership grew by over 20%. Today, more than 1,500 employees are helping raise awareness of home-based environmental behaviors everyone can bring back to work. The program includes: • An online portal that inspires employees to connect, learn, share and act • A platform for purchasing discounted environmentally friendly products • A challenge and awards system that en courages employees to complete activities and missions that are beneficial to the environment and help develop habits that further environmental sustainability 30% 17 0 50% OVERVIEW AT&T AND SHAREHOLDERS CUSTOMERS AND COMMUNITIES EMPLOYEES SUPPLIERS ENVIRONMENT GOVERNANCE GOALS SUMMARY 2021 AVERAGE GIVING PER EMPLOYEE DONOR 16 $382 KPI s AT&T ESG SUMMARY REPORT 2022 AT&T ESG SUMMARY REPORT 2022 24 25
Suppliers 2021 TOTAL SPEND ON GOODS AND SERVICES 18 >$60B 2021 SPEND WITH DIVERSE SUPPLIERS 3 $13.2B A resilient and sustainable supply chain page 27 ESG and the supplier lifecycle page 28 GLOBAL SUPPLIERS, ACROSS 65 COUNTRIES 18 >20K Reducing supplier emissions As part of our work to reduce GHG emissions beyond AT&T’s own footprint, we set a science-based target to ensure 50% of our suppliers have, or will, set their own science-based Scope 1 and Scope 2 GHG targets by 2024. 20 THROUGH 2021 47% of suppliers have set science-based targets Enhancing supplier diversity In 1968, AT&T became one of the first U.S. corporations to have a supplier diversity program. Diverse suppliers bring value through unique skills and innovative ideas. Our program connects specialized internal supplier diversity managers with our sourcing teams to assist minority-, woman-, veteran-, LGBTQ+- and disability- owned enterprises around the U.S. with opportunities to provide products and services to AT&T. Our annual goal for supplier diversity spend is to surpass $10 billion in total procurement expenditures. 3 MORE THAN $213B procured with minority-, woman-, veteran-, LGBTQ+- and disability- owned enterprises since 1969 3 AT&T enhances our resilience by integrating ESG factors into supplier evaluation and selection. We’re also extending our environmental and social impact by reviewing our suppliers’ operations and encouraging them to set GHG emissions targets. Supply chain ESG integration We expect supplier business operations to be conducted in compliance with sustainability and diversity clauses in our contracts, which require conformance with the AT&T Principles of Conduct for Suppliers (Principles) and the AT&T Human Rights Policy. We require suppliers to verify adherence to our Principles through a self-attestation process every 18–24 months. Annually, we engage suppliers representing 80% of spend 19 with sustainability assessments developed through both CDP and the Telecommunications Industry Association. These assessments, which cover a range of ESG factors such as environmental management, circular economy, stakeholder engagement and a supplier’s management of its own supply chain, support our ability to integrate sustainability metrics into sourcing decisions. In addition, through our participation alongside peer telecom companies in the Joint Audit Cooperation, we engage suppliers at risk of noncompliance with social standards – such as child or forced labor, health and safety, freedom of association, working hours or compensation – in on-site audits and corrective action plans. Geographic risk mitigation In recent years, the world’s supply chain has faced unprecedented disruption. Surprisingly, past geopolitical events helped ensure AT&T was better prepared. 2018 U.S. tariffs on Chinese goods illustrated the risks associated with geographic supplier concentration and incentivized many of our suppliers to diversify their manufacturing footprint and reduce reliance on materials from a single country. To meet such challenges, AT&T began enhancing visibility into where our suppliers – and their suppliers – concentrate manufacturing of key products and components. This intelligence makes us better prepared for unforeseen events, such as the COVID-19 pandemic, and helps us achieve an industry-leading cost structure balanced with geographic risk mitigation. Our resilient and responsible supply chain SUPPLIERS OUR RESILIENT AND RESPONSIBLE SUPPLY CHAIN Read more: Responsible Supply Chain Issue Brief Business Continuity, Longevity & Innovation Issue Brief Human Rights Issue Brief • AT&T Supplier Diversity website Progress: Ensure 50% of suppliers adopt science- based GHG targets by 2024 2021 SUPPLIER ENGAGEMENT LEADER 47% 0 50% OVERVIEW AT&T AND SHAREHOLDERS CUSTOMERS AND COMMUNITIES EMPLOYEES SUPPLIERS ENVIRONMENT GOVERNANCE GOALS SUMMARY KPI s AT&T ESG SUMMARY REPORT 2022 AT&T ESG SUMMARY REPORT 2022 26 27
E X P E C T A T I O N S S E L E C T I O N E V A L U A T I O N E N G A G E M E N T Supplier screening and contracting Risk screening is an important part of our supplier selection process. Our strategy includes training AT&T sourcing managers on the principles of sustainability and diversity, requiring compliance with contractual sustainability and diversity clauses for tier 1 and 2 suppliers, and monitoring supplier sustainability and diversity performance at varying frequencies based on high-risk activities analysis. Preferred supplier program AT&T’s Preferred Supplier Program allows us to recognize high-performing suppliers that have demonstrated a commitment to focus areas such as diversity and environmental sustainability. We incorporate these factors into sourcing decisions: • Sustainability metrics such as GHG targets and emissions, waste management and water intensity • Diversity and inclusion metrics reflecting supplier workforce ethnic and gender diversity. Supplier principles and collaboration AT&T suppliers are expected to comply with sustainability and diversity clauses in our contracts, which also require conformance with our AT&T Principles of Conduct for Suppliers and the AT&T Human Rights Policy. We work with organizations such as Global Enabling Sustainability Initiative to improve performance across the value chain and drive achievement of U.N. Sustainable Development Goals. GHG emissions reduction We expect our suppliers to reduce their environmental footprint and to set GHG emissions targets. AT&T set a 2024 science-based target to ensure 50% of our suppliers 20 (as a portion of spend) set their own science-based Scope 1 and Scope 2 GHG targets. Supplier diversity Our Supplier Diversity organization connects certified diverse minority-, woman-, veteran-, LGBTQ+- and disability-owned business enterprises with opportunities to provide products and services to AT&T. Our annual goal is to surpass $10 billion in diverse spend. 3 Attestation and assessments We require suppliers to verify adherence to our Principles of Conduct for Suppliers every 18–24 months. Additionally, we annually engage suppliers representing 80% of spend 19 with ESG assessments developed through both CDP and the Telecommunications Industry Association. These assessments support our ability to integrate sustainability metrics into sourcing decisions. Emissions targets and performance We participate in the CDP supply chain program to analyze data on suppliers’ emissions reduction goals and progress over time, and to reinforce the importance of supplier sustainability disclosures. Diverse supplier spend We evaluate our total spend with diverse suppliers in an effort to drive impactful and meaningful change in their communities through overall economic empowerment and growth. Audits and corrective action planning Collaborating with peer telecom companies in the Joint Audit Cooperation (JAC), we conduct on-site audits and develop corrective action plans for suppliers at risk of noncompliance with social standards, such as child or forced labor, health and safety, freedom of association, working hours or compensation. Supplier engagement on GHG emissions reduction AT&T set a 2024 science-based target to ensure 50% of our suppliers 20 (as a portion of spend) set their own science-based Scope 1 and Scope 2 emissions targets. We work with key suppliers individually to help set their targets and encourage continuous improvement in their emissions reduction work. Support and acceleration programs for diverse suppliers We offer executive-level education and scholarships to support CEOs of diverse- owned businesses. Our Supplier Diversity organization sponsors the Business Growth Acceleration Program, a mentoring series that helps diverse-owned businesses thrive in today’s market. We also offer an early payment program to provide qualified suppliers with flexible financing options. ESG and the supplier lifecycle IN 2021 202 suppliers reported their greenhouse gas (GHG) emissions through the CDP supply chain program. OVER 80% of suppliers by spend are engaged through ESG assessments. 19 IN 2021 $13.2B of our total supplier spend was with certified- diverse businesses. 3 TO DATE 47% of suppliers by spend have set their own science-based Scope 1 and Scope 2 green- house gas emissions targets. 20 IN 2021 participants in our supplier financing program included: • 35 certified women-owned enterprises • 41 certified minority enterprises • 7 certified disabled-veteran enterprises IN 2021 JAC audits identified 402 corrective actions and closed ~71% of all identified corrective actions – including ~61% rated as minor, ~35% rated as major, and ~5% flagged for priority. AT&T’s approach to ESG in the supply chain is designed to mitigate risk and enhance positive impact across the supplier lifecycle. This diagram categorizes key mechanisms according to: ESG operational integration Reducing GHG emissions Supplier diversity SUPPLIERS ESG AND THE SUPPLIER LIEFCYCLE OVERVIEW AT&T AND SHAREHOLDERS CUSTOMERS AND COMMUNITIES EMPLOYEES SUPPLIERS ENVIRONMENT GOVERNANCE GOALS SUMMARY KPI s AT&T ESG SUMMARY REPORT 2022 AT&T ESG SUMMARY REPORT 2022 28 29
AT&T a n d climate change AT&T is extending our positive environmental impact and optimizing the resilience of our business through enhancements in resource efficiency and efforts to protect our network and stakeholders from environmental risk. Climate-related strategy, metrics and targets The global transition to a low carbon economy presents risks and opportunities for AT&T and broader society. We’re working to reduce our carbon emissions, while enabling solutions that can help our customers and communities transition to net zero. Climate-related oversight and governance The Governance and Policy Committe e of the AT&T Board of Directors oversees the entirety o f AT&T’s environment al and climate-related strategy, including emi ssi ons re duction objectives, consumption of electricity and water, investments in renewable energy, and waste m ana ge ment. The Audit Committee oversees AT&T’s internal enterprise risk assessment activities and audit functions, whi ch incorporate climate-related risks and disclosures. Our Chief Sustainability Officer leads internal management of AT&T’s environmental and climate-relat ed strategy, risks and opportuniti es. Our President – Ne twork Engineering and Operations has responsibility for the resilience of our network, including energy and water use, and oversees th e management of climate-related impacts to our operations. This includes o ur co mmitments to renewable energy, network disaster response and business co nt inuit y planning. Our Senior Vice President (SVP) – Audit Services oversees the integration of ES G issues, including environmental and climate-related impa cts, into corporat e ent erprise risk assessment activities. Environment ANNUALIZED COST SAVINGS FROM ENERGY PROJECTS SINCE 2010 >$733M Read more: 2022 Proxy Statement Our Corporate Governance Issue Brief The increasing frequency and severity of extreme weather presents risks for our network that could negatively impact our business, customers and communities if not managed well. Page 9 provides more information on how we integrate physical risk into our network resilience efforts. Natural disasters also have direct impacts on our employees, customers and communities – with disproportionately greater impacts in disadvantaged areas. Page 19 provides more information on how we support disaster relief efforts across our communities. ENVIRONMENT AT&T AND CLIMATE CHANGE AT&T and climate change page 31 Gigaton Goal page 32 Toward carbon neutrality page 34 Water management page 36 Waste management page 37 ENERGY SAVINGS PROJECTS SINCE 2010 >151K ANNUALIZED ENERGY SAVINGS SINCE 2010 (kW H) ~ 8 .1B Read more: TCFD Report • CDP Climate Change disclosure • Climate Change Policy Energy Policy • Climate Change Issue Brief • SASB Index We’re committed to becoming carbon neutral across our global operations by 2035 4 (page 34). Progress: Achieve net zero Scope 1 and 2 GHG emissions by 2035 4 To demonstrate transparency and credibility, we’re working to reduce Scope 1 and 2 GHG emissions 63% by 2030 (2015 base year) – a science-based target aligned with a 1.5°C pathway 4 (page 34). Progress: Reduce Scope 1 and 2 GHG emissions 63% by 2030 4 36.4% (estimated) 0 Carbon neutral 36.4% (estimated) 0 63% OVERVIEW AT&T AND SHAREHOLDERS CUSTOMERS AND COMMUNITIES EMPLOYEES SUPPLIERS ENVIRONMENT GOVERNANCE GOALS SUMMARY KPI s AT&T ESG SUMMARY REPORT 2022 AT&T ESG SUMMARY REPORT 2022 30 31
ENVIRONMENT GIGATON GOAL AT&T is helping facilitate the global transition to net zero through emissions- reducing solutions for our operations, customers, employees and communities. Reducing a gigaton of emissions We’re helping customers improve their environmental footprint by driving adoption of AT&T broadband-enabled technologies that can reduce GHG emissions, such as online collaboration tools and IoT solutions for fleet, asset and building energy management. We’re measuring this impact through a methodology developed in collaboration with Carbon Trust and BSR. In 2021, we announced the AT&T Gigaton Goal to deliver connectivity solutions that enable customers to collectively reduce a gigaton (1 billion metric tons) of GHG emissions between 2018-2035. 1 gigaton is approximately equal to 15% of 2020 U.S. GHG emissions, nearly 3% of 2020 global energy-related emissions or 1.6 billion flights from Los Angeles to New York. 21 Our gigaton goal recognizes that connectivity has a role in helping our customers mitigate climate change, at scale. AT&T-enabled customer GHG emissions reductions measured between 2018–2021 total 110.3 million metric tons of CO 2 e – approximately 11% attainment toward our gigaton goal. 22 AT&T Connected Climate Initiative As part of our efforts to achieve our gigaton goal, in 2021 we formed the Connected Climate Initiative (CCI) to convene the brightest minds from leading technology companies, AT&T Business customers, universities and non-profits. We’re working to identify best practices, develop new products and use cases, and scale the innovations of startup partners building 5G- and other broadband-enabled climate solutions. We’re making impact on a global scale by collaborating with businesses such as Microsoft, Equinix and Duke Energy. In addition, we’re leveraging innovation from research universities including Texas A&M University, the University of Missouri and Purdue University. And we’re actively exploring partnerships with others, as well. Internally, we’ve formed a “tiger team” with representatives from our CSR and AT&T Business organizations that meets regularly to build AT&T sales team expertise and customer engagement on climate-related issues, recruit new CCI partners and identify opportunities to increase AT&T revenue. In 2022, we launched a training course available to all employees, introducing CCI and explaining how AT&T can help customers address climate change. Read more: Climate Change Issue Brief • Gigaton Goal website Read more: Climate Change Issue Brief • Gigaton Goal website “AT&T has a track record of delivering sustainability results within our own large-scale operations and for our business customers across industries.” – Anne Chow, CEO, AT&T Business Gigaton Goal Progress: Gigaton Goal (1 billion metric tons of GHG emissions between 2018-2035) 110.3 million 0 1 billion OVERVIEW AT&T AND SHAREHOLDERS CUSTOMERS AND COMMUNITIES EMPLOYEES SUPPLIERS ENVIRONMENT GOVERNANCE GOALS SUMMARY AT&T Sustainability Professional Services AT&T has significant experience leveraging connectivity to reduce the environmental impact of operations – for ourselves and our customers. We’ve learned our solutions have the greatest impact when supported by the right expertise. In 2022, our professional services consulting group launched a Sustainability Professional Services team to help customers review their environmental impact and identify improvements for operational efficiency and emissions reduction. We’re also working with customers to develop climate adaptation and resilience strategies, leveraging projected climate-impact data from CCAT (page 9). Collaboration Collaborating with technology leaders to bring to market new scaled product offerings that enable business progression and emissions reduction. Solutions Delivering connectivity-driven solutions to help our AT&T Business customers reduce emissions. Research Investing in research with leading universities to explore how 5G can enable emissions reductions in key areas like transportation, energy and manufacturing. Distribution Fueling innovation and disruptive technologies that use connectivity to fundamentally change how work gets done. Traxen iQ-Cruise ™ Traxen iQ-Cruise is an AI-informed adaptive cruise control solution that delivers an average 10% increase in fuel efficiency, in addition to improved safety and driver satisfaction. Using AT&T IoT connectivity, Traxen collects topography, traffic and end-of-route congestion data to help drivers operate their vehicle’s engine and transmission at a highly efficient rate. Badger Meter Badger Meter, a provider of smart water solutions including flow measurement and water quality devices, utilizes AT&T IoT connectivity to help customers collect near real- time data to drive efficiency, reduce costs and enable conservation throughout their water distribution networks. By helping identify water leaks quickly, avoiding trips to read or power meters on or off, and arming households with water usage data, Badger Meter helps reduce wasted water and related emissions. SunPower ® SunPower, a U.S.-based solar technology and energy services provider, uses AT&T IoT connectivity to optimize the production of renewable energy and enhance operational efficiencies. SunPower works with AT&T to help monitor solar panels and battery storage, giving solar customers greater visibility into system performance and more control over how and when they use stored energy. Connected Climate Initiative Focus Areas KPI s AT&T ESG SUMMARY REPORT 2022 AT&T ESG SUMMARY REPORT 2022 32 33
Transitioning to a low-emissions fleet More than 52% of our Scope 1 emissions come from our ground vehicle fleet. We expect to lower fleet emissions at least 75% by 2035 (2015 base year) by implementing technologies such as IoT to maximize vehicle efficiency and optimize routes, as well as customer self-service solutions that can minimize the need to dispatch technician vehicles. Through the end of 2021, our fleet emissions have decreased 182,975 MT CO 2 e – down 26% from our 2015 base year. We achieved these reductions despite expanding our ground fleet to support the build-out of our fiber and 5G networks. 23 We’re reducing vehicle count in targeted portions of our fleet and plan to incorporate hybrid/electric technician vehicles to cut our emissions and reduce pollution in the communities where we operate. As part of these preparations, in 2020 AT&T became a founding member of the Corporate Electric Vehicles Alliance, working with other companies to identify the challenges and opportunities involved in adding electric fleet vehicles. In 2021, we formed an internal cross-departmental committee to collaboratively advance our fleet vehicle strategy. We began developing an Electric Vehicle (EV) Transition Master Plan that will map expected progress over the next 10 years, identify needed utility upgrades and site-specific readiness efforts and inform the procurement of EV supply equipment and EVs. AT&T is the 7th largest corporate renewable energy user Our commitment to net zero Scope 1 and 2 GHG emissions includes increasing our investments in power purchase agreements with renewable energy developers. These commitments help reduce our reported emissions and protect against rising energy costs, while adding clean electricity to the U.S. power grid. In 2022, we announced 2 new solar energy deals, increasing our domestic commitments to more than 1.7 gigawatts of renewable energy capacity – helping make AT&T the 7th largest corporate renewable energy user in the U.S., according to the EPA Green Power Partnership . In Mexico, we’re implementing a 40 GWh/year agreement to supply renewable energy to approximately 1,200 network sites. Renewable energy agreements have benefits beyond emissions reductions. Our investments create jobs, drive local economic development and improve the communities we serve. ENVIRONMENT TOWARD CARBON NEUTRALITY AT&T is working to reduce our GHG emissions by enhancing operational efficiency, reducing energy use and increasing our renewable energy commitments. We’re committed to becoming carbon neutral, achieving net zero Scope 1 and 2 GHG emissions by 2035. Our carbon neutral ambition is underpinned by our Climate Strategy & Transition Plan, which guides our work to reduce emissions across all areas of our business. We’ve also launched a science-based target to reduce Scope 1 and 2 GHG emissions 63% by 2030 (2015 base year) – aligning with a 1.5°C pathway. 4 Between 2015–2021, we reduced reported Scope 1 and 2 GHG emissions 36.4%, reaching nearly 57.8% attainment toward our 2030 target. Our efforts to improve energy efficiency (page 35) also influence water use, given the water requirements of our cooling equipment. We track water use at our facilities using the AT&T Water Scorecard, which helps identify water-saving opportunities (page 36). Leadership accountability for carbon neutrality Annual performance objectives for our Chief Sustainability Officer, AVP – Global Environmental Sustainability and other senior leaders across our business include progress toward our carbon neutral goal, science-based targets and other climate- related objectives. This means our leading environmental initiatives are considerations when determining annual merit salary increases and bonus awards for these individuals. Optimizing energy efficiency Energy efficiency is an important part of our net zero strategy, because Scope 2 GHG emissions derived from sources such as purchased electricity account for the majority of our total emissions footprint. Our focus on energy efficiency has delivered consistent reductions in carbon emissions, while contributing cost savings to the business. Our energy management efforts focus on 3 pillars: • Reductions and right-sizing: eliminating unnecessary load by removing obsolete assets and properly diminishing capacity commensurate with demand • Optimization : incorporating energy-efficient systems and practices into infrastructure and monitoring performance to address maintenance deficiencies and opportunities • Investment : purchasing large-scale renewable energy contracts that deliver clean energy to local grids and reduce our reported Scope 2 emissions For over a decade, we’ve invested in energy efficiency initiatives – such as the ongoing integration of our centrally-managed Energy and Building Management Solution – that have made a measurable impact on our energy use. Between 2010-2021, we’ve implemented more than 151,000 energy efficiency projects resulting in annualized savings of nearly 8.1 billion kWh and annualized energy cost savings of more than $733 million. Toward carbon neutrality Read more: Greenhouse Gas Emissions Issue Brief Energy Management Issue Brief • Climate Strategy & Transition Plan Climate Change Issue Brief • TCFD Report • SASB Index “In addition to reducing our emissions footprint, AT&T is investing in renewable energy because it is good for the planet and good for our business. Our approach allows us to hedge against changes in energy costs and support economic development in communities we serve.” – J oe Taylor, Vice President, Global Infrastructure Optimization and Implementation Virtualizing network functions : Over the last several years, we’ve shifted 100% of our layer 3 core network to software-defined control. This includes replacing significant portions of specialized network equipment with lower-cost, energy-efficient hardware that can virtualize many network processing functions. As a result, we’re able to deploy new network capabilities faster, while using less energy and lowering our GHG footprint. 36.4% (estimated) 0 63% Progress: Reduce Scope 1 and 2 GHG emissions 63% by 2030 4 36.4% (estimated) 0 Carbon neutral Progress: Achieve net zero Scope 1 and 2 GHG emissions by 2035 4 Tangible results from energy efficiency activities 2017 2018 2019 2020 2021 19.1 18.3 17.5 17.3 17.1 >82K million MWh (annual) 24 million kWh (cumulative) 16 17 18 19 20 >151K ~111K 0 1,000 2,000 3,000 4,000 5,000 6,000 7,000 8,000 9,000 ~147K ~138K Energy projects implemented (cumulative) Energy savings (right axis) Energy consumption (left axis) OVERVIEW AT&T AND SHAREHOLDERS CUSTOMERS AND COMMUNITIES EMPLOYEES SUPPLIERS ENVIRONMENT GOVERNANCE GOALS SUMMARY KPI s AT&T ESG SUMMARY REPORT 2022 AT&T ESG SUMMARY REPORT 2022 34 35
Reducing infrastructure waste The AT&T Global Connections and Supply Chain Investment Recovery group establishes practices that minimize the environmental impact of our internal waste and e-waste. This team works with R2-certified vendors to recover and recycle network infrastructure assets. Network materials such as copper wire, fiber-optic cable and central office equipment are dismantled, sorted and baled by commodity in preparation for sale or recycling. Scrap fiber-optic cable can be shredded and milled to become components of roofing materials or burned for resalable steam energy. In 2021, the Investment Recovery group handled more than 15.6 metric tons (MT) of domestic U.S. operational waste and kept more than 15.4 MT of these materials from land fills. 29 This equates to a 98.7% diversion rate, a slight increase from 97.6% in 2020. ENVIRONMENT WASTE MANAGEMENT Water is a shared resource that’s vital for environmental sustainability and economic prosperity. AT&T focuses on water efficiency to reduce costs and enhance our resilience, and to help preserve the availability of water in our communities. Water is a critical input for our operations. 53% of our domestic water consumption occurs at locations where most of the water usage helps maintain the controlled and cooled environment required by our communications network. 25 We track water use and savings opportunities at our facilities with the AT&T Water Scorecard. We consolidate or reduce building space, where feasible, which has reduced water consumption by 267 million gallons since 2013. Our efforts to improve energy efficiency (page 35), such as enhancements to cooling systems, also positively impact our water use. Water recycling efforts At Warner Bros. Studios 8 in Burbank, CA, we use recycled water for landscape irrigation and in select cooling towers. Since 2013, the Studios have reduced potable water consumption 42%, conserving 232.19 million gallons. We’ve incorporated smart irrigation and rainwater collection systems into the AT&T Discovery District housing our Dallas headquarters. Our headquarters building also has a water harvesting system that collects and filters condensate from our air conditioning systems, for landscape irrigation. In 2021, this harvesting system saved more than 664,000 gallons of water. These water savings efforts helped the AT&T Discovery District earn SITES Silver certification, which recognizes sustainable and resilient land development projects. AT&T is committed to reducing and responsibly handling the waste we produce from our operations and the products we sell. Our operations generate various types of waste – including general solid waste, e-waste, retired network infrastructure and office furnishings, and hazardous waste. Our approach to waste management involves reuse and recycling programs, as well as initiatives to reduce our overall waste footprint. In 2021, we collaborated with third-party waste vendors to expand our pilot IoT-enabled dumpster monitoring program. The program uses sensors to inform our waste vendors when dumpsters are full, eliminating pick-up of partial loads. By routing trucks to dumpsters only when necessary, we’re minimizing disposal costs and reducing hauling- related carbon emissions. Our 30x30 initiative Based upon learnings from our previous 100-facility zero waste program, in 2021 we set an expanded goal to reduce the amount of U.S. waste sent to landfill 30% by 2030 (2019 base year). This “30x30” initiative addresses our entire waste footprint across more than 3,000 sites and is anticipated to exceed the impact of our 100-facility effort by 104 times, based on weight. In 2021, our landfill footprint decreased 26.7% from our 2019 base year – achieving 89% of our “30x30” goal. Keeping consumer e-waste from landfill We believe all electronic devices should be reused, refurbished or recycled. We work to keep electronic materials out of landfill through reuse programs – including a free portal where customers can recycle old equipment. In 2021, we recovered more than 21 million devices including mobile phones, internet gateways and television set top boxes. 28 Read more: Water Management Issue Brief Water management Waste management SINCE 2007 >250M mobility and broadband devices and set top boxes refurbished or recycled 28 Read more: Waste Management Issue Brief • Product Life Cycle Issue Brief 26.7% 0 30% Progress: Reduce amount of U.S. waste sent to landfill 30% by 2030 30 Water intensity: gallons/$ thousand revenue 25 2017 2018 2019 2020 2021 19.74 19.02 16.63 15.59 15.87 Water intensity: gallons/individual subscriber 27 2017 2018 2019 2020 2021 13.81 12.69 14.12 11.75 11.80 Saving water through smart building management In 2021, AT&T expanded use of our Energy and Building Management Solution (EBMS) to support energy and water efficiency at 1,030 total facilities. Leveraging IoT and Big Data principles, our EBMS helps property managers ensure equipment is operating optimally, reducing mechanical cooling needs and associated water consumption. Through our work with HydroPoint , we remotely monitor our irrigation systems in real time. HydroPoint’s solutions allow us to retrofit legacy systems to reduce water consumption an average of 40%. We’ve installed HydroPoint solutions at 133 facilities since 2017 and in 2021, this solution helped us save 74 million gallons of water. OVERVIEW AT&T AND SHAREHOLDERS CUSTOMERS AND COMMUNITIES EMPLOYEES SUPPLIERS ENVIRONMENT GOVERNANCE GOALS SUMMARY KPI s AT&T ESG SUMMARY REPORT 2022 AT&T ESG SUMMARY REPORT 2022 36 37
BOARD DIRECTORS WHO IDENTIFY AS PEOPLE OF COLOR (2022) 30% INDEPENDENT BOARD CHAIR SINCE 2021 BOARD DIRECTORS WHO IDENTIFY AS FEMALE (2022) 23% Governance GOVERNANCE ESG INTEGRATION ACROSS AT&T OPERATIONS Political engagement transparency page 41 ESG integration across AT&T operations page 39 ESG material topics and reporting page 42 SENIOR LEADERS WHO IDENTIFY AS PEOPLE OF COLOR (2020) 24.6% SENIOR LEADERS WHO IDENTIFY AS FEMALE (2020) 39.3% OVERVIEW AT&T AND SHAREHOLDERS CUSTOMERS AND COMMUNITIES EMPLOYEES SUPPLIERS ENVIRONMENT GOVERNANCE GOALS SUMMARY ESG issues represent risks, opportunities and important external impacts we consider in our strategy and operations. Our approach to ESG is integrated into our business through Board of Directors oversight, officer-level leadership of ESG initiatives across relevant departments and collaboration among dedicated teams of corporate responsibility professionals and subject-matter experts throughout the company. Board oversight O ur commitment to ESG requires strong Board engagement. The Governance and Policy Committee ( G PC) assists the Board in oversight of AT&T’s ESG strategy, including related policies, programs and ESG reporting. In addition to discussions with individual GPC members throughout the year, our Senior Vice President (SVP) – Corporate Social Responsibility (CSR) and ESG, who also is our Chief Sustainability Officer (CSO), presents on relevant topics and is present at all G PC meetings for ESG dialog. In 2021, the predecessor to the G PC (the Public Policy and Corporate Reputation Committee) h eld 3 regularly scheduled meetings d iscussing topics such as: D E&I, privacy, digital divide, social innovation, supply chain responsibility, climate transition, ESG reporting, political contributions and c haritable contributions. The Audit Committee oversees compliance with legal and regulatory requirements, as well as internal enterprise risk assessment and audit functions which incorporate ESG risks and disclosures. Our Chief Compliance Officer and SVP – Audit Services each meet with the Audit Committee 4 times per year. ESG integration across AT&T operations Read more: 2022 Proxy Statement • Our Corporate Governance Issue Brief Governance and Policy Committee GLENN H. HUTCHINS (CHAIR) Chairman, North Island and Co-Founder, Silver Lake WILLIAM E. KENNARD Independent Chairman of the Bo ard, Former U.S. Ambassador to the European U nion a nd former Chairman, U.S. Fede ral Communications Commission BETH E. MOONEY Retired Chairman and Chief Executive Officer of Ke yCorp LUIS A. UBIÑAS Former President, Ford Foundation Audit Committee CYNT HIA B. TAYLOR (CHAIR) President and Chief Executive Officer, Oil States International, Inc. STEPHEN J. LUCZO Managing Partner, Crosspoint Capital Partners, L.P. MICHAEL B. MCCALLISTER Retired Chairman of the B oard and Chief Executive Officer, Humana Inc. LUIS A. UBIÑAS Former President, Ford Foundation KPI s AT&T ESG SUMMARY REPORT 2022 AT&T ESG SUMMARY REPORT 2022 38 39 We thank Samuel A. DiPiazza , Jr. ( Audit Committee; Public Policy and Corporate Reputation Committee) a nd Debra L. Lee (Public Policy and Corporate Reputation Committee) for their service, as they leave the AT&T Board to serve on the Warner Bros. Discovery Board of Directors. Updated April 2022
GOVERNANCE POLITICAL ENGAGEMENT TRANSPARENCY CHARLENE LAKE (CHAIR) Senior Vice President, Corporate Social Responsibility and ESG, and Chief Sustainability Officer COREY ANTHONY Senior Vice President, Human Resources and Chief Diversity and Development Officer MÓNICA ASPE Chief Executive Officer, AT&T Mexico LEN CALI Senior Vice President, Global Public Policy ANNE CHOW Chief Executive Officer, AT&T Business – AT&T Communications DEBBIE DIAL Senior Vice President and Controller ANDRE FUETSCH Chief Technology Officer, Network Services – AT&T Communications SUSAN JOHNSON Executive Vice President, Globa l Connections and Supply Chain – AT&T Communications K.C. KAVANAUGH Chief Communications Officer TOM MOORE Senior Vice President, Chief Compliance Office and Chief Privacy Officer AMIR ROZWADOWSKI Senior Vice President, Finance and Investor Relations VALERIE VARGAS Senior Vice President, AT&T Advertising and Retail Marketing RICK WELDAY Exe cutive Vice President and General Manager, Broadband and Video, AT&T Consumer – AT&T C ommunications CSR Governance Council Read more: 2022 Proxy Statement • Our Corporate Governance Issue Brief Executive oversight Our CSO oversees internal management of ESG strategy, risks and opportunities. Our SVP – Audit Services oversees internal enterprise risk assessment activities and audit functions, including analysis of ESG risks and disclosures, and associated processes, controls and assurance. Our CSR Governance Council (Council) is led by our CSO and comprises more than a dozen officers representing business operations and management functions aligned to our most important ESG focus areas. In addition to ad hoc meetings, the Council held 3 regularly scheduled meetings in 2021, discussing topics such as ESG reporting, digital divide, social innovation, climate transition, political contributions, DE&I, long- range goal setting and social issue engagement. In addition to the Council, we convene 5 core issue committees: Community, Employee Activation, Environment, Human Rights and Online Safety. These committees are led by senior CSR leaders and work closely with experts throughout our operating companies to implement or enhance programs and policies that address ESG issues across AT&T. OVERVIEW AT&T AND SHAREHOLDERS CUSTOMERS AND COMMUNITIES EMPLOYEES SUPPLIERS ENVIRONMENT GOVERNANCE GOALS SUMMARY Political engagement transparency Infrastructure Investment and Jobs Act In 2021, the U.S. Congress passed the Infrastructure Investment and Jobs Act, which will invest an unprecedented $65 billion into our country’s broadband future – significantly augmenting private industry’s investment of nearly $80 billion in 2020 alone. 31 AT&T supports smart investments that foster economic growth and improved productivity. We commend the Biden Administration and Congress for paving the way to universal connectivity in underserved areas, making broadband more affordable for low-income households and providing more resources for digital equity and adoption. We s trive t o br ing ou r c ustomers the i nno vation the y d emand, pr ovide s ha reholders v alue on the ir i nvestment and take s eriously the i mportant r ole th at w e can p l ay i n the he alth of our society. Our mission to connect people to greate r opportunitie s m anifests in our emp loyee v olunteerism; c o rporate and e mployee ph ilanthropy; ou r c ompany’s c ulture o f diversity, equity and inclusion; employe e benefits and our many corporat e responsibility programs th at address s ocial and e nvironmental need s . The se a ctions and c o mmitments are designed to improve the fabric of society and put the possibility o f a better future in the hand s o f p eople i n ou r communities. Our corporate mission also requires us to actively participate in the political process because federal, state and local laws have a significant impact on our employees, communities, c ustomers and o ther s takeholders. W e e ngage i n a tr an sparent and bipartisan manner, to advocate for policies that support U.S. economic stability and growth; r esilient i nfrastructures; t echnological pr og ress and a ccess t o c onnectivity; and opportunity for our employees. These issues affect our ability to hire, pay good wages, provide world-class benefits, serve our customers, make capital investments, innovate t o f oster ec o nomic g rowth and c reate s hareholder v alue. O ur e ng agements include a dvocacy and lo bbying, c orporate p olitical c ontributions, me mberships i n tr ade a ssociations, c ontributions t o o ther t ax-exempt o rganizations and e mplo yee p olitical ac tion c ommittee ( PAC) c ontributions. E lected officials hold varied and diverse views on a wide range of issues, reflecting those of our broader society. Contributions made by the company or its employee PACs to an i ndividual o r p olitical o r ganization d o no t me an the c ompany o r its e mp loyee P ACs support o r ag ree wi th e ve ry p osition t ak en b y the c ontribution r ec ipient, bu t r ather general al ignment with our policy priorities. Our biannual Political Engagement Report discloses our U.S. political contributions. Since 2019, we’ve received the leading “trendsetter” designation from the CPA-Zicklin Index of Corporate Political Disclosure and Accountability. And in 2021 , AT&T was among only 6 companies to receive a 100% score. 2021 CPA-ZICKLIN INDEX OF CORPORATE POLITICAL DISCLOSURE AND ACCOUNTABILITY 100% Score (1 of only 6 companies) Read more: 2022 Proxy Statement • Political Engagement Report “We look forward to working with Congress, the Administration, the FCC and local, state and Tribal governments to ensure Infrastructure Investment and Jobs Act funding is effectively and efficiently deployed.” – John Stankey, AT&T CEO KPI s AT&T ESG SUMMARY REPORT 2022 AT&T ESG SUMMARY REPORT 2022 40 41
Every 2–3 years, we systematically engage a broad sampling of internal and external stakeholders to identify and prioritize the most significant ESG impacts, risks and opportunities our company should address to help ensure long-term business success. This assessment provides insight into how AT&T should focus our resources, reporting and communications. We monitor our leading ESG topics for emerging developments and adjust managerial and programmatic efforts accordingly. We completed our most recent assessment in Q4 2021, incorporating input from AT&T officers and hundreds of employees, inv estors, r egu lators, c ustomers, s uppliers, in dustry gr oups, N GOs and o ther e xternal c ol laborators. The results of our assessment are incorporated into internal enterprise risk assessment activities and reported to company officers, the CSR Governance Council, GPC and Audit Committee. The insights gleaned from stakeholder engagement efforts help guide our corporate responsibility strategy, improve our business op erations a nd p olicies, e nsure tr ansparent r eporting and pr ioritize pro grammatic i nvestments and c ollaboration a cross the bu siness. Technological Innovation Digital Divide and Affordability Regulatory Compliance Talent Attraction, Engagement and Retention Public Policy Influence and Political Contributions Business Continuity Climate Change and GHG Emissions Employee Diversity, Equity and Inclusion Supply Chain Responsibility, Sustainability and Diversity Board Oversight of ESG Water Use Market Access, Trade Barriers and Geopolitical Risk Reponsible Use and Product Safety Hazardous and Solid Waste Energy Efficiency and Renewables Responsible Marketing, Advertising and Offer Transparency Community Engagement and Philanthropy Product Lifecycle Management and E-Waste Internet Governance and Digital Freedom Employee Health and Safety and Well-Being Human Rights Labor Relations P rivacy D isaster Response and Relief N etwork and Data Security N etwork Quality and Reliability B usiness Ethics/Ethical Cultur e F air Competitio n A ccessibility Ongoing stakeholder engagement is a critical part of our ESG approach, helping us adapt to change by anticipating emerging risks and opportunities. Organizations across AT&T – such as CSR, External Affairs, Investor Relations and Finance – meet and collaborate with our stakeholders throughout the year. Our approach to ESG reporting Read more: Materiality assessment website ESG material topics and reporting Importance to management and impact to AT&T business success Importance to stakeholders GOVERNANCE ESG MATERIAL TOPICS AND REPORTING 2021 ESG material topics The matrix below summarizes the results of our 2021 ESG materiality assessment. The 4 quadrants of the matrix represent levels of relative importance to AT&T and our stakeholders. Topics ranking higher with our stakeholders generate greater outside e ngagement and more frequent external communication. Top business priorities necessitate increased collaboration across our company . A lthough the results of our ESG materiality assessment are not intended to convey financial materiality, a ll topics are considered important and impactful to our business . W e recognize the dynamic nature of these topics over time , and a s p art of our ongoing governance we continuously monitor pressing and emerging ESG issues and current events . We prioritize programmatic and managerial efforts on those issues, as appropriate. ESG materiality assessment Read more: ESG reporting website • TCFD Report • SASB Index • GRI Index • UNGC Index Read more: Materiality assessment website OVERVIEW AT&T AND SHAREHOLDERS CUSTOMERS AND COMMUNITIES EMPLOYEES SUPPLIERS ENVIRONMENT GOVERNANCE GOALS SUMMARY ESG Assessments • AT&T has been a constituent of the 3BL Media 100 Best Corporate Citizens list the past 10 years. • AT&T has been named to the Bloomberg Gender Equality I ndex for 5 consecutive years, since its 2018 expansion beyond the financial services se ctor. • AT&T has scored at the Leadership Level for the CDP Climate Change assessment for the past 6 years, earning an A- score each year. • For the past 5 years, AT&T has been the only U.S.-based telecommunications services provider on the Dow Jones Sustainability Index (DJSI) North America. • For the past 12 years, AT&T has scored a perfect 100% on the Human Rights Campaign Corporate Equality Index. • For 2022, AT&T is ranked 18th overall on the JUST Capital list of America’s 100 most just companies. We’ve been recognized on the list since its 2018 inception. AT&T’s ESG reporting practice is led by a de dicated t ea m wi thin ou r CSR organization under the leadership of our CSO, with addit ional oversight by the G P C and Audit Committee. Each yea r, we e ngage h undreds of subject matter experts and business uni t a pprovers across the company to pre pa re, review and continuously enhance our reports. Our annual ESG Summary is reviewed by the CSR Governance Council and senior executives prior to publication. ESG disclosures are further validated by our internal finance organization and select environmental c a lculat ions – such a s energy use and GHG emission s – are externally assured b y a n independent th ird party. We seek to deliver a comprehensive reporting s uite f eaturing c onsistent a nd comparable me trics. W e’ve al igned to the G lobal R eporting I nitiative ( GRI) standards since 2007, to communicate our managerial approach to impacts on broad topics such as the economy, environment, society and human rights. In recognition of investor interest in our management of ESG impacts on enterprise value, our 2022 ESG Summary represents AT&T’s first step toward alignment with the Integrated Reporting Framework (currently within the Value Reporting Foundation). We align to relevant industry-specific Sustainability Accounting Standards Board (SASB) standards, the Task Force on Climate- related Financial Disclosures (TCFD) recommendations and the CDP Climate Change assessment. We also report in alignment with the U.N. Global Compact and U.N. Sustainable Development Goals, reflecting stakeholder interest in AT&T’s contributions to global sustainable development objectives. KPI s AT&T ESG SUMMARY REPORT 2022 AT&T ESG SUMMARY REPORT 2022 42 43
Customers and Communities Suppliers Progress toward our goals Topic Target Year Target Progress Digital Divide 202 3 Invest $2 billion by EOY 202 3 to help bridge the digi ta l divide. Launched AT&T Connected Learning and expanded low-cost broadband offerings As part of our $2 billion digital divide commitment, we introduced AT&T Connected Learning, a multi-year initiative investing in digital inclusion, literacy and education to help connect today’s learners with skills, resources and opportunities for success – in and out of the classroom. By the end of 2022, we will launch more than 20 AT&T Connected Learning Centers in under-resourced neighborhoods facing barriers to connectivity. AT&T is also participating in the FCC Affordable Connectivity Program (ACP) , which provides a benefit on broadband service for eligible households. Through a new Access from AT&T service plan – households taking advantage of the ACP benefit (up to $30 per month, or $75 per month for those on qualified Tribal lands) can receive internet service at no monthly charge. Read more: Digital Divide Issue Brief Connected Learning 2025 By 2025, provide 1 million people in need with digital resources through AT&T Connected Learning. Engaged more than 72,000 individuals Through 2021, we engaged more than 72,000 individuals through digital inclusion initiatives such as partnerships to provide refurbished devices to low-income students and families, resources to support digital learning and literacy, and investments in programs that boost employment opportunities. Read more: Digital Divide Issue Brief Internship Opportunities 202 3 Host 200 Year Up interns and alums annually. Hosted Year Up Interns and created career opportunities Since 2019, we’ve hosted 162 Year Up program participants and hired 50 former Year Up interns and alums across the country. As we move further into a post-pandemic workplace, we look forward to accelerating efforts and bringing more Year Up interns to AT&T locations. Read more: Digital Divide Issue Brief GOALS SUMMARY PROGRESS TOWARDS OUR GOALS Topic Target Year Target Progress Employee Volunteerism & Giving 2030 Engage 50% of our employees worldwide in communities through grassroots volunteerism and giving initiatives. 30% of employees engaged in volunteerism and giving Through a variety of corporate community engagement opportunities, employees donate time and money or make other personal commitments to their communities. In 2021, 30% of our workforce engaged in volunteerism and giving through AT&T. 16 Read more: Community Engagement Issue Brief Disaster Preparedness & Recovery 2030 Beyond emergency response and network disaster recovery, help 1 million people prepare for and recover from the impacts of disasters. Supported more than 200,000 individuals impacted by natural disasters In 2021, through strategic partnerships, we supported the delivery of connectivity solutions, humanitarian relief and resiliency and recovery resources serving more than 200,000 individuals impacted by Winter Storm Uri, historic California wildfires and the third-busiest hurricane season on record. For example, connectivity solutions provided by the Information Technology Disaster Resource Center included network infrastructure and Wi-Fi hotspots, as well as cellphone and medical charging solutions to support survivors, public safety personnel and responding NGOs. Read more: Community Engagement Issue Brief Topic Target Year Target Progress Sustainable Sourcing Standards 2025 Lead our supply chain to improve its social and environmental impacts by integrating sustainability performance metrics into our sourcing decisions for 80% of our spend. 19 Integrated sustainability performance metrics for 80% of spend 19 AT&T Global Connections and Supply Chain continues to require suppliers to adhere to our Principles of Conduct for Suppliers through our Supplier Portal and contract agreements. In 2021, we led 4 on-site supplier factory audits as a member of the Joint Audit Cooperation. We continue to incorporate sustainability-oriented standards and analyses into sourcing decisions, including the insertion of sustainability clauses into requests for proposal (RFPs) and agreements, training our sourcing managers on the principles of sustainability and providing updates to sourcing managers on the sustainability performance of existing suppliers. Read more: Responsible Supply Chain Issue Brief Supplier Science-Based GHG Emissions Ta r g e t s 2024 Work to ensure 50% of our suppliers (covering purchased goods and services, capital goods, and downstream leased assets as a portion of spend) set their own science-based Scope 1 and 2 GHG targets. (Approved by the Science Based Targets initiative in 2020.) 47% of suppliers have set science-based GHG emissions targets Through the end of 2021, 47% of our suppliers by spend have set science- based GHG targets – 94% attainment toward our goal. Read more: Responsible Supply Chain Issue Brief Suppliers OVERVIEW AT&T AND SHAREHOLDERS CUSTOMERS AND COMMUNITIES EMPLOYEES SUPPLIERS ENVIRONMENT GOVERNANCE GOALS SUMMARY KPI s AT&T ESG SUMMARY REPORT 2022 AT&T ESG SUMMARY REPORT 2022 44 45
Environment Topic Target Year Target Progress GHG Emissions 2030 Reduce absolute Scope 1 and 2 GHG emissions 4 63% (2015 base year) – aligning with a 1.5°C pathway. (Approved by the Science Based Targets initiative in 2021.) Estimated 36.4% reduction 4 2021 estimated Scope 1 and 2 emissions were 5,619,367 metric tons of CO 2 e. This represents an estimated 36.4% reduction from our 2015 base year (8,829,258 metric tons of CO 2 e) – an estimated 57.8% attainment toward our Scope 1 and 2 science-based target. 4 Read more: Greenhous e Gas Emissions Issue Brief Climate Change Issue Brief Carbon Neutrality 2035 Achieve carbon neutrality (net zero Scope 1 and 2 emissions 4 ). Estimated reduction of 3,209,891 metric tons of CO 2 e 4 2021 estimated Scope 1 and 2 emissions were 5,619,367 metric tons of CO 2 e. This represents an estimated reduction of 3,209,891 metric tons from our 2015 base year (8,829,258 metric tons of CO 2 e) – an estimated 36.4% attainment toward our net zero target. 4 Read more: Greenhous e Gas Emissions Issue Brief Climate Change Issue Brief Customer Emissions Reduction Enablement 2035 Deliver connectivity solutions that enable business customers to reduce a gigaton (1 billion metric tons) of GHG emissions between 2018–2035. Enabled 110.3 million metric tons of customer emissions savings AT&T-enabled customer GHG emissions reductions measured between 2018 and 2021 total 110.3 million metric tons of CO 2 e – approximately 11% attainment toward our gigaton goal. 22 Read more: Greenhous e Gas Emissions Issue Brief Climate Change Issue Brief Landfill Diversion 2030 Reduce the amount of U.S. waste we send to landfill 30% (2019 base year). Estimated 26.7% reduction 30 2021 estimated waste sent to landfill was 111,916 metric tons. This represents an estimated reduction of 40,791 metric tons from our 2019 base year (152,707 metric tons). We will continue monitoring performance to determine whether COVID-19 related impacts are temporarily speeding our progress. 30 Read more: Waste Management Issue Brief Water Use in Stressed Areas 2030 Achieve 15% reduction (2019 base year) in U.S. water use in areas of high and extremely high water stress. Progress Ongoing AT&T continues to pursue our 15% water use reduction target in areas designated as high or extremely high water-stressed environments. Progress is ongoing and AT&T is currently reviewing historical water consumption data to ensure its quality. We will report progress toward our water goal upon completion of that work. 32 Read more: Water Management Issue Brief OVERVIEW AT&T AND SHAREHOLDERS CUSTOMERS AND COMMUNITIES EMPLOYEES SUPPLIERS ENVIRONMENT GOVERNANCE GOALS SUMMARY KEY PERFORMANCE INDICATORS Customers and Communities 2017 2017 2017 2018 2018 2018 2019 2019 2019 2020 2020 2020 2021 2021 2021 15 300 121.0 0 15 309 120.7 0 17 344 143.9 0 9 347 288.5 0 4 382 AT&T philanthropic giving Total corporate and AT& T Foundation giving 1 5 , 34 ($ million) Employee participation in volunteer programs 17 (%) Average employee giving per donor 33 ($) Key performance indicators EMPLOYEE DEVELOPMENT $944M Investment since 2017 in direct employee training and development programs 2 DIVERSE SUPPLIER PROCUREMENT $70.1B Spend since 2017 with businesses owned by minorities, women, LGBTQ+ people and those with disabilities 3 ENERGY COST SAVINGS $401.9M Annualized energy cost savings since 2017 from energy savings projects 23 Capital expenditures Investments in networks, platforms or systems 9 ($ billion) AT&T and Shareholders 2017 2018 2019 2020 2021 21.6 21.3 19.6 15.7 16.5 Suppliers 2017 2018 2019 2020 2021 14.4 15 .1 14.2 13.2 13.2 Supplier diversity Supply chain spend with business enterprises owned by minorities, women, veterans, LGBTQ+ people and those with disabilities 3 ($ billion) KPI s AT&T ESG SUMMARY REPORT 2022 AT&T ESG SUMMARY REPORT 2022 46 47 202.05
Employees 2017 2017 2017 2018 2018 2018 2019 2019 2019 2020 2020 2020 2021 2021 2021 46 1.86 220 40 2.07 200 40 1.90 200 37 1.16 166 37 1.18 158 Employee training investment Direct employee training and development programs 37 ($ million) Union jobs Percentage of union represented employees 35 (approximate) Employee safety OSHA total recordable occupational injury and illness rate 36 (per 100 employees) OVERVIEW AT&T AND SHAREHOLDERS CUSTOMERS AND COMMUNITIES EMPLOYEES SUPPLIERS ENVIRONMENT GOVERNANCE GOALS SUMMARY Environment 24 2017 2017 2017 2017 2017 2018 2018 2018 2018 2018 2019 2019 2019 2019 2019 2020 2020 2020 2020 2020 2021 2021 2021 2021 2021 10,716,169 14.3 11,639,219 148.0 49,956 11,081,005 14.3 12,035,873 51.1 45,383 9,387,488 14.1 10,419,308 39.8 36,012 7, 93 2 , 3 5 7 14.1 8,614,713 40.0 33,700 6,830,509 14.0 7, 512 , 8 5 8 123.0 33,270 Emissions intensity Scope 1 and 2 emissions relative to revenue 38 (metric tons of CO 2 e/$ billion revenue) U.S. Scope 1, 2 and 3 carbon footprint GHG emissions 38 (metrics tons of CO 2 e) Electricity use Global direct billed and leased electricity 40 (MWh, million) Global Scope 1, 2 and 3 carbon footprint GHG emissions 38 (metrics tons of CO 2 e) Annualized energy cost savings from energy projects ($ million) 2017 2018 2019 2020 2021 36.61 38.21 30.59 25.39 2 2 .74 Emissions intensity Scope 1 and 2 emissions relative to subscribers 39 (metric tons of CO 2 e/thousand subscribers) KEY PERFORMANCE INDICATORS Environment (continued) 2017 2017 2017 2017 2017 2017 2017 2017 2018 2018 2018 2018 2018 2018 2018 2018 2019 2019 2019 2019 2019 2019 2019 2019 2020 2020 2020 2020 2020 2020 2020 2020 2021 2021 2021 2021 2021 2021 2021 2021 7 7. 3 1 13.81 33.56 2.600 28 9 1 , 2 74 19.74 201,395 72.83 12.69 37.74 2.551 29 85,803 19.02 191,865 65.88 14.12 37.45 3.011 30 7 7, 55 7 16.63 245,645 61.89 11.75 40.05 2.678 24 82,14 4 15.59 19 9,749 56.73 11.80 39.50 2.682 21 83,020 15.87 187, 3 02 Energy intensity Relative to annual revenue 41 (MWh electricity/$ billion revenue) Water intensity Water consumption relative to annual revenue 25 (gallons/$ thousand revenue) Total waste managed 44 (metric tons) Energy intensity Relative to subscribers 42 (MWh electricity/1,000 subscribers) Water intensity Water consumption relative to subscribers 27 (gallons/individual subscriber) Waste recycled/reused 44 (percentage) Absolute water consumption 25 (gallons, billion) Consumer devices reused or recycled Mobility, set top box and broadband devices 43 (million, approximate) KPI s AT&T ESG SUMMARY REPORT 2022 49 AT&T ESG SUMMARY REPORT 2022 48
Endnotes ENDNOTES 1 Adjusted diluted EPS is a non-GAAP financial measure calcula ted by excluding from operating revenues, operating expenses and income tax expense certain significant items that are non-operational or non-recurring in nature, including dispositions and merger integration and transaction costs, actuarial gains and losses, significant abandonments and impairments, severance and other material gains and losses. 2021 reported earnings per diluted share was $2.76; adjusted earnings per diluted share was $3.40. Further information is included in our Form 8-K dated January 26, 2022. This compares to 2020 reported earnings per diluted share of ($0.75) and adjusted earnings per diluted share of $3.18. Further information is included in our Form 8-K dated January 26, 2022. 2 Inclusive of AT&T Corporate and AT&T Communications. 3 Supplier di versity spend excludes content and programming spend, and reflects the activities of the AT&T Global Connections and Supply Chain organization within AT&T Communications. 4 Scope 1 e missions include direct emissions from sources owned or controlled by the company (such as the fleet). Scope 2 emissions include indirect emissions that result from the generation of purchased energy. 5 Reflects th e activities of the AT&T Global Connections and Supply Chain organization within AT&T Communications. 6 For full- year 2021, revenues, excluding impacts of the U.S. Video business and Vrio, of $153.2 billion are calculated as operating revenues of $168.9 billion minus Video operating revenues of $15.5 billion, minus Vrio operating revenues of $2.6 billion, plus WarnerMedia sales for content and advertising of $2.5 billion that are external after close of the transactions. Note: In July 2021, we completed a transaction with TPG Capital involving our North America video business – including DIRECTV, AT&T TV and U-verse – to form a new company called DIRECTV. In November 2021, we completed the sale of our Latin America video operations, Vrio, to Grupo Werthein. Further information is included in our Form 8-K dated January 26, 2022. 7 Free cash flow is a non-GAAP financial measure that is frequently used by investors and credit rating agencies to provide relevant and useful information. In 2021, free cash flow is cash from operating activities of $42.0 billion, plus cash distributions from DIRECTV classified as investing activities of $1.3 billion, minus capital expenditures of $16.5 billion. Free cash flow total dividend payout ratio is total dividends paid divided by free cash flow. For full-year 2021, dividends paid totaled $15.1 billion. Note: In July 2021, we completed a transaction with TPG Capital involving our North America video business – including DIRECTV, AT&T TV and U-verse – to form a new company called DIRECTV. 8 9 In April 2022, we completed a transa ction to combine our WarnerMedia segment, subject to certain e xceptions, with a subsidiary of Discovery Inc. 10 Not inclusive of WarnerMedia, AT&T Mexico or AT&T International. 11 BroadbandNow Research: https://broadbandnow.com/ research/fcc-underestimates-unserved-by-50-percent 12 Excludes employees whose race is unknown or undeclared. 13 As self-identified via AT&T iCount. AT&T Inc and AT&T Communications only. 14 Not inclusive of WarnerMedia. The 2021 value of volunteer time was calculated using the Independent Sector value of a volunteer hour for 2021 ($28.54). 15 $ 18 2 . 47 million of 202 1 philanthropic giving was provided by AT&T and $1 9.5 8 million was provided through the AT&T Foundation. 16 Not inclusive of WarnerMedia. 17 2017 data does not include AT&T operations in Latin America or WarnerMedia. 2018–2021 data does not include WarnerMedia. DIRECTV and Vrio are represented through December 31, 2021. Note: In July 2021, we completed a transaction with TPG Capital involving our North America video business – including DIRECTV, AT&T TV and U-verse – to form a new company called DIRECTV. In November 2021, we completed the sale of our Latin America video operations, Vrio, to Grupo Werthein. 18 Excludes content and programming spend, and reflects the activities of the AT&T Global Connections and Supply Chain organization within AT&T Communications. 19 The supplier sustainability management approach reflects the activities of the AT&T Global Connections and Supply Chain organization within AT&T Communications. 20 Target refers to 50% of our suppliers covering purchased goods and services, capital goods and downstream leased assets as a portion of spend. 21 Environmental Protection Agency https://www.epa.gov/ ghgemissions/inventory-us-greenhouse-gas-emissions-and- sinks ; UK Government Department for Business, Energy & Industrial Strategy (BEIS): https://www.iea.org/articles/global- energy-review-co2-emissions-in-2020 2 2 Data does not include DIRECTV or Vrio. 23 All 2021 d ata is estimated and inclusive of DIRECTV and Vrio; Final values will be available in Q2 2022. Note: In July 2021, we completed a transaction with TPG Capital involving our North America video business – including DIRECTV, AT&T TV and U-verse – to form a new company called DIRECTV. In November 2021, we completed the sale of our Latin America video operations, Vrio, to Grupo Werthein. 24 2021 Ener gy Management and Greenhouse Gas Emissions data is estimated and inclusive of DIRECTV and Vrio. Final values will be available in Q2 2022. 25 All 2021 data is estimated. Final values will be available in Q2 2022 . 2017–201 8 dat a inclusiv e of AT& T Communications , U.S. operations. 2019–2021 data inclusive of AT&T Communications an d WarnerMedia’ s U.S . operations . DIRECT V an d Vri o data ar e no t included . 2017–202 1 dat a doe s no t includ e water consumptio n fro m AT& T site s tha t us e wel l water , a s wel l water consumption metrics are not tracked. Fewer than 0.03% of AT&T’s sites use well water. Note: In April 2022, we completed a transaction to combine our WarnerMedia segment, subject to certain exceptions, with a subsidiary of Discovery Inc. 26 In connection with capital improvements, we negotiate with some of our vendors to obtain favorable payment terms of 120 days or more, referred to as vendor financing, which are excluded from capital expenditures and reported in accordance with GAAP as financing activities. We present cash paid for gross capital investment to provide investors with a comprehensive view of cash used to invest in our networks, product developments and support systems. In 2021, gross capital investment of $21.6 billion is calculated as capital expenditures of $16.5 billion, plus cash paid for vendor financing of $4.6 billion and FirstNet reimbursements of $0.5 billion. 27 All 2021 data is estimated. Final values will be available in Q2 2022 . 2017–201 8 dat a inclusiv e of AT& T Communications , U.S. operations. 2019–2021 data inclusive of AT&T Communications an d WarnerMedia’ s U.S . operations . DIRECT V an d Vri o data ar e no t included . 2017–202 1 dat a doe s no t includ e water consumptio n fro m AT& T site s tha t us e wel l water , a s wel l water consumptio n metric s ar e no t tracked . Fewe r tha n 0.03 % of AT&T’ s site s us e wel l water . Intensit y i s relativ e t o th e number of our subscribers (North America wireless, wireline voice and domestic broadband), as identified in our 2021 4th Quarter Earnings Statement. Note: In July 2 021, we completed a transaction with TPG Capital involving our North America video business – including DIRECTV, AT&T TV and U-verse – to form a new company called DIRECTV. In November 2021, we completed the sale of our Latin America v ideo operations, Vrio, to Grupo We rthein. In April 2022, we comp leted a transaction to combine our WarnerMedia segment, subject to ce rtain exceptions, with a s ubsidiary of Discovery Inc. 28 Device recycling and reuse data cover AT&T Inc. U.S. operations only. 29 Data cove rs the central offices of AT&T’s wireline, longlines & DIRECTV business, as well as outside plant and some mobility locations in the contiguous U.S. Note: In August 2021, we contributed our North America video business – including DIRECTV, AT&T TV and U-verse – to form a new company with TPG Capital. 30 2019–202 1 data for waste generation and management represent all waste accounted for through AT&T Inc.’s domestic U.S. general solid waste, investment recovery, e-waste, furniture recycling, paper shredding, pallet recycling and regulated (hazardous and nonhazardous) waste programs, unless otherwise noted. 31 US Teleco m: https://ustelecom.org/2020-broadband-providers- pump-another-79-4-billion-into-americas-connectivity- infrastructure/ 32 2019–202 1 dat a inclusiv e of AT& T Communication s and WarnerMedia’s U.S. operations. DIRECTV and Vrio data are not included. Note: I n April 2022, we completed a transact ion to combine our WarnerMedia segment, subjec t to certain exceptions, with a subsidiary of Disc overy Inc. 33 2017–2018 data includes AT&T Communications and Xandr. 2019–2021 data is representative of AT&T Corporate, including WarnerMedia, as well as Vrio and DIRECTV through the divestiture of those units in July 2021 and November 2021, respectively. Note: In July 2021, we completed a transaction with TPG Capital involving our North America video business – including DIRECTV, AT&T TV and U-verse – to form a new company called DIRECTV. In November 2021, we completed the sale of our Latin America video operations, Vrio, to Grupo Werthein. In April 2022, we completed a transaction to combine our WarnerMedia segment, subject to certain exceptions, with a subsidiary of Discovery Inc. 34 2017 total does not include WarnerMedia. 35 Inclusive of AT&T Communications. 36 These incidents are employee injuries and illnesses that are required to be documented on the OSHA 300 log. 37 2017–2020 data inclusive of AT&T Communications. 2021 data inclusive of AT&T Corporate and AT&T Communications. AT&T ESG SUMMARY REPORT 2022 AT&T ESG SUMMARY REPORT 2022 50 51 Inc luding capital investmen ts and acquisition of wirele ss spe ctrum and operations.
Endnotes (continued) ESG R ecognition 3BL M edia 100 Best Corporate Citizens; 2011-2021 Bloomberg Gender E qu ality I ndex, 2018-2022 C DP Climate Change Leadership Level (A-); 2016-2021 CPA-Zicklin Index o f Corporate Political Disclosure and Accountability T rendsetter ; 2019-2020 100% score; 2021 Disabi lity:IN 100% Disability Equality Index; 2021 DiversityInc Top 50 Companies for Diversity; 2001, 2007-2019, 2021 Top Companies for ESG; 2020-2021 Hall of Fame; 2020-2021 Dow J ones Su stai nabi lity Index N orth A merica 2010-2013, 2017-2021 Ethisphere World’s Most Ethical Companies; 2020-2022 Fortune World’s Most Admired Companies; 2009-2010, 2012, 2014-2015, 2017-2021 Hispanic Association on Corporate Responsibility Corporate Inclusion Index; 2009-2021 Human Rights Campaign Corporate Equality Index; 2004-2022 JUST Capital America’s Most JUST Companies (JUST 100); 2018-2022 Top 100 Companies Supporting Healthy Families and Communities; 2019, 2021 National Organization on Disability Leading Disability Employer; 2017-2021 Newsweek America’s Most Responsible Companies; 2020-2022 Points of Light The Civic 50; 2012-2021 39 2021 data is estimated and inclusive of DIRECTV and Vrio - final values will be available in Q2 2022; Carbon footprint does not include supplier emissions. Intensity is relative to the number of our subscribers (North America wireless, wireline voice and domestic broadband), as identified in our 2021 4th Quarter Earnings Statement. Note: Variances between 2017-2018 may be attributed to the addition of WarnerMedia to our operations and footprint. In July 2021, we completed a transaction with TPG Capital involving our North America video business – including DIRECTV, AT&T TV and U-verse – to form a new company called DIRECTV. In November 2021, we completed the sale of our Latin America video operations, Vrio, to Grupo Werthein. 40 2021 data is estimated and inclusive of DIRECTV and Vrio - final values will be available in Q2 2022; Electricity is a subset of total energy. Electrical energy represents approximately 82% of total AT&T energy consumption globally. Other forms of energy include steam, chilled water and all types of fuel use. Note: In July 2021, we completed a transaction with TPG Capital involving our North America video business – including DIRECTV, AT&T TV and U-verse – to form a new company called DIRECTV. In November 2021, we completed the sale of our Latin America video operations, Vrio, to Grupo Werthein. 41 2021 data is estimated and inclusive of DIRECTV and Vrio - final values will be available in Q2 2022; Electricity use is the numerator and is a proxy for total energy use. Note: In July 2021, we completed a transaction with TPG Capital involving our North America video business – including DIRECTV, AT&T TV and U-verse – to form a new company called DIRECTV. In November 2021, we completed the sale of our Latin America video operations, Vrio, to Grupo Werthein. 42 2021 data is estimated and inclusive of DIRECTV and Vrio - final values will be available in Q2 2022; Electricity use is the numerator and is a proxy for total energy use. Intensity is relative to the number of our subscribers (North America wireless, wireline voice and domestic broadband), as identified in our 2021 4th Quarter Earnings Statement. Note: In July 2021, we completed a transaction with TPG Capital involving our North America video business – including DIRECTV, AT&T TV and U-verse – to form a new company called DIRECTV. In November 2021, we completed the sale of our Latin America video operations, Vrio, to Grupo Werthein. 43 Consu mer device recycling and reuse and product take-back data cover AT&T Inc. U.S. operations only. DIRECTV data is included for2021 only, through July 2021. Note: In July 2021, we completed a transaction with TPG Capital involving our North America video business – including DIRECTV, AT&T TV and U-verse – to form a new company called DIRECTV. 44 2017– 2018 data for waste generation and management represent all waste accounted for through AT&T Inc.’s domestic U.S. general solid waste, investment recovery and hazardous waste programs. The 2019–2021 data for waste generation and management represent all waste accounted for through AT&T Inc.’s domestic U.S. general solid waste, investment recovery, e-waste, furniture recycling, paper shredding, pallet recycling and regulated (hazardous and nonhazardous) waste programs, unless otherwise noted. AT&T ESG SUMMARY REPORT 2022 52 38 2021 data is estimated and inclusive of DIRECTV and Vrio - final values will be available in Q2 2022; Carbon footprint does not include supplier emissions. Note: Variances between 2017-2018 may be attributed to the addition of WarnerMedia to our operations and footprint. In July 2021, we completed a transaction with TPG Capital involving our North America video business – including DIRECTV, AT&T TV and U-verse – to form a new company called DIRECTV. In November 2021, we completed the sale of our Latin America video operations, Vrio, to Grupo Werthein.
The AT&T ESG reporting website provides comprehensive ESG disclosure additional to this ESG Summary: 2022 Proxy Statement ESG reporting indexes ( GRI , SASB , UNGC , UN SDGs ) ESG issue briefs ESG material topics assessment TCFD report CDP Climate Change disclosure Diversity, Equity & Inclusion (DE&I) report Political engagement report Transparency report @ATTimpact ATTimpact att.com/csr