Intel Corporate Responsibility Report
Corporate Responsibility Report 2021-22
Our Business Responsible Inclusive Sustainable Enabling Appendix 2 intel.com/responsibility 2021-22 Corporate Responsibility Report Introduction Table of Contents Introduction 2 Table of Contents 2 Letter From Our CEO 3 Letter From Our CPO 4 A Year in Review 5 IRTI: Going Beyond COVID-19 6 Corporate Responsibility 7 and Our 2030 RISE Strategy Awards and Recognitions 11 Our Business 12 Company Profile 13 Our People and Culture 20 Governance, Ethics, and Public Policy 24 Stakeholder Engagement 28 Respecting Human Rights 29 Supply Chain Responsibility 32 Responsible 35 Responsible: Our Approach 36 Employee Health, Safety, and Wellness 37 Protecting Human Rights in the Supply Chain 40 Responsible Minerals Sourcing 42 Responsible Mobility 44 Revolutionizing Health 45 and Safety Through Technology Inclusive 47 Inclusive: Our Approach 48 Inclusive Workforce 49 Social Equity 56 Building a Diverse Technology Industry 58 Supplier Diversity and Inclusion 59 Making Technology Fully Inclusive 61 and Expanding Digital Readiness Sustainable 64 Sustainable: Our Approach 65 Environmental Management 66 Climate and Energy 68 Product Energy Efficiency 71 Water Stewardship 72 Waste and Circular Economy Solutions 74 Sustainable Manufacturing 76 and Chemistry Initiatives Achieving Carbon Neutral Computing 77 Enabling 79 Enabling: Our Approach 80 Employees Changing the World 81 Intel Foundation: Rising to the Future 84 Collaborating for Technology Impact 85 Appendix 87 About this Report 88 Independent Limited Assurance Statement 89 Performance Data Summary 90 SASB and TCFD Framework Alignment 91 UN Sustainable Development Goals 94 Non-GAAP Financial Measures 95 Intel 2021 Water Inventory by Location and Source 96 2021 Environmental, Health, and Safety Violations 98 Top 100 Production and Service Suppliers 99 Acronym Index 100 Our Commitment to Transparency This report provides a comprehensive summary of our approach to corporate responsibility and our performance for calendar and fiscal 2021, unless otherwise stated. This report has been prepared in accordance with the Global Reporting Initiative (GRI) Standards: Comprehensive option. Our GRI Content Index is provided on our Report Builder website. We also use other recognized frameworks to inform the content of this report, including the United Nations (UN) Global Compact, UN Sustainable Development Goals, the Task Force on Climate-Related Financial Disclosures (TCFD), and the Value Reporting Foundation . 1 In 2021, we continued to advance our integrated reporting strategy to include environ - mental, social, and governance information in our 2021 Annual Report on Form 10-K and 2022 Proxy Statement , available on our Investor Relations website. For additional information on Intel’s approach to corporate responsibility, supporting documents and data, past reports, and to customize a report with the sections of your choice, visit our Corporate Responsibility and Report Builder websites. 1 SASB and IIRC announced the finalization of their merger in June 2021, creating a unified organization, the Value Reporting Foundation.
Our Business Responsible Inclusive Sustainable Enabling Appendix 3 intel.com/responsibility 2021-22 Corporate Responsibility Report Introduction Letter From Our CEO At Intel, our purpose is to build world-changing technology that improves the life of every person on the planet. We strive every day to make a positive global impact and be good corporate citizens. Increasingly central to every aspect of human existence, technology is transforming our world at an accelerated pace. And at the heart of that technology: semiconductors. Semi - conductors are the foundation of all innovation as the world becomes more digital, from powering our ability to work remotely, to staying connected with friends and family, to providing enhanced healthcare and autonomous vehicles. Today’s challenges are many and immense. We are still struggling with a global pandemic, social injustice, wars, the detrimental effects of climate change, and so much more. Against this global landscape, it is imperative that we work together as an industry to harness the power of technology and ensure it is being used as a force for good. I am extremely proud of Intel’s long-standing leadership in corporate respon - sibility and sustainability, including initiatives in diversity and inclusion, education, and philanthropy. Our focus helps us con - tribute responsible, inclusive, and sustainable practices across our operations, products, and supply chain. The passion and expertise of our employees, energized by our purpose, are accelerating our collective contributions to the world. This Corporate Responsibility Report outlines our progress on the 2030 goals we laid out two years ago. I am proud of our accomplishments, including: • Continuing to invest in conservation projects and set new targets. Building on our long history of leadership in this space, we are driving reductions in greenhouse gas emissions, energy use, water use, and waste generation. For example, we achieved net positive water in three countries, sustained 80% renewable electricity globally, and sent about 5% of our total waste to landfill. This work has contributed to us being recognized as No. 1 on Barron’s 100 Most Sustainable Companies list. We are also continuing our work on sustainable chemistry, including ongoing efforts to refine the chemical footprint methodology for use in evaluation of the chemical supply chain. • Accelerating efforts on the Alliance for Global Inclusion. Last year, we launched a coalition of technology and adja - cent industry partners to improve diversity and inclusion practices and promote transparent reporting in four critical areas: leadership representation, inclusive language, inclusive product development, and STEM readiness in underserved communities. We more than doubled mem - bership and made meaningful progress on creating an inclusion index to help companies track diversity and inclusion improvements against a shared benchmark. • Evolving our Pandemic Response Technology Initiative (PRTI). This has now become our Intel RISE Technology Initiative (IRTI), which funds projects related to healthcare, education, and the economy, with dedicated work streams for social equity and human rights, accessibility, and climate action. The IRTI is a purpose-driven platform for action backed by a $20 million commitment. • Announcing the AI Incubator Network. This is an initiative in partnership with Dell Technologies and the American Association of Community Colleges. As part of Intel’s AI for Workforce program, the AI Incubator Network will design and build AI labs across the US by leveraging the expertise and industry connections of America’s community college system. Since launching the AI for Workforce program in 2020, Intel has expanded it to 31 schools across 18 states with a goal of reaching all 50 states by 2023. As we look ahead, we will build on this momentum to drive progress and take us to even greater heights in 2022 and in the years ahead, including: • Committing to net-zero greenhouse gas emissions across our operations by 2040. We will do this even as we signifi - cantly expand our global operations. We are committed to increasing the energy efficiency and lowering the carbon footprint of Intel products and platforms, and to working with customers and industry partners to create solutions that lower the greenhouse gas footprint of the entire technology ecosystem. Furthermore, through sustainable manufacturing practices and aggressive environmental targets, we are deeply committed to being good neighbors in the communities where we operate. • Making a $100 million investment to establish education and research collaborations. Working with the US National Science Foundation, we will continue to boost research and workforce development in semiconductor manufacturing through a $100 million investment over the next decade to establish education and research collaborations with universities, community colleges, and technical educators in Ohio and across the nation. • Maximizing existing talent while building a diverse talent pipeline across our industry. Despite talent leaving the workforce in the wake of COVID-19 and drops in higher education enrollment, our 2030 goals remain unchanged. We will work to maximize existing talent while building a diverse talent pipeline across our industry. In addition, we have set a 2022 target that our technical hiring in entry- level roles is at least 30% women. • Driving positive impact in supply chain responsibility. Through our efforts to help protect human rights, our suppliers have returned $25 million in fees to their workers since 2014. In 2021, our progress also included expansion of our work in responsible minerals sourcing, and the achievement of $1.4 billion in annual spending with diverse- owned suppliers. We have made incredible strides over the past year, but there is still much to do. We are just getting started. Pat Gelsinger, Chief Executive Officer, Intel Corporation
Our Business Responsible Inclusive Sustainable Enabling Appendix 4 intel.com/responsibility 2021-22 Corporate Responsibility Report Introduction Letter From Our CPO One of the things that inspired me to join Intel is the company’s long-standing commitment to positive global impact. We have a goal to create world-changing technology that improves the life of every person on the planet, but beyond that, we strive to do what’s right for people and the planet every day. At the center of these commitments are Intel’s more than 121,000 employees around the world. Our commitment and action related to responsible corporate practices are more than just important to the global workforce, they are table stakes. As Chief People Officer, my top job is to attract and retain the world’s best talent across every function—from the front lines in our factories to the engineers at the forefront of innovation. Intel’s leadership in corporate responsibility is what helps us continue to be an employer of choice. We invest in programs that create opportunities for people around the world as part of our 2030 RISE corporate responsibility goals. Not only does Intel continue to accelerate the integration of responsible, inclusive, and sustainable practices in our operations, supply chain, the industry, and beyond, we also enable our customers to meet their environ - mental and corporate responsibility commitments through our technology and the expertise of our employees. Our long history of leadership in corporate responsibility is a competitive advantage for our business. And our integrated approach helps us mitigate risks, build brand value, and identify new market opportunities to apply our technology to help address society’s most complex issues. Paramount to Intel’s success is our 2030 RISE strategy, which outlines our approach to corporate responsibility this decade, as well as the mea - surable goals we’ve set for ourselves to achieve in the next eight years. An important aspect to this strategy, outlined in the details of this report, is that our efforts are broader than just our own operations. This is not added work, it’s how we work. In 2021 we launched several industry-wide inclusion actions to enable our goals, including: • The Alliance for Global Inclusion was launched to drive collective impact in four key areas: leadership representation, inclusive language, inclusive product development, and improving STEM readiness in underserved communities. The alliance recently celebrated its first anniversary, and its membership has doubled since launch. • In its first year since launch, the Million Girls Moonshot reached 160,000 girls across the US via 21,000 after-school and summer STEM programs, and 612 new STEM partnerships. Our 2030 RISE goals also focus on fully harnessing the power of technology to solve increasingly complex and interconnected global challenges. For example, we are partnering with the technology industry and other stakeholders to revolutionize computing and expand digital readiness: • During 2021, Intel drove a wide range of programs, including AI for Citizens, AI for Youth, AI for Future Workforce, AI for Current Workforce, and Digital Readiness for Leaders for empowering citizens, students, professionals, and leaders to actively participate in and benefit from a digital economy. We scaled the programs by working with more than 20 countries and over 50 ministries and partners, impacting over 13,000 institutions and 1 million people globally. And inside of Intel, we believe that when every employee has a voice and a sense of belonging, Intel can be more innovative, agile, and competitive. An inclusive culture that welcomes all perspectives is critical for attracting, retaining, and progressing top talent who have a direct impact on innovation and on our products. Intel is committed to providing a work environment where employees from all backgrounds are valued, supported, respected, challenged, acknowledged, and rewarded so they can achieve their full potential. Recent examples include: • Through our 2030 goals, we are committed to further advancing the representation of women and underrep - resented minorities in leadership and technical positions at Intel, advancing accessibility, and embedding inclusive leadership practices in our culture and across our business. • Our global representation of technical women declined from 25.2% in 2020 to 24.3% in 2021, but more technical women—some 26,000—work at Intel than at any time in our recent history. To meet our goal of increasing representation of women in technical roles to 40%, we will implement targeted programs to increase the number of women hired for technician, engineering hardware, and software roles through sourcing, pipelining, and workforce development initiatives. To drive additional corporate-level focus, we have made this an Annual Performance Bonus goal for all employees in 2022. In addition, we set a goal that our hiring for technical entry-level roles is at least 30% women. • In 2022, we launched the Intel Hardship and Emergency Relief program, providing short term relief up to $2,500 (geo adjusted) to employees facing hardship due to global disasters and crises. We see the growing acknowledgment of the importance of corporate responsibility and sustainability, and our historic and ongoing leadership as an opportunity to fulfill our purpose to create world-changing technology that improves the life of every person on the planet. We couldn’t be prouder of what we’ve achieved over our long history of action in corporate responsibility and for what’s to come. Christy Pambianchi, Executive Vice President and Chief People Officer, Intel Corporation
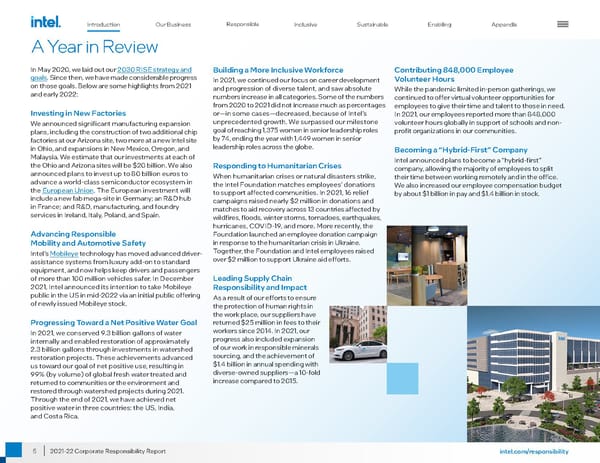
Our Business Responsible Inclusive Sustainable Enabling Appendix 5 intel.com/responsibility 2021-22 Corporate Responsibility Report Introduction A Year in Review In May 2020, we laid out our 2030 RISE strategy and goals . Since then, we have made considerable progress on those goals. Below are some highlights from 2021 and early 2022: Investing in New Factories We announced significant manufacturing expansion plans, including the construction of two additional chip factories at our Arizona site, two more at a new Intel site in Ohio, and expansions in New Mexico, Oregon, and Malaysia. We estimate that our investments at each of the Ohio and Arizona sites will be $20 billion. We also announced plans to invest up to 80 billion euros to advance a world-class semiconductor ecosystem in the European Union . The European investment will include a new fab mega-site in Germany; an R&D hub in France; and R&D, manufacturing, and foundry services in Ireland, Italy, Poland, and Spain. Advancing Responsible Mobility and Automotive Safety Intel’s Mobileye technology has moved advanced driver- assistance systems from luxury add-on to standard equipment, and now helps keep drivers and passengers of more than 100 million vehicles safer. In December 2021, Intel announced its intention to take Mobileye public in the US in mid-2022 via an initial public offering of newly issued Mobileye stock. Progressing Toward a Net Positive Water Goal In 2021, we conserved 9.3 billion gallons of water internally and enabled restoration of approximately 2.3 billion gallons through investments in watershed restoration projects. These achievements advanced us toward our goal of net positive use, resulting in 99% (by volume) of global fresh water treated and returned to communities or the environment and restored through watershed projects during 2021. Through the end of 2021, we have achieved net positive water in three countries: the US, India, and Costa Rica. Building a More Inclusive Workforce In 2021, we continued our focus on career development and progression of diverse talent, and saw absolute numbers increase in all categories. Some of the numbers from 2020 to 2021 did not increase much as percentages or—in some cases—decreased, because of Intel’s unprecedented growth. We surpassed our milestone goal of reaching 1,375 women in senior leadership roles by 74, ending the year with 1,449 women in senior leadership roles across the globe. Responding to Humanitarian Crises When humanitarian crises or natural disasters strike, the Intel Foundation matches employees’ donations to support affected communities. In 2021, 16 relief campaigns raised nearly $2 million in donations and matches to aid recovery across 13 countries affected by wildfires, floods, winter storms, tornadoes, earthquakes, hurricanes, COVID-19, and more. More recently, the Foundation launched an employee donation campaign in response to the humanitarian crisis in Ukraine. Together, the Foundation and Intel employees raised over $2 million to support Ukraine aid efforts. Leading Supply Chain Responsibility and Impact As a result of our efforts to ensure the protection of human rights in the work place, our suppliers have returned $25 million in fees to their workers since 2014. In 2021, our progress also included expansion of our work in responsible minerals sourcing, and the achievement of $1.4 billion in annual spending with diverse-owned suppliers—a 10-fold increase compared to 2015. Contributing 848,000 Employee Volunteer Hours While the pandemic limited in-person gatherings, we continued to offer virtual volunteer opportunities for employees to give their time and talent to those in need. In 2021, our employees reported more than 848,000 volunteer hours globally in support of schools and non - profit organizations in our communities. Becoming a “Hybrid-First” Company Intel announced plans to become a “hybrid-first” company, allowing the majority of employees to split their time between working remotely and in the office. We also increased our employee compensation budget by about $1 billion in pay and $1.4 billion in stock.
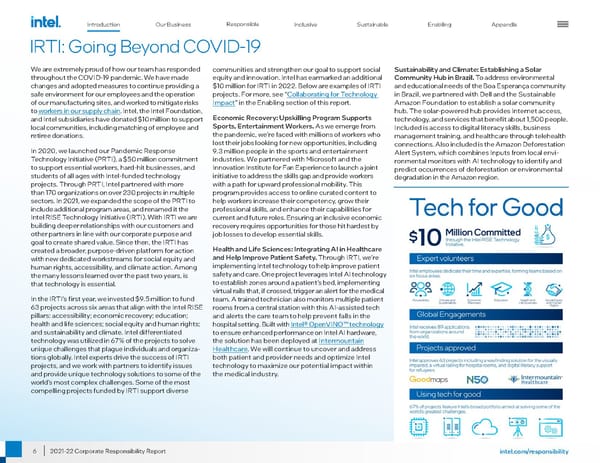
Our Business Responsible Inclusive Sustainable Enabling Appendix 6 intel.com/responsibility 2021-22 Corporate Responsibility Report Introduction IRTI: Going Beyond COVID-19 We are extremely proud of how our team has responded throughout the COVID-19 pandemic. We have made changes and adopted measures to continue providing a safe environment for our employees and the operation of our manufacturing sites, and worked to mitigate risks to workers in our supply chain . Intel, the Intel Foundation, and Intel subsidiaries have donated $10 million to support local communities, including matching of employee and retiree donations. In 2020, we launched our Pandemic Response Technology Initiative (PRTI), a $50 million commitment to support essential workers, hard-hit businesses, and students of all ages with Intel-funded technology projects. Through PRTI, Intel partnered with more than 170 organizations on over 230 projects in multiple sectors. In 2021, we expanded the scope of the PRTI to include additional program areas, and renamed it the Intel RISE Technology Initiative (IRTI). With IRTI we are building deeper relationships with our customers and other partners in line with our corporate purpose and goal to create shared value. Since then, the IRTI has created a broader, purpose-driven platform for action with new dedicated workstreams for social equity and human rights, accessibility, and climate action. Among the many lessons learned over the past two years, is that technology is essential. In the IRTI’s first year, we invested $9.5 million to fund 63 projects across six areas that align with the Intel RISE pillars: accessibility; economic recovery; education; health and life sciences; social equity and human rights; and sustainability and climate. Intel differentiated technology was utilized in 67% of the projects to solve unique challenges that plague individuals and organiza - tions globally. Intel experts drive the success of IRTI projects, and we work with partners to identify issues and provide unique technology solutions to some of the world’s most complex challenges. Some of the most compelling projects funded by IRTI support diverse communities and strengthen our goal to support social equity and innovation. Intel has earmarked an additional $10 million for IRTI in 2022. Below are examples of IRTI projects. For more, see “ Collaborating for Technology Impact ” in the Enabling section of this report. Economic Recovery: Upskilling Program Supports Sports, Entertainment Workers. As we emerge from the pandemic, we’re faced with millions of workers who lost their jobs looking for new opportunities, including 9.3 million people in the sports and entertainment industries. We partnered with Microsoft and the Innovation Institute for Fan Experience to launch a joint initiative to address the skills gap and provide workers with a path for upward professional mobility. This program provides access to online curated content to help workers increase their competency, grow their professional skills, and enhance their capabilities for current and future roles. Ensuring an inclusive economic recovery requires opportunities for those hit hardest by job losses to develop essential skills. Health and Life Sciences: Integrating AI in Healthcare and Help Improve Patient Safety. Through IRTI, we’re implementing Intel technology to help improve patient safety and care. One project leverages Intel AI technology to establish zones around a patient’s bed, implementing virtual rails that, if crossed, trigger an alert for the medical team. A trained technician also monitors multiple patient rooms from a central station with this AI-assisted tech and alerts the care team to help prevent falls in the hospital setting. Built with Intel® OpenVINO™ technology to ensure enhanced performance on Intel AI hardware, the solution has been deployed at Intermountain Healthcare . We will continue to uncover and address both patient and provider needs and optimize Intel technology to maximize our potential impact within the medical industry. Sustainability and Climate: Establishing a Solar Community Hub in Brazil. To address environmental and educational needs of the Boa Esperança community in Brazil, we partnered with Dell and the Sustainable Amazon Foundation to establish a solar community hub. The solar-powered hub provides Internet access, technology, and services that benefit about 1,500 people. Included is access to digital literacy skills, business management training, and healthcare through telehealth connections. Also included is the Amazon Deforestation Alert System, which combines Inputs from local envi - ronmental monitors with AI technology to identify and predict occurrences of deforestation or environmental degradation in the Amazon region.
Our Business Responsible Inclusive Sustainable Enabling Appendix 7 intel.com/responsibility 2021-22 Corporate Responsibility Report Introduction Corporate Responsibility and Our 2030 RISE Strategy Intel’s purpose is to create world-changing technology that improves the life of every person on earth. Our continuing commitment to corporate responsibility is embedded in our purpose. That commitment—built on a strong foundation of transparency, governance, ethics, and respect for human rights—creates value for Intel and our stakeholders by helping us mitigate risks, reduce costs, build brand value, and identify new market opportunities to apply our technology to help address society’s most complex issues. Through our long-term focus on advancing transparency, setting ambitious goals, and integrating corporate responsibility across all aspects of our business, we have driven meaningful results and challenged ourselves to achieve higher levels of performance over time. The Intel Foundation amplifies the impact of our employees’ volunteer hours and contributions to our local communities and catalyzes action and collaboration with others on social impact initiatives. With our 2030 corporate responsibility “RISE” strategy and goals, we aim to create a more responsible , inclusive , and sustainable world, enabled through our technology and the expertise and passion of our employees. Our strategy not only raises the bar for ourselves and our supply chain, but also increases the scale and global impact of our work through new collaborations with our customers and a broad range of stakeholders. Our aim is to fully harness the power of technology to solve the increasingly complex and interconnected global challenges over the next decade and beyond. We know that acting alone, Intel cannot achieve the broad, societal impact we aspire to. Since we announced our new strategy, we have been inspired by the many ways our employees have driven progress on our goals in the face of a challenging external environment, and by the positive feedback and increased interest from stakeholders to work together to accelerate global impact. Responsible Inclusive Sustainable Enabling Global Challenges Technology Industry Initiatives Intel Operational and Supply Chain Goals Responsible Lead in advancing safety, wellness, and responsible business practices across our global manufacturing operations, our value chain, and beyond Inclusive Advance diversity and inclusion across our global workforce and industry, and expand opportunities for others through technology, inclusion, and digital readiness initiatives Sustainable Be a global leader in sustainability and enable our customers and others to reduce their environmental impact through our actions and technology Enabling Through innovative technology and the expertise and passion of our employees we enable positive change within Intel, across our industry, and beyond In developing our 2030 RISE strategy and goals, we leveraged external frameworks such as the United Nations Sustainable Development Goals symbolized above. For more, see “ United Nations Sustainable Development Goals ” in the Appendix.
Our Business Responsible Inclusive Sustainable Enabling Appendix 8 intel.com/responsibility 2021-22 Corporate Responsibility Report Introduction 2030 RISE Operational and Supply Chain Goals This table outlines our 2030 operational and supply chain goals, including progress made in 2021. These goals are designed to continue to raise the bar for ourselves and to deliver greater value for our customers by helping them reach their corporate responsibility goals and targets. Click on each heading to learn more. 2030 Goal Progress in 2021 Responsible Employee Health, Safety, and Wellness. Ensure that more than 90% of our employees believe that Intel has a strong safety culture and that 50% participate in our global wellness program. During 2021, 87% of surveyed employees agreed with our “safety is a value” metrics. 27% of global Intel employees participated in wellness programs in 2021. Supply Chain Human Rights. Scale our supplier responsibility programs to ensure respect for human rights across 100% of our tier 1 contracted suppliers and higher risk tier 2 suppliers. 1 We reached 24% completion of our Tier 1 contracted suppliers, and remain on track to 100% completion by 2030. Inclusive Workforce Inclusion. • Double the number of women and underrepresented minorities in senior leadership roles. • Exceed 40% representation of women in technical positions. • Advance accessibility and increase the percentage of employees who self-identify as having a disability to 10% of our workforce. • Ensure that inclusive leadership practices and accountability are embedded in our culture globally by creating and adopting an inclusive leader certification program. We surpassed our milestone goal of reaching 1,375 women in leadership roles, ending 2021 with 1,449 women in senior leadership roles. Our US underrepresented minority senior leaders also increased, from 384 to 444. We set a milestone goal to increase representation of Black/African American employees in senior, director, and executive roles by 10% in the US. We exceeded this milestone, increasing representation by 11%. As of December 2021, 3.8% of Intel’s US workforce self-identified as having a disability. Supplier Diversity. Increase global annual spending with diverse suppliers 2 by 100% to reach $2 billion in annual spending by 2030. In 2021, our annual spending with diverse suppliers reached $1.4 billion, a 10-fold increase compared to 2015, when we launched our diverse supplier program. We have made strong progress toward our 2030 goal and our three milestones focused on women-, minority-, and US Black-owned suppliers. Sustainable Climate and Energy. • Achieve 100% renewable electricity use across our global manufacturing operations. • Conserve 4 billion kWh of electricity. • Drive a 10% reduction in our absolute Scope 1 and 2 GHG emissions as we grow, informed by climate science. • Increase product energy efficiency 10x for Intel client and server microprocessors to reduce our Scope 3 emissions. In 2021, we invested in projects that enabled us to conserve approximately 162 million kWh of electricity. We have conserved a cumulative total of 486 million kWh of electricity since the baseline date. While our absolute Scope 1 and 2 greenhouse gas (GHG) emissions increased 14% from our 2019 baseline, our total GHG emissions (including Scopes 1, 2, and 3) decreased 2% from last year. Net Positive Water. Achieve net positive water use by conserving 60 billion gallons of water and funding external water restoration projects. During 2021, we conserved 9.3 billion gallons of water and conserved 16.4 billion gallons cumulatively from the 2020 baseline. Intel projects also restored 2.3 billion gallons of water during 2021 and 3.6 billion gallons cumulatively from the 2020 baseline, to our watersheds. Zero Waste 3 /Circular Economy. Achieve zero total waste to landfill and implement circular economy strategies for 60% of our manufacturing waste streams in partnership with our suppliers. We sent 5% total waste to landfill and implemented circular strategies for 65% of our manufacturing waste. Enabling Community Impact. Deliver 10 million volunteer hours to improve our local communities, including an increase in skills-based volunteerism. During 2021, our employees donated 848,000 hours of service in our local communities. 1 Tier 1 suppliers are companies from which Intel makes direct purchases (more than 9,000 suppliers in 2021). Tier 1 contracted suppliers are subject to formal agreements with Intel based on the products and services provided and spends (approximately 1,500 at the beginning of 2021). Tier 2 suppliers are companies from which Intel’s tier 1 suppliers make direct purchases. 2 We recognize diverse suppliers as businesses that are 51% owned and operated by at least one of the following: women; minorities as defined by the country or region where the business was established; veterans/ service-disabled veterans; persons who are lesbian, gay, bisexual, or transgender; or persons who are disabled. While Intel recognizes these categories, they may vary in accordance with local law. 3 Intel defines zero waste as less than 1% sent to landfill.
Our Business Responsible Inclusive Sustainable Enabling Appendix 9 intel.com/responsibility 2021-22 Corporate Responsibility Report Introduction Technology Industry Initiatives Building on the foundation of our operational and supply chain goals, we will work with the technology ecosystem to accelerate improvements across our industry. We know that we can go faster and be more effective working together. Click on the headers below for more details on our initiatives and progress. Responsible Inclusive Sustainable Responsible minerals. Expand our efforts beyond conflict minerals 1 to cover all minerals used in semiconductor manufacturing and apply the learnings to lead our industry in creating new sourcing standards. In 2021, we sent our first expanded minerals survey for aluminum, copper, nickel, and silver to suppliers contributing these materials in our Intel-manufactured microprocessors. This is an important step in our RISE strategy, as we begin mapping our supply chains for our highest priority minerals. Although sourcing of these minerals is not yet widely reported, we received a response from 89% of relevant suppliers. Additionally, we continue to partner with industry associations to ensure standards are in place to enable our ultimate goal of responsible sourcing for all the minerals in our supply chain. We will continue to identify the highest priority minerals in pursuit of our 2030 RISE Goals. Responsible mobility. Collaborate with our industry and ecosystem partners to advance the adoption of technology-neutral safety standards to reduce traffic accidents globally. Intel’s Mobileye business is a global leader in driving assistance and self-driving solutions. The company’s product portfolio employs a broad set of technologies covering computer vision and machine learning-based sensing, data analysis, for advanced driver assistance systems and autonomous vehicles (AVs). Mobileye technology helps keep the drivers and passengers of more than 100 million vehicles safer today. Intel’s Responsibility- Sensitive Safety (RSS) has become a leading model for global AV safety frameworks. Numerous standards bodies are beginning to include RSS in standards development activities. Inclusion Index. Drive full inclusion and accessibility across the technology industry by creating and implementing a Global Inclusion Index with common metrics to advance progress. In 2021, we launched the Alliance for Global Inclusion, a coalition focused on creating an inclusion index and working to collectively advance progress in four critical areas: leadership representation, inclusive language, inclusive product development, and STEM readiness in under- resourced communities. Since its launch, the Alliance has more than doubled in size, from five to 12 members, and has made meaningful progress on creating an Inclusion Index to serve as a benchmark for companies to track diversity and inclusion improvements, provide information on current best practices, and highlight opportunities to improve outcomes across industries. In December 2021, the Alliance published suggested guidance to secure diverse representation on boards of directors. Inclusive pipeline. Expand the inclusive pipeline of talent for our industry through innovative global education initiatives and STEM programs for girls and underrepresented groups. Building a diverse and inclusive workforce and industry requires continued collective investments and innovative approaches to increasing the diversity of the talent pipeline and expanding access to the education resources needed to pursue careers in our field. In 2021, we scaled a number of programs and collaborations with customers, governments, and other stakeholders to bridge the gender gap in STEM fields, including our work with Women in AI, a nonprofit working to empower women and minorities as AI and data experts, innovators, and leaders. In early 2021, we also pledged $5 million to North Carolina Central University, a historically Black college or university, to create a tech law and policy center. Sustainable manufacturing . Create a collective approach to reducing emissions for the semiconductor manufacturing industry and increase the use of technology to reduce climate impact in global manufacturing. In the 1990s, Intel led an initiative to eliminate the use of Class 1 ozone-depleting substances in semiconductor manufacturing. Our 2030 climate goals are informed by climate science, but due to our (and our industry’s) early emissions reductions and demand growth for semiconductors, it remains challenging to gain formal approval for a target under the existing methodology of the Science-Based Targets Initiative (SBTi). In 2021, we continued to work with industry stakeholders to assess the potential for the development of a sector-specific approach to setting science-based GHG emissions-reduction targets for the semiconductor manufacturing industry. The goal is to expand the number of companies in our sector that set approved science-based targets. Sustainable chemistry. Enable greener and circular chemistry strategies across the technology industry value chain by transforming chemical footprint methodology. In 2021, Intel continued efforts to refine the chemical footprint methodology for use in evaluation of the chemical supply chain, as well as to integrate the methodology into the chemical supply chain to enable better assessment of full lifecycle impact. In addition, we continued to provide webinars to further the promotion of the chemical footprint methodology as a technology industry initiative. Sustainable chemistry baselines were completed for the current manufacturing technologies, as well as for the year 2020. We completed an initial analysis of the current chemical uses and those identified as the highest impact chemistries have been included within a set of priority projects to further scope and disposition. 1 Conflict minerals, as defined by the US Securities and Exchange Commission (SEC), is a broad term that means tin, tantalum, tungsten, and gold (3TG), regardless of whether these minerals finance conflict in the Democratic Republic of the Congo (DRC) or adjoining countries.
Our Business Responsible Inclusive Sustainable Enabling Appendix 10 intel.com/responsibility 2021-22 Corporate Responsibility Report Introduction 2030 Global Challenges We have identified key areas where we believe we can best leverage our manufacturing expertise, unique position within the technology ecosystem, and the wide range of technol - ogy we enable to bring others together to accelerate action on key global challenges to save and enrich lives. These areas include health and well-being, inclusion and economic opportunity, and climate change. Click on the headers below for more detail on our approach and progress. Responsible Inclusive Sustainable Revolutionize how technology will improve health and safety We will apply our expertise, resources, and technology to enable others to harness the power of technology to improve health, safety, and wellness—including in the areas of healthcare and life sciences, manufacturing, and transportation. In 2021, we progressed on our global challenge to apply technology to advance healthcare and safety on multiple fronts. Included were collaborations aimed at facilitating the analysis of data from COVID-19 patients to determine the origin and expected severity of various coronavirus strains, and an edge device that provides information and tools for healthcare workers responsible for vaccine distribution. Make technology fully inclusive and expand digital readiness We will advance inclusion and accessibility for millions of people who currently do not have the technology skills or resources needed to access educational, economic, and community resources in our increasingly digital economy. During 2021, we drove a wide range of digital readiness aimed at empowering non-technical audiences, students, professionals, and leaders with the skills, tools, and opportunities needed to use technology effectively and benefit from the digital economy. We scaled the programs by working with more than 20 countries, 50 education ministries, and other partners, impacting over 13,000 institutions and 1 million people globally. Achieve carbon neutral computing to address climate change While we continue to reduce our own global manufacturing climate footprint, we will also take actions with others to collectively expand the technology “handprint”— transforming product energy use and design and applying technology to reduce computing-related climate impacts across the rest of the global economy. Progress in 2021 included advances across sustainability in manufacturing, use phase, and asset retirement for client PCs. These include advances in specifications, further adoption of specifications, and advances in the Intel® NUC systems, reference platforms, and OEM partnerships. In the data center, progress was made across both the “use phase” and the “create phase,” with specific advances around cooling solutions, product roadmap, and industry engagement with the Open Compute Project. We continue to engage in a range of organizations to build a supportive policy environment for private sector leadership on climate change, and advocate to innovate and invest in climate solutions through our engagement in environmental policy think tanks such as the Center for Climate Change and Energy Solutions. Enabling
Our Business Responsible Inclusive Sustainable Enabling Appendix 11 intel.com/responsibility 2021-22 Corporate Responsibility Report Introduction Awards and Recognitions Third-party ratings and rankings give us valuable feedback on our programs and practices, and help drive continuous improvement over time. Below is a selection of the corporate responsibility-related awards and recognitions that Intel received in 2021 and in the first quarter of 2022. 3BL Media. 100 Best Corporate Citizens AISES. Top 50 Workplaces for Indigenous STEM Professionals American Association of People with Disabilities and Disability:IN. Disability Equality Index As You Sow. Clean200 AnitaB.org. America’s Top Corporations for Women Technologists Barron’s. #1 Most Sustainable Company Bloomberg. Bloomberg Gender-Equality Index CDP. “A” Water Security Rating, “A” Climate Change Rating, Supplier Engagement Leadership Rating Center for Political Accountability. CPA-Zicklin Index of Corporate Political Disclosure and Accountability—Trendsetter Company Center for Resource Solutions. Renewable Energy Markets Asia Award Corporate Knights. Global 100 Most Sustainable Corporate Citizens DisabilityIN. ERG of the Year Dow Jones Sustainability Index. North America Index Ethisphere Institute. World’s Most Ethical Companies Forbes. World’s Best Employers, America’s Best Employers for Women, America’s Best Employers for Diversity, America’s Best Employers for New Grads, and America’s Best Employers for Veterans Fortune. Top 20 Fortune 500 Companies on Diversity and Inclusion FTSE Group. FTSE4Good Index 1 Gartner. Supply Chain Top 25 Hispanic Association of Corporate Responsibility. Corporate Inclusion Index 5-Star Rating for Governance Human Rights Campaign. Corporate Equality Index ISS. 1 rating in both Environment & Social QualityScore 2 JUST Capital and Forbes. JUST 100 LATINA Style 50. Top 50 Best Companies for Latinas to Work in the US Minority Engineer. Top 50 Employers MSCI. World ESG Leaders Index 3 National Business Inclusion Consortium. Best-of-the-Best Corporations for Inclusion Newsweek. America’s Most Responsible Companies Religious Freedom & Business Foundation. Corporate Religious Equity, Diversity and Inclusion Index RepTrak. 2021 Global RepTrak® 100 US Environmental Protection Agency. #3 Ranking on Green Power Partnership National Top 100 Wall Street Journal. Management Top 250 Women’s Business Enterprise National Council. Top Corporations for Women’s Business Enterprises WE Connect International. Top 10 Global Champions for Supplier Diversity Inclusion Women Engineer Magazine. Top 50 Employers – Reader’s Choice Working Mother. 100 Best Companies for Multicultural Women 1 FTSE Russell (the trading name of FTSE International Limited and Frank Russell Company) confirms that Intel Corporation has been independently assessed according to the FTSE4Good criteria, and has satisfied the requirements to become a constituent of the FTSE4Good Index Series. Created by the global index provider FTSE Russell, the FTSE4Good Index Series is designed to measure the performance of companies demonstrating strong Environmental, Social and Governance (ESG) practices. The FTSE4Good indices are used by a wide variety of market participants to create and assess responsible investment funds and other products. 2 Scores as of end of year 2021. 3 The inclusion of Intel Corporation is any MSCI Index, and the use of MSCI logos, trademarks, service marks or index names herein, do not constitute a sponsorship, endorsement or promotion of Intel Corporation by MSCI or any of its affiliates. The MSCI Indexes are the exclusive property of MSCI. MSCI and the MSCI Index names and logos are trademarks or service marks of MSCI or its affiliates.
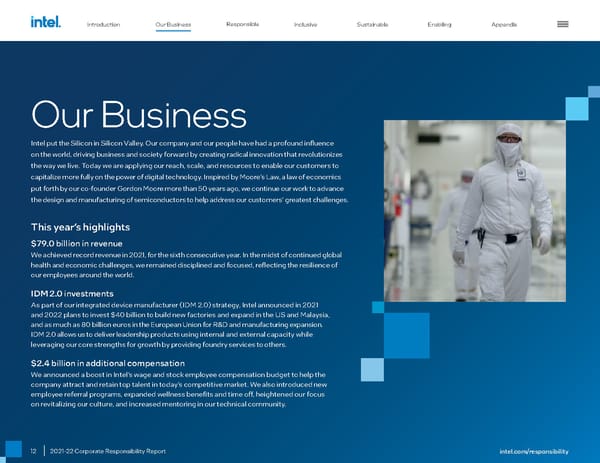
12 2021-22 Corporate Responsibility Report Our Business Intel put the Silicon in Silicon Valley. Our company and our people have had a profound influence on the world, driving business and society forward by creating radical innovation that revolutionizes the way we live. Today we are applying our reach, scale, and resources to enable our customers to capitalize more fully on the power of digital technology. Inspired by Moore’s Law, a law of economics put forth by our co-founder Gordon Moore more than 50 years ago, we continue our work to advance the design and manufacturing of semiconductors to help address our customers’ greatest challenges. This year’s highlights $79.0 billion in revenue We achieved record revenue in 2021, for the sixth consecutive year. In the midst of continued global health and economic challenges, we remained disciplined and focused, reflecting the resilience of our employees around the world. IDM 2.0 investments As part of our integrated device manufacturer (IDM 2.0) strategy, Intel announced in 2021 and 2022 plans to invest $40 billion to build new factories and expand in the US and Malaysia, and as much as 80 billion euros in the European Union for R&D and manufacturing expansion. IDM 2.0 allows us to deliver leadership products using internal and external capacity while leveraging our core strengths for growth by providing foundry services to others. $2.4 billion in additional compensation We announced a boost in Intel’s wage and stock employee compensation budget to help the company attract and retain top talent in today’s competitive market. We also introduced new employee referral programs, expanded wellness benefits and time off, heightened our focus on revitalizing our culture, and increased mentoring in our technical community. Introduction Responsible Inclusive Sustainable Enabling Appendix Our Business intel.com/responsibility
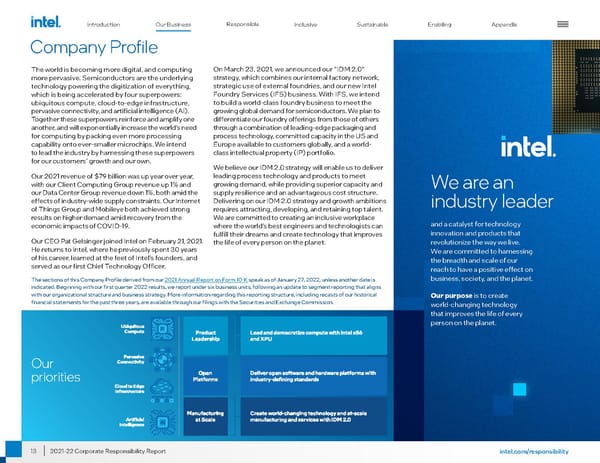
13 intel.com/responsibility 2021-22 Corporate Responsibility Report The world is becoming more digital, and computing more pervasive. Semiconductors are the underlying technology powering the digitization of everything, which is being accelerated by four superpowers: ubiquitous compute, cloud-to-edge infrastructure, pervasive connectivity, and artificial intelligence (AI). Together these superpowers reinforce and amplify one another, and will exponentially increase the world ’ s need for computing by packing even more processing capability onto ever-smaller microchips. We intend to lead the industry by harnessing these superpowers for our customers ’ growth and our own. Our 2021 revenue of $79 billion was up year over year, with our Client Computing Group revenue up 1% and our Data Center Group revenue down 1%, both amid the effects of industry-wide supply constraints. Our Internet of Things Group and Mobileye both achieved strong results on higher demand amid recovery from the economic impacts of COVID-19. Our CEO Pat Gelsinger joined Intel on February 21, 2021. He returns to Intel, where he previously spent 30 years of his career, learned at the feet of Intel ’ s founders, and served as our first Chief Technology Officer. Company Profile On March 23, 2021, we announced our “ IDM 2.0 ” strategy, which combines our internal factory network, strategic use of external foundries, and our new Intel Foundry Services (IFS) business. With IFS, we intend to build a world-class foundry business to meet the growing global demand for semiconductors. We plan to differentiate our foundry offerings from those of others through a combination of leading-edge packaging and process technology, committed capacity in the US and Europe available to customers globally, and a world- class intellectual property (IP) portfolio. We believe our IDM 2.0 strategy will enable us to deliver leading process technology and products to meet growing demand, while providing superior capacity and supply resilience and an advantageous cost structure. Delivering on our IDM 2.0 strategy and growth ambitions requires attracting, developing, and retaining top talent. We are committed to creating an inclusive workplace where the world ’ s best engineers and technologists can fulfill their dreams and create technology that improves the life of every person on the planet. We are an industry leader and a catalyst for technology innovation and products that revolutionize the way we live. We are committed to harnessing the breadth and scale of our reach to have a positive effect on business, society, and the planet. Our purpose is to create world-changing technology that improves the life of every person on the planet. Our priorities The sections of this Company Profile derived from our 2021 Annual Report on Form 10-K speak as of January 27, 2022, unless another date is indicated. Beginning with our first quarter 2022 results, we report under six business units, following an update to segment reporting that aligns with our organizational structure and business strategy. More information regarding this reporting structure, including recasts of our historical financial statements for the past three years, are available through our filings with the Securities and Exchange Commission. Introduction Responsible Inclusive Sustainable Enabling Appendix Our Business
14 intel.com/responsibility 2021-22 Corporate Responsibility Report How We Organize Our Business % Intel Revenue Key Markets and Products Client Computing Group. Includes platforms designed for end-user form factors, focusing on higher growth segments of 2-in-1, thin-and- light, commercial and gaming, and growing adjacencies such as connectivity and graphics. Data Center Group. Includes workload- optimized platforms and related products designed for cloud service providers, enterprise and government, and communications service providers market segments. Internet of Things Group. Includes high- performance compute solutions for targeted verticals and embedded applications in market segments such as retail, industrial, and healthcare. Mobileye. Includes comprehensive solutions required for autonomous driving, including compute platforms, computer vision, and machine learning- based sensing, mapping and localization, driving policy, and active sensors in development, utilized for both Robotaxi and consumer-level autonomy. Non-Volatile Memory Solutions Group. Includes memory and storage products like Intel® 3D NAND technology, primarily used in SSDs. 1 Programmable Solutions Group. Includes programmable semiconductors, primarily FPGAs and structured ASICs, and related products for communications, cloud and enterprise, and embedded market segments. Our Customers Our portfolio of products and capabilities positions us well to play a larger role in our customers ’ success. Beyond the CPU, we are delivering a growing family of xPU products (graphics processing units [GPUs], accelerators, and field-programmable gate arrays [FPGAs]) to help meet our customers ’ increasingly diverse computing needs. We sell our products primarily to original equipment manufacturers (OEMs), original design manufacturers (ODMs), and cloud service providers. In addition, our customers include other manufacturers and service providers, such as industrial and communication equipment manufacturers and other cloud service providers, who buy our products through distributor, reseller, retail, and OEM channels throughout the world. Our worldwide reseller sales channel consists of thousands of indirect customers— systems builders that purchase Intel® processors and other products from our distributors. For additional information, refer to the 2021 Intel Annual Report on Form 10-K . Our Competitors We face intense competition across our product portfolio from companies offering platform products; accelerator products such as GPUs; other accelerator products such as application-specific integrated circuits (ASICs), application-specific standard products, and FPGAs; memory and storage products; connectivity and networking products; and other semiconductor products. We also compete with internally developed semiconductors from OEMs, cloud service providers, and others, some of whom are customers. For additional information, refer to the 2021 Intel Annual Report on Form 10-K . Our Products Our product offerings provided end-to-end solutions, scaling from edge computing 2 to 5G networks, the cloud, and the emerging fields of AI and autonomous driving. Products, such as our gaming CPUs, may be sold directly to end customers, or they may be further integrated by our customers into end products such as notebooks and storage servers. Combining some of these products— for example, integrating FPGAs and memory with Intel® Xeon® processors in a data center solution—enables incremental synergistic value and performance. End-to-End Product Portfolio In 2021, we launched new products, such as the 12th Gen Intel® Core™ processors (previously referred to as Alder Lake), the first on the Intel 7 process, with real-world performance for enthusiast gamers and professional creators. In addition, we launched the 3rd Gen Intel® Xeon® Scalable processor (Ice Lake), which boasts up to 40 cores and delivers a significant increase in performance, on average, compared to the previous generation. These Intel Xeon processors include a set of built-in security features, cryptographic acceleration, and AI. For more information, refer to the 2021 Intel Annual Report on Form 10-K . 1 In October 2020, we signed an agreement with SK hynix to divest our NAND memory business. The NAND memory business makes up our NSG segment. The transaction will occur over two closings, the first of which was completed on December 29, 2021, subsequent to our fiscal 2021 year end. 2 Placing resources to move, store, and process data closer to where data is generated and consumed. Introduction Responsible Inclusive Sustainable Enabling Appendix Our Business
15 intel.com/responsibility 2021-22 Corporate Responsibility Report Intel® W i-Fi 6 Solutions Au tonomous Driving Client Connectivity Cloud Computing Client Computing AI and Analytic s 5G Netw ork IoT End-to-End Product Portfolio We also introduced a broad, data-centric portfolio for 5G network infrastructure, including a System-on-a-Chip (SoC) for wireless base stations, structured ASICs for 5G network acceleration, and a 5G network-optimized Ethernet Network Interface Controller (NIC). In addition, we revealed the brand for our upcoming consumer high- performance graphics: Intel® Arc™ graphics. The Intel Arc brand will cover hardware, software, and services, and will span multiple hardware generations, with the first generation shipping to OEMs in early 2022. On December 29, 2021, we completed the first closing of the divestiture of our NAND memory business to SK hynix, Inc. We intend to invest transaction proceeds to deliver leadership products and advance our long-term growth priorities. For more information about our products, read our 2021 Intel Annual Report on Form 10-K . Product Responsibility and Impact We strive to minimize the environmental impact of our products at all phases in their life cycle: development, production, use, and ultimate disposal. We also consider accessibility during product development, and design products that are accessible to a wider range of users— including people with disabilities. For more information, see “ Product Ecology ” and “ Product Energy Efficiency ” in the Sustainable section and “ Making Technology Fully Inclusive ” in the Inclusive section of this report. We recognize that innovation, growth, and the success of our business and our industry depend on individuals’ trust in their use of technology and in the responsible, protected collection and processing of their data. We also do not tolerate our products being used to violate human rights. For more detail, see “ Respecting Human Rights ” later in this section of the report. Examples of innovative applications of our technology and collaborations with our customers and other stake - holders are highlighted in the RISE global challenge discussions at the end of each section of this report. From Sand to Silicon The transistor is the engine that powers every Intel processor. To build a modern computer chip, our engineers place billions of these tiny switches into an area no larger than a fingernail. Watch the video to see how Intel builds the world’s most complex devices. Introduction Responsible Inclusive Sustainable Enabling Appendix Our Business
16 intel.com/responsibility 2021-22 Corporate Responsibility Report Cybersecurity and Product Security At Intel, security comes first both in the way we work and in what we work on. Our culture and practices guide everything we build, with the goal of delivering the highest performance and optimal protections. As with previous reports, the 2021 Intel Product Security Report demonstrates our Security First Pledge and our endless efforts to proactively seek out and mitigate security issues. We recognize that massive shifts in how we live, work, connect, and communicate increase the need for technologies that people trust, built on a foundation of security. We prioritize security in two ways: in the way we work, through our culture and practices aimed at delivering high performance and protections in everything we build; and in what we work on, through our relentless pursuit of security-driven innovations that help our customers tackle today’s toughest challenges. Security Technologies Strategy. To meet the challeng - es of computing that spans cloud to edge and devices, security must be a continual focus. We understand the complexity that results from the ongoing computing transformation. We have deep experience in enabling security, as well as a comprehensive suite of technolo - gies that help secure entire systems and deliver defense in depth. We engineer security solutions to meet specific challenges centered around three key priorities: foun - dational security to help systems come up as expected, workload protection to improve security of data in use, and software reliability to build in hardware-based pro - tections against common software threats. Comprehensive Security Practices. Through the Security Development Lifecycle (SDL), we apply security and privacy principles at six phases, from planning through release and post-deployment. SDL covers Intel® hardware, firmware, and software products. In release and post-deployment, an essential part of our product support is ongoing security research and mitigations. In 2021 we expanded our Bug Bounty Program , which incentivizes security researchers to report vulnerabilities in Intel products. We began rewarding researchers with bonus multipliers for findings in specific areas of interest, leading to mitiga - tions and improved security in an array of products. We also work across the industry to improve security; when a vulnerability is identified, we work with affected partners to develop and release mitigations. We align on disclosure to minimize potential threats while we work to address the vulnerability. Security Research. Continuous improvement is made through investments in offensive research on the security of our products. We have a dedicated team of experts who continually research and test products internally. Internal security research for 2021 accounts for 50% of the issues addressed and an additional 43% were reported through Intel ’ s Bug Bounty Program. This work is scaled through practices that include red teaming and hackathons. We use what we learn to improve our products and practices, and we collaborate with world- class industry partners, global security researchers, and academic institutions to advance security research across the industry. For more information, visit Product Security at Intel or read our Intel Product Security 2021 Report . In addition, our Cyber Security Inside podcast series provides insights on cybersecurity-related trends to information security and industry executives. Planning and assessment Architecture Design 1 4 2 3 5 6 Implementation Security validation Release/ post deployment Security Development Lifecycle Securing Intel’s Supply Chain Our sourcing and manufacturing practices are built on decades of experience and aligned to industry-leading processes. Our supply chain security program leverages this expertise and has embedded security controls through - out the vendor lifecycle. Intel’s supply chain security risk management program is derived from standard industry risk management frameworks such as NIST and ISO and provides security assurance through the integration of security controls throughout sourcing and supplier management practices. Security expectations begin at supplier selection. Expectations are then reinforced through contractual security terms and conditions, recurring information security audits, ongoing security key performance indicators, and recurrent required training. Our Cybersecurity Supply Chain Risk Management (C-SCRM) program executes hundreds of information security supplier audits annually and is aligned to standard industry information security management frameworks, including ISO 27001 and NIST 800-30. Additionally, we continuously monitor the cybersecurity posture of our suppliers through a third-party security ratings platform and have a dedicated third-party cyber incident response team. We are also committed to advancing evolving supply chain security standards and policies by working with governments, organizations, and industries. Visit our Sourcing and Manufacturing Security site to learn more. Introduction Responsible Inclusive Sustainable Enabling Appendix Our Business
17 intel.com/responsibility 2021-22 Corporate Responsibility Report Our Capital We believe that our integrated approach to financial matters, corporate governance, and corporate responsibility drives increased accountability, improves decision making, and ultimately creates long-term value. In line with the International Integrated Reporting Council’s International framework and six capitals concept, we have outlined how we deploy capital to execute our strategy in a way that seeks to reflect our corporate values, help our customers succeed, and create value for our stakeholders. Each of our six forms of capital, summarized below, plays a critical role in our long-term value creation. For more detail, see the 2021 Intel Annual Report on Form 10-K . Financial Capital. Our financial capital allocation strategy focuses on building stockholder value. Our first allocation priority is to invest in R&D and capital spending to capitalize on the opportunity presented by the world’s demand for semiconductors. Our second allocation priority is to invest in and acquire companies that complement our strategic objectives. Our third allocation priority is to return cash to stockholders. We achieve this through our dividend and share repurchase programs. As we invest in our IDM 2.0 strategy, our allocation priorities will shift more heavily toward investing in the business and away from share repurchases. We expect our future stock repurchases to be significantly below our levels from the last few years. During 2021, we paid $5.6 billion in dividends similar to same amount paid in 2020. We have paid a cash dividend in each of the past 117 quarters. For additional 2021 financial information, see the 2021 Intel Annual Report on Form 10-K . Our Capital We deploy various forms of capital to execute our strategy in a way that seeks to reflect our corporate values, help our customers succeed, and create value for our stakeholders. Capital Strategy Value Financial Leverage financial capital to invest in ourselves and drive our IDM 2.0 strategy, supplement and strengthen our capabilities through acquisitions, and provide returns to stockholders. We strategically invest financial capital to create long-term value and provide returns to our stockholders. Intellectual Invest significantly in R&D and IP to enable us to deliver on our accelerated process technology roadmap, introduce leading x86 and xPU products, and develop new businesses and capabilities. We develop IP to enable next-generation products, create synergies across our businesses, expand into new markets, and establish and support our brands. Manufacturing Aligned with our IDM 2.0 strategy, invest to efficiently build manufacturing capacity to address growing global demand for semiconductors. Our geographically balanced manufacturing scope and scale enable us to provide our customers and consumers with a broad range of leading-edge products. Human Continue to build a diverse, inclusive, and safe work environment to attract, develop, and retain top talent needed to build transformative products. Our talented employees enable the development of solutions and enhance the intellectual and man - ufacturing capital critical to helping our customers win the technology inflections of the future. Social and Relationship Build trusted relationships for both Intel and our stakeholders, including employees, suppliers, customers, local communities, and governments. We collaborate with stakeholders on programs to empower underserved communities through education and technology, and on initiatives to advance accountability and capabilities across our global supply chain, including accountability for the respect of human rights. Natural Continually strive to reduce our environmental footprint through efficient and responsible use of natural resources and materials used to create our products. With our proactive efforts, we seek to mitigate climate and water impacts, achieve efficiencies, and lower costs, and position us to respond to the expectations of our stakeholders. Intel Capital. For over three decades, Intel Capital, our global invest - ment organization, has invested more than $20 billion to back standout, early-stage technology startups across four key areas: silicon, frontier, devices, and cloud. Intel Capital-backed companies have produced more than 700 IPOs and exits, and created more than $100 billion in market value in the past 10 years. Learn more . 2020 2021 $72.9 $74.7 $24.4 $22.2 $5.10 $5.47 Revenue GAAP $B Non-GAAP $B GAAP $B Non-GAAP $B GAAP $B Non-GAAP $B 2020 2021 Operating Income 2020 2021 Diluted EPS $77.9 $79.0 $23.7 $19.5 $4.94 $4.86 The preparation of consolidated financial statements is in conformity with US Generally Accepted Accounting Principles (GAAP). We have included key metrics that we use to measure our business, some of which are non-GAAP measures. See “ Non-GAAP Financial Measures ” in the Appendix for a reconciliation of non-GAAP operating income and non-GAAP EPS to comparable GAAP measures. Introduction Responsible Inclusive Sustainable Enabling Appendix Our Business
18 intel.com/responsibility 2021-22 Corporate Responsibility Report Intellectual Capital. R&D investment is critical to enable us to deliver on our accelerated process technology roadmap, introduce leading products, and develop new businesses and capabilities. Our objective with each new generation of products is to improve user experiences and value through advances in perfor - mance, power, cost, connectivity, security, form factor, and other features. We also focus on reducing our design complexity, reusing IP, and increasing ecosystem collaboration to improve our efficiency. We seek to protect our R&D efforts through our IP rights and may augment R&D initiatives by acquiring or investing in companies, entering into R&D agreements, and directly purchasing or licensing technology. We own and develop significant IP and related IP rights around the world that support our products, services, R&D, and other activities and assets. Our IP portfolio includes patents, copyrights, trade secrets, trademarks, mask works, and other rights. Intel ranked #6 in patents granted for 2021 by the US Patents and Trademark Office, our seventh straight year in the top 10. 3 For additional information regarding our IP rights, see the 2021 Intel Annual Report on Form 10-K . Manufacturing Capital. Our IDM 2.0 strategy allows us to deliver leadership products through the use of internal and external capacity while leveraging our core strengths for growth via providing foundry services to others. IDM 2.0 combines three factors. First, we will continue to build the majority of our products in Intel fabs. Second, we expect our use of third-party foundry capacity to grow and to include manufacturing for a range of modular tiles on advanced process tech - nologies. Third, we intend to build a world-class foundry business with Intel Foundry Services (IFS), which will combine leading-edge process and packaging technology, committed capacity in the US and Europe, and a world-class IP portfolio for customers, including x86 cores. Our work to advance the design and manufacturing of semiconductors enables new products with higher performance while balancing power efficiency, cost, and size. We continue to work across our supply chain to minimize disruptions, improve productivity, and increase overall capacity and output to meet customer expectations. In 2021, our factories performed well in a highly dynamic environment, where we adapted to rapid demand shifts and industry component shortages affecting us and our customers. 3 Source: IFI CLAIMS Patent Services , as of January 5, 2022. As of our fiscal 2021 year-end, we had 10 manufacturing sites—six wafer fabrication and four assembly/test facilities. The map above shows these factory sites and the countries where we had a significant R&D and/or sales presence. The Dalian factory was sold subsequent to year-end as part of the first closing of the divestiture of our NAND Memory business. The majority of our logic wafer manufacturing is conducted in the US. To accelerate our IDM 2.0 strategy, in March 2021 we announced plans to invest $20 billion to build two additional fabs in Arizona , which we broke ground on in September 2021. In 2021, we also announced an approximately $10.5 billion investment to equip our Rio Rancho, New Mexico and Malaysia sites for advanced packaging manufacturing. In 2022, we announced plans to invest more than $20 billion in the construction of two leading-edge fabs at a new Intel site in Ohio , and up to 80 billion euros to advance a world-class semiconductor ecosystem in the European Union . The European investment will include a new fab mega-site in Germany; an R&D hub in France; and R&D, manufacturing, and foundry services in Ireland, Italy, Poland, and Spain. Oregon Arizona New Mexico Costa Rica Ireland Israel Malaysia Chengdu Vietnam Dalian Wafer Fabs Assembly and Test Intel Presence Intel Worldwide Headquarters Santa Clara, California “Intel has been a leader in sustainability results for decades. With leadership comes responsibility. We’re now raising the bar and entering an exciting era to achieve net-zero greenhouse gas emissions across our operations by 2040. This will require significant innovation and investment, but we are committed to do what it takes and will work with the industry to achieve this critical mission.” — Keyvan Esfarjan i, Executive Vice President and Chief Global Operations Officer at Intel Introduction Responsible Inclusive Sustainable Enabling Appendix Our Business
19 intel.com/responsibility 2021-22 Corporate Responsibility Report Our global supply chain supports internal partners across architecture, product design, technology development, manufacturing and operations, sales and marketing, and business units, and our supply ecosystem comprises thousands of suppliers globally. Our mission is to enable product and process leadership, industry-leading total cost of ownership, and uninter - rupted supply for our customers. In addition to our own manufacturing capacity, we continue to expand our use of third-party foundries. Human Capital. Our human capital strategy is grounded in our belief that our people are fundamental to our success. Delivering on our IDM 2.0 strategy and growth ambitions requires attracting, developing, and retaining top talent from across the world. The digitization of everything is driving growth and global demand for semiconductors. Combined with the tightening labor market and economic recovery from COVID-19, this has driven a significant increase in competition throughout the industry to attract and retain talent—especially technical talent. We invest significant resources to develop the talent needed to remain at the forefront of innovation and make Intel an employer of choice. We offer extensive training programs and provide rotational assignment opportunities. We are committed to creating an inclusive workplace where the world’s best engineers and technologists can fulfill their dreams and create technology that improves the life of every person on the planet. We invest in our highly skilled workforce of through creating practices, programs and benefits that support the evolving world of work and our employees’ needs. Social and Relationship Capital. We are committed to engaging in corporate responsibility and sustainability initiatives that support our communities and help us develop trusted relationships with our stakeholders. Proactive engagement with our stakeholders and investments in social impact initiatives, including those aligned with the United Nations Sustainable Development Goals , advance our position as a leading corporate citizen and create shared value for Intel, our global supply chain, and our communities. We provide high-skill, high-paying jobs around the world. Many of these are manufacturing and R&D jobs located in our own domestic and international factories. We also benefit economies through our R&D ecosystem spending, sourcing activities, consumer spending by our employees, and tax payments. In addition, we make sizable capital investments and provide leadership in public-private partnerships to spur economic growth and innovation. We also aim to empower people through education and advance social initiatives to create career pathways into the technology industry. In addition to the direct employment Intel’s operations provide, our operational spending, capital investment, and distribution channel support additional jobs. We engage third-party organizations to conduct analyses of the economic impact of our operations, including a US impact study in 2021 that found that for every US Intel job, Intel’s economic activity in the US indirectly supports an additional 13 jobs. For more information on our social and relationship capital, see “ Stakeholder Engagement ” and “ Supply Chain Responsibility ” later in this section. Natural Capital. Driving to the lowest possible environmental footprint as we grow helps us create efficiencies, lower costs, and respond to the needs of our stakeholders. We invest in sustainability projects and set company-wide environmental targets to drive reductions in greenhouse gas emissions, energy use, water use, and waste generation. We build energy efficiency into our products to help our customers lower their own emissions and energy costs, and we collaborate with policymakers and other stakeholders to use technology to address environmental challenges. For more information, see the Sustainable section of this report. We consider numerous indicators in determining the success of our capital deployment in creating value. The above graphic shows highlights of value created through 2021. 4 See “ Non-GAAP Financial Measures ” in the Appendix. Introduction Responsible Inclusive Sustainable Enabling Appendix Our Business
20 intel.com/responsibility 2021-22 Corporate Responsibility Report Our People and Culture We invest significant resources to build a diverse, inclusive, and safe work environ - ment to attract, develop, and retain the talent needed to remain at the forefront of innovation. Our workforce is highly skilled, with approximately 89% serving in technical roles. Intel’s Human Resources (HR) organization has primary responsibility for our workplace and talent development activities, and HR systems and processes. In 2021, the organization completed long-range planning to define HR’s purpose and strategy in line with our business strategy. HR’s purpose is to deliver talent through the employee life cycle to accelerate Intel’s growth and enable a culture of empowerment, inclusion, and accountability. Our executive leadership team is held accountable each quarter to update prog - ress on workforce representation. Detailed information on our diversity and inclusion initiatives is available on our Diversity and Inclusion website and in the Inclusive section of this report. Evolving Our Culture Fostering a culture of empowerment, inclusion, and accountability is core to our IDM 2.0 strategy. We are focused on adapting our culture to strengthen our execution and accelerate our cadence of innovation. Our evolution requires new and different thinking, actions, and integrated systems and processes. We have evolved our performance management system to support our culture evolution and increase our focus on disciplined goal setting and results. We are working to expand our growth mindset, increase accountability around shared company goals, implement new operational protocols, and renew a sense of purpose and value to create an environment for innovation and growth. The Intel Values inspire us and are key to delivering on our purpose. This year, we added a new value—results driven—as we seek to return to our roots of innovation and execution, making data-driven decisions quickly and setting disciplined goals that drive business results. All employees are responsible for upholding these values, the Intel Code of Conduct , and the Intel Global Human Rights Principles , which form the foundation of our policies and practices and ethical business culture. Intel Values Customer first. We listen, learn, and anticipate our customers’ needs. We deliver to our customer commitments with simplicity, clarity, and speed. We nurture partnerships and foster growing ecosystems. Fearless innovation. We take informed risks together, learn and pivot quickly from mistakes to be better, faster, smarter. We continuously improve, enabling us to be more curious, bold, and innovative. We are competitively paranoid to anticipate change and disrupt markets. Results driven. We prioritize, focus, and execute flawlessly with urgency. We make data-driven decisions with intellectual honesty and constructive debate; we disagree and commit. We assume responsibility to deliver long-term stakeholder value. One Intel. We commit to team success, doing what’s best for Intel. We recognize, respect, and build trust with each other. We value and grow passionate, empowered teams. Inclusion. We value diversity and embrace differences. We build inclusive teams where everyone does their best work, celebrates, and has fun. We care and make a difference to each other and our communities. Quality. We are disciplined to deliver products and services that our customers and partners can always rely on. We set and achieve high quality and security standards. We cultivate talent to do the right things right. Integrity. We are truthful and transparent and act with uncompromising integrity. We ensure a safe and healthy workplace. We shape technology as a force for good. As of December 27, 2021, we had 121,100 employees worldwide in more than 50 countries and territories. A list of sites with more than 50 employees is included on the Report Builder website. Asia Pacific United States, Canada, and Latin America Europe, Middle East, Africa 51% 32% 17% 2021 Employees by Region Introduction Responsible Inclusive Sustainable Enabling Appendix Our Business
21 intel.com/responsibility 2021-22 Corporate Responsibility Report Communication and Employee Engagement Our success depends on employees understanding how their work contributes to the company’s overall strategy. We use a variety of channels to facilitate open and direct communication, including online forums, open forums with executives, employee experience surveys, and engagement through more than 35 different employee resource groups. The semiannual Employee Experience Survey invites our entire employee population to provide feedback on Intel culture, management, career oppor - tunities, compensation, and benefits. We also have an Employee Inclusion Survey to help us understand how different employee populations experience inclusion at Intel. In addition, employees provide direct feedback on their managers and leaders through the annual Manager Development Feedback survey, and individual business groups conduct their own surveys to gather employee input and assess progress. For example, our Ethics Program Office surveys employees on the state of ethics at the company, and our Corporate Services organization measures satisfaction with workplace design, cafeterias, and other on-site employee services. Growth and Development Our employees develop their skills and strengthen their leadership abilities through our extensive training programs and rotational opportunities. Each year, we deliver a portfolio of learning resources that help employees keep their skills up-to-date. We also provide financial assistance for job-related degrees and course - work, as well as support to enable employees to attend industry conferences. In 2021, we increased our virtual learning platform offerings to include more technical, innovative, and collaborative skills training and programs. We reinforced our on-the-job development opportunities through rotation or temporary assignment programs (“gigs”). Our web-based development tool enables employees to apply for gigs across the company. In addition, our US Recognition and Appreciation A top priority for Intel is celebrating the accom - plishments of our employees through everyday thank-yous, as well as formal recognition programs with cash or stock awards. Formal programs include the Intel Achievement Awards; Intel Environmental Excellence Awards; Intel Quality Awards; Global Diversity, Inclusion, and Social Impact Awards; Division Recognition Awards; Spontaneous Recognition Awards; and the Intel Involved Hero Awards. sabbatical program creates growth opportunities through job coverage assignments that enable employees to work in different Intel organizations or learn new skills without transferring positions. These opportunities enable employees to work on short-term projects that help them gain new experiences, build valuable skills, expand their networks, and grow their careers. We are evaluating our compliance training strategy to look for opportunities to streamline compliance training hours while improving training quality to make it more impactful. Our goal is to reach a corporate benchmark of four or fewer hours of compliance training per year per employee while still meeting legal and ethics requirements. 2021 Learning and Development Required Training As part of our learning and development programs, Intel employees are required to take trainings covering legal and ethics standards, as well as operational and technical compliance. In 2021, those trainings averaged 12 hours for each of our nearly 128,000 employees, for a total of more than 1.5 million hours. Employee Experience Survey Highlights 100% My organization encourages safety, health. 95% Intel provides opportunity for learning and development. 95% My work gives me a feeling of personal accomplishment. 90% I am treated with dignity and respect at work. 93% My job is challenging and interesting. Responses from the 2021 Employee Experience Survey. We also have an Employee Inclusion Survey to help us understand how different employee populations identify and experience inclusion. Introduction Responsible Inclusive Sustainable Enabling Appendix Our Business
22 intel.com/responsibility 2021-22 Corporate Responsibility Report Compensation and Benefits We structure pay, benefits, and services to meet the varying needs of our employees. In December 2021, we announced the addition of $1 billion in wages and about $1.4 billion worth of stock to our employee compensation budget to help attract and retain top talent in today's competitive market. Our bonus programs link employees’ compensation directly to Intel’s financial and operational performance goals: Quarterly Profit Bonus: A cash profit-sharing bonus paid to employees four times per year based on Intel’s profitability. Annual Performance Bonus: Cash awards based on Intel’s achievement of financial and operational goals, as well as employees’ individual performance. Since 2008, we have included criteria related to corporate responsibility metrics such as diversity and inclusion and sustainability performance. For more details, see “ Governance, Ethics, and Public Policy ” later in this section of the report. Stock Equity Plans: We grant equity in the form of Restricted Stock Units (RSUs) to approximately 90% of global employees each year. In addition, through our Employee Stock Purchase Plan, eligible employees can purchase stock through payroll deductions at 85% of fair market value. Since 2019, we have achieved gender pay equity globally and we continue to maintain race/ethnicity pay equity in the US. For more information, see the Inclusive section of this report. Beyond market-competitive pay, broad-based stock grants, and bonuses, our total rewards package includes healthcare and retirement benefits, paid time off and family leave, parent reintegration, fertility assistance, flex - ible work schedules, sabbaticals, and on-site services. For many years, we have also provided programs dedicated to supporting the education of Intel employees’ children, including tutoring, college coaching, and scholarships. Our comprehensive health benefits include medical, dental, and vision insurance plans, sick leave, and a 365/24/7 Employee Assistance Program for employees and their families. Our retirement plan options include a 401(k) retirement match by Intel. Our leave benefits include paid family leave to care for a seriously ill family member, extended bereavement leave, expanded bonding leave and parental reintegration support, and additional short-term disability coverage. To aid and support employees during COVID-19, we committed to invest more than $100 million in additional benefits for both employees working on site and those working from home. These benefits included additional childcare and caregiver support, COVID-19 leave time, and free meals for on-site essential employees. We put in place a telecommuting reimbursement program to help employees required to work from home improve their workspaces to work safely, ergonomically, and effectively from their remote locations. We also pivoted a number of our on-site services; for example, our fitness programs began offering virtual classes, workouts, and nutrition consultations. For more information see “ Employee Health, Safety, and Wellness ” in the Responsible section of this report. Though flexible work schedules are part of our existing total rewards package, the COVID-19 pandemic provided an opportunity to further reimagine how our employees work and collaborate. In designing the future of our work - place, we surveyed employees around the globe to inform our “hybrid-first” approach, where the majority of our employees will split their time between working remotely and in the office, with no company-wide mandate on the number of days per week employees should be on-site or how they should collaborate. Our goal is to enable remote and on-site work where it drives the best output, while ensuring our employees have equitable access to systems, resources, and opportunities that allow them to succeed. Learn more about our comprehensive benefits, including details of benefits offered by country. Intern Program As part of our continuing goal to build a solid talent pipeline, Intel’s Intern program offers college students real-world experience with leading-edge technologies, competitive salaries, networking opportunities, and more. Through a virtual platform established at the onset of COVID-19 pandemic, our intern hire reach increased 24% in 2021. The program included close to 80 events and 20 executive acumen sessions. The finalist in an internship Passport Program won a virtual lunch session with Intel’s CEO. In 2021, 99% of US interns recommended working at Intel and 45% are planning to return to Intel as full-time employees. Intel’s intern score on Glassdoor was 4.81/5. Undesired Global Turnover The digitization of everything is driving growth and global demand for semiconductors. Combined with the tightening labor market and economic recovery from COVID-19, this has driven a significant increase in competition throughout the industry to attract and retain talent—especially technical talent. In 2021, we intensified our efforts to continue to attract and retain talent, including introducing new employee referral programs, expanding wellness benefits and time off, heightening our focus on revitalizing our culture, and increasing mentoring in our technical community. In 2021, our undesired turnover rate was 5.6%, compared to 4.0% in 2020. These figures include all regular Intel employees who voluntarily left Intel, but do not include Intel contract employees, interns, or employees who separated from Intel due to divestiture, retirement, voluntary separation packages, death, job elimination, or redeployment. 5.0 0.0 2020 2021 Percent 10.0 2018 2019 2017 5.0% 4.1% 4.8% 4.0% 5.6% Introduction Responsible Inclusive Sustainable Enabling Appendix Our Business
23 intel.com/responsibility 2021-22 Corporate Responsibility Report Learn. Our RISE Speaker Series provides employees with an active learning forum and direct access to the company’s sustainability leaders to build and foster a corporate-wide community. The series, which covers a broader range of topics and opportunities to support Intel’s RISE goals, reaches thousands of employees across nine campuses via telepresence. In early 2021, we also launched a Social Equity Speaker series, based on employee input, to drive new learning and conversations among employees on social equity and racial justice. Act. Our RISE portal provides employees with information on specific actions they can take to support our RISE goals, including information on our skills-based volunteer programs . Transform. For each of the key areas of RISE, cross-functional teams of employees lead integration strategies for the goals, including a Technology Impact Steering Committee aimed at deepening engagement with business units and product teams. In addition, individual teams and business units have created customized plans to leverage their unique skills and expertise in support of our goals. Engaging Employees in our RISE Strategy Intel and the Intel Foundation invest in programs that create opportunities for employees around the world to help advance Intel’s corporate purpose and our corporate responsibility goals. Intel’s leadership in corporate responsibility and sustainability helps us to be an employer of choice and to attract and retain top talent. In 2021, we launched the 2030 RISE Employee Engagement Champion Network, with a goal to sign on a minimum of 90 Intel employees with either a corporate responsibility function or role or as volunteers. We surpassed this goal by over 40%. We launched a sustainability training program with our external training provider, EARTH51 , with great feedback on tools and learnings that empower employees to take sustainability actions on their own. Employees on the network achieved over 40,000 tons of carbon offsets on the program which went into direct projects in developing countries. Our “Learn, Act, Transform” RISE engagement model helps employees understand Intel’s corporate respon - sibility issues and priorities, take action and apply their engineering skills in support of our goals, and further integrate corporate responsibility practices into their teams’ work objectives. “ At Intel we tackle hard problems, think boldly, and create technology that improves the life of every person on the planet. Our culture unleashes the diverse perspectives, experiences, and potential of our employees to drive innovation and business results for Intel and our customers.” —Christy Pambianchi, Executive Vice President and Chief People Officer Introduction Responsible Inclusive Sustainable Enabling Appendix Our Business
24 intel.com/responsibility 2021-22 Corporate Responsibility Report Governance, Ethics, and Public Policy Embedding Corporate Responsibility We believe having an integrated strategy and embedding corporate responsibility across the company is the most effective management approach to drive continuous improvements in our performance. We have established cross-functional Management Review Committees (MRCs) of senior executives who manage corporate responsibility and sustainability activities across the organization. Our global Corporate Responsibility Office acts as an internal adviser to drive strategic alignment and incorporate external stakeholder input into decisions and processes, for example, development of the 2030 corporate responsibility strategy and goals. Many Intel business groups have established teams dedicated to corporate responsibility issues. Read more about the oversight and management of all areas of Corporate Responsibility in each section of this report and on the Report Builder website. We have developed corporate guidelines and policies that take into account the concept of shared value and frameworks such as the UN Global Compact, International Labour Standards , OECD Guidelines for Multinational Enterprises , and the UN Sustainable Development Goals . Linking Compensation to Corporate Responsibility Factors Since 2008, we have linked a portion of our executive and employee compensation to corporate responsibility factors in our Annual Performance Bonus (APB). In 2021, we included environmental, social, and governance (ESG) metrics aligned with our culture transformation and 2030 RISE goals, including diversity and inclusion, employee experience, climate change, and water stewardship. In 2022, we set out new metrics in these same areas. For more detail, see our 2022 Proxy Statement and the Sustainable and Inclusive sections of this report. Integrated Investor Outreach During 2021, our integrated outreach team, led by our Investor Relations group, Corporate Responsibility office, Human Resources, and Corporate Secretary’s office—and including representatives from other business groups—met in Fall 2021 to discuss a wide range of issues, including ESG topics, with investors representing approximately 37% of our outstanding shares. We believe that our approach to engaging openly and year-round with our investors regarding ESG issues drives increased corporate accountability, improves decision making, and ultimately creates long-term value. The feedback we receive through our investor outreach activities is communicated to Intel's Board of Directors and relevant committees throughout the year. In response to investor feedback, we further integrated ESG information into our 2021 Annual Report on Form 10-K , 2022 Proxy Statement , and Investor Relations website; expanded disclosure on culture, human capital management, and climate risk; the Board increased its focus on additional risks areas such as macroeconomic political, events such as natural disasters and public health crises and business specific such as human capital risks. We further aligned our disclosure with external reporting frameworks such as the Sustainability Accounting Standards Board , Task Force on Climate- related Financial Disclosures and other reporting frameworks. Integrated Value Framework Risk Management Operations Brand Revenue License to Operate and Governance • Regulatory risk (e.g., environmental) • Community engagement • Supply chain Cost Savings and Continuous Improvements • Operational efficiency • Management quality • Employee engagement Reputation and Goodwill • Differentiation • Trusted partner • Goodwill Growth and Innovation • Market expansion • Product innovation • New customer needs Embedding corporate responsibility and sustainability into our business and decision-making creates value for Intel in four main ways. It helps us: reduce risk and protect our license to operate, improve the efficiency and effectiveness of our operations, protect and build brand value, and drive revenue growth through innovation and identification of market opportunities. Intel Guidelines and Policies on Strategic Corporate Responsibility Issues: Intel Values Intel Code of Conduct Intel Global Human Rights Principles Combating Modern Slavery and Ensuring Transparent Supply Chains Intel RBA Commitment Letter Intel EHS Policy Intel Climate Change Policy Statement Intel Global Water Policy Intel Political Accountability Guidelines Intel Responsible Minerals Sourcing Policy Intel Corporate Accessibility Policy Intel Product Content Declaration for REACH Intel Quality Policy Intel’s Support of the UN Sustainable Development Goals Access documents at intel.com/responsibility . Introduction Responsible Inclusive Sustainable Enabling Appendix Our Business
25 intel.com/responsibility 2021-22 Corporate Responsibility Report Board Oversight of ESG We established formal Board-level oversight for corporate responsibility in 2003. The Board’s Corporate Governance and Nominating (CGN) Committee has primary responsibility for oversight of ESG issues at Intel, with additional topics also reviewed by other committees (e.g., the Compensation Committee is responsible for oversight of human capital issues, and the Audit and Finance Committee is responsible for oversight of our ethics and compliance program). Management provides formal updates to the CGN Committee at least twice each year and at least annually to the full Board on the company’s ESG performance and disclosure. In 2021, this included review of the annual Corporate Responsibility Report and updates on issues including environmental sustainability, climate risk, human capital, human rights, political accountability, and investor outreach and feedback. A number of directors have expertise on key ESG issues and as part of every Board search, our Board is committed to actively seeking women and minority candidates, as well as candidates with diverse backgrounds, experiences, and skills—see page 35 of our 2022 Proxy Statement for details. During 2021, the Board retained and paid fees to third-party search firms. The Corporate Governance and Nominating Committee specifically requested that the search firms work with organizations focused on sourcing candidates of different races, ethnicities, genders, and sexual orientations. Since 2018, Intel has been a member of the Thirty Percent Coalition , which focuses on strategies to increase gender, racial and ethnic diversity on corpo - rate boards. One of the Board’s functions is the oversight of risk management, which includes ESG-related risks. The Board receives periodic briefing and informational sessions by management on the types of risks the company faces and enterprise risk management. Management is responsible for identifying risk and risk controls related to significant business activities; mapping the risks to company strategy; and developing programs and recommendations to determine the suffi - ciency of risk identification, the balance of potential risk to potential reward, and appropriate ways to control risk. A full description of the Board’s responsibilities, skills, experience, director biographies, compensation practices, commitment to diversity, and oversight of risk manage - ment are available in our 2022 Proxy Statement . Ethics and Compliance Each year, our CEO communicates with all employees and managers about the importance of ethics and legal compliance, including regular reminders on our strong commitment to always act with integrity. This “tone from the top”—reiterated by our senior leadership and proliferated in our corporate required annual ethics and compliance training, regular communications through - out the year, company-wide ethics culture surveys, awareness trainings, annual ethics and compliance summits, and educational resources—helps to create and maintain an ethical and legally compliant culture. We maintain a robust process for reporting misconduct, and employees are encouraged to raise questions and concerns and to ask questions about policies or proce - dures without fear of retaliation. We maintain multiple channels for employees and others to report concerns, including reporting anonymously, as permitted by appli - cable law around the world. The anonymous reporting channel consists of an Integrity Line through which anyone can report alleged misconduct via messaging or an online reporting tool managed by an independent third party. We inform employees, managers, and other stakeholders about Intel’s non-retaliation policy, which prohibits retaliation against anyone who, in good faith, reports a concern or participates in an investigation. The Board and senior management receive periodic reports of statistics related to misconduct, as well as details about key investigations. Our Ethics and Compliance Business Champions encourage employees to stay current with their ethics and compliance training, review verified investigations quarterly with business group leaders, and raise employee awareness regarding how to report concerns. In 2021, the largest categories of verified cases involved falsification of documents, conflicts of interest, and compliance items. Consistent concerns are addressed through senior management discussions, employee communications, process and controls improvements, and individual corrective action measures, where appropriate. Each quarter, Intel’s Ethics and Compliance Oversight Committee (ECOC) receives formal reports from various Intel organizations and reviews risk topics that span business groups. The Intel Code of Conduct In 2022, we published an updated Intel Code of Conduct along with a description of the significant changes to the Code. The Code affirms the principles that guide the behavior of employees, subsidiaries, members of our Board of Directors regarding their Intel-related activities, indepen - dent contractors, consultants, suppliers, and others who do business with Intel. Through the Code, which is available in 13 languages, we seek to promote honest and ethical conduct, deter wrongdoing, and support compliance with applicable laws and regulations. We also communicate our ethical expectations, including compliance with our Code principles and policies, to our suppliers and third parties. All employees are expected to complete annual online training, through which they also certify adherence to the Code. Instruction-led training is also provided to Intel executives. In addition, a targeted population completes an annual disclosure process to monitor compliance with the Code. Depending on their roles and geographic locations, certain employees are assigned more in-depth ethics and compliance training on topics such as anti-corruption, import-export compliance, insider trading, conflicts of interest, and antitrust. In 2021, 99% of our employees took Code of Conduct training, 98% received training on informa - tion security awareness,94% took training on harassment avoidance (includes all the regional harassment courses), and 97% took training on anti-corruption. Approximately 99% of our workforce received additional training on other topics such as antitrust awareness. Introduction Responsible Inclusive Sustainable Enabling Appendix Our Business
26 intel.com/responsibility 2021-22 Corporate Responsibility Report Public Policy and Political Accountability Intel works with governments, organizations, and industries around the world to advocate for policies that encourage new ideas, promote fair commerce, and protect resources. We also work to educate political candidates about the implications of public policy decisions for our business, and in the US provide financial support to candidates who hold positions consistent with our business objectives. We work to make our priorities and positions on key issues clear by including information on our Public Policy website , publicly supporting amicus briefs, or submitting testimony. In 2021, we published statements on our Public Policy blog covering a range of issues important to our business and industry, including US federal investment in the domestic semiconductor manufac - turing industry; regulation that enables the effective adoption and deployment of AI, 5G, and other emerging technologies such as autonomous vehicles; diversity and inclusion; climate change; data privacy; tax policy; and healthcare. Global Social Equity Policy Principles The Intel Global Social Equity Policy Principles guide our work with governments and organizations to build a more equitable world and advance legislation to combat systemic inequities impacting employees and communities globally. Included are regulation and policies in the areas of economic, education, digital, health, justice, environmental, and civic equity. We also advocate for initiatives that expand access to technology , including broadband. Our advocacy and public support of legislation in line with our commitment to social equity in the US has included The Justice in Policing Act , US Equality Act , US Hate Crimes Act , Providing Resources and Organization to Maximize Opportunities for Training and Education in STEM (PROMOTES) Act , and the #StopAsianHate campaign. In support of civic equity, we joined the Civic Alliance and the Business for Voting Rights campaign. To advance our social equity goals and increase inclusion in the legal and policy fields, in February 2021, we announced a donation of $5 million over a five-year period to North Carolina Central University (NCCU), a historically Black college or university (HBCU), to create a new tech law and policy center. According to the American Bar Association, about 5% of lawyers in the US were Black as of 2020. Additionally, 80% of Black judges and 50% of Black lawyers come from HBCUs, 1 making these schools critical to diversifying legal and policy professions and ensuring greater opportunity to underrepresented demographics. Intel will also provide legal and strategic expertise, faculty training, summer internships, and Intel mentors to NCCU students and faculty members. We engage with trade associations to help us work collab - oratively with other companies and groups to address key public policy issues on a range of corporate responsibility and sustainability issues. Recent examples include: • Social equity: Working as a member of the Business Roundtable to advance action on racial and social justice issues in the US. • Climate change: Collaborating with the Center for Climate and Energy Solutions to encourage climate action. • Responsible Supply Chain: Partnering with the Responsible Business Alliance (RBA), Responsible Minerals Initiative (RMI), Responsible Labor Initiative (RLI) and other stakeholders to educate policymakers on the benefits of collective action on responsible global supply chain practices. Watch the video . • Sustainable Corporate Governance: Working with the RBA, Digital Europe , and other stakeholders to improve the knowledge and understanding of poli - cymakers on the benefits of common approaches to responsible business conduct and to align future due diligence requirements with existing international frameworks. For more information, see “ Climate and Energy ,” “ Social Equity ,” and “ Responsible Minerals Sourcing .” In 2022, for the 12th year, Ethisphere Institute named Intel to its annual list of the World’s Most Ethical Companies. Digital Climate Alliance Together with other technology companies, we continued our 2020 commitment to the Digital Climate Alliance to advance discussions with policymakers on the value and opportunity of the information and communications technology (ICT) “handprint,” or the ways in which technology can be applied to help reduce climate impact. The coalition has published a report highlighting opportunities for policymakers to harness digital technologies to accelerate environmental progress and advance decarbonization efforts across the buildings, industrial, and transportation sectors. 1 Source: How historically black colleges transformed America . Introduction Responsible Inclusive Sustainable Enabling Appendix Our Business
27 intel.com/responsibility 2021-22 Corporate Responsibility Report The Intel Political Accountability Guidelines outline our approach to making political contributions, including senior management and Board-level review processes and our commitment to transparency. Decisions on political contributions, whether from the Intel Political Action Committee (IPAC) or corporate funds, consider Intel’s business objectives, corporate policies, and the public policy priorities outlined on our Public Policy and Corporate Responsibility websites. We publish reports on our corporate contributions, IPAC contributions, and trade association membership dues on our Report Builder website. Direct Corporate Contributions. Intel makes relatively few direct political contributions using corporate funds, and has a policy of not making independent political expenditures or funding electioneering communications. Intel Political Action Committee. No corporate funds are contributed to IPAC other than for administrative purposes, and all employee participation in IPAC is voluntary. IPAC's approach targets balanced support of Democratic and Republican candidates each cycle. Industry and Trade Associations. We disclose trade association membership dues and payments to other tax-exempt organizations such as 501(c)(4) and 501(c)(6) organizations annually, including the reported portion of dues used for political purposes for annual dues over $50,000. Lobbying Expenses. Intel files quarterly reports with the Secretary of the US Senate and the Clerk of the US House of Representatives that detail our lobbying activities. These reports can be found in the Senate’s Lobbying Disclosure Act Database . In 2021, our reported lobbying expenditures totaled $4.1 million, compared to $3.6 million in 2020. We regularly evaluate our political spending for effective - ness and alignment as part of our contributions process. Decisions are made based on states and districts with a significant Intel presence and leadership on committees of jurisdiction on important Intel priorities. In response to stakeholder feedback, we have further enhanced our review process by adding reviews of public statements to better assess alignment with our values. When we identify some degree of misalignment, we communicate directly with contribution recipients. In cases of signifi - cant misalignment across our multiple key public policy issues, we take action to realign future funding decisions. Key Public Policy Issues Automotive and Transportation Customs and Trade Facilitation Digital Health Diversity and Inclusion Environment and Energy Global Trade Immigration Intellectual Property Privacy Security and Trust Spectrum Ta x More Information: Public Policy website and our P ublic Policy blog . 2021 Contributions Contribution Type Amount Corporate contributions, including state and local candidates, campaigns, and ballot propositions $216,000 Intel Political Action Committee contributions $396,000 Intel was named a “Trendsetter” company in the 2021 CPA-Zicklin Index of Corporate Political Disclosure and Accountability. Policy on Anti-Corruption Intel is committed to conducting business with integrity and adhering to applicable anti-corruption laws, including the US Foreign Corrupt Practices Act, the UK Bribery Act, and local anti-corruption laws in the locations where we do business. Our long-standing global anti-corruption program has robust governance mechanisms to ensure that our Policy on Anti-Corruption is followed by our employees and business partners, and that concerns are easily reported and quickly addressed. Introduction Responsible Inclusive Sustainable Enabling Appendix Our Business
28 intel.com/responsibility 2021-22 Corporate Responsibility Report Stakeholder Engagement We are committed to operating with transparency and, through open and direct communication, we work to develop trusted relationships with all stakeholders, including employees, customers, suppliers, governments, and communities. We maintain formal management systems—including neighbor relations managers for our major manufacturing sites—to engage with, listen to, and learn from our stakeholders and incorporate their input into our thinking and planning. In addition to face-to-face meetings, a number of online channels provide us with valuable, ongoing input on our performance and strategy. Our corporate responsibility e-mail account enables stakeholders to share their issues, concerns, and comments directly with members of our corporate responsibility team, who respond to hundreds of messages each year on a wide variety of topics. We also receive and respond to feedback through our CSR@ Intel blog, Exploreintel.com website , Facebook page , and @WeAreIntel Twitter account . Our corporate responsibility materiality 1 matrix below illustrates how we identify, prioritize, and take action surrounding the topics we believe are of greatest inter - est to our stakeholders regarding Intel’s environmental, social, and economic performance. Additional details on our stakeholder engagement practices and issues raised through the year are available on our Report Builder website. 1 “Materiality” refers to materiality within the context of our corporate responsibility program and priorities and does not refer to concepts of materiality used in securities or other applicable law. 2. Prioritize We review issues and consider both the potential impact on stakeholder decisions and the impact on Intel’s business and external systems. The issues listed in the matrix below were prioritized from more than 50 issues identified and reviewed during the process. 1. Identify We use a range of methods and inputs to identify priority topics and emerging issues from our stakeholders. Sources: • Corporate social responsibility and social media channels • ESG investor outreach meetings • Results of community advisory panels and surveys • Customer data requests and survey data • Employee open forums and surveys • Meetings with governments • Human rights impact assessment and ethics and compliance processes • Research on external standards, trends, and frameworks Stakeholder Review: Every two years, we engage a third party to update our materiality assessment. Our most recent update was completed in early 2021, building on the previous assessment that was used to inform the development of our 2030 strategy and goals. The latest assessment included review of industry best practices and reports, external reporting standards, analysis of issues identified through stakeholder dialogue during the year, and completion of interviews with internal and external stakeholders. We use this information to inform changes to our strategies, goals, and ongoing engagement and disclosure practices. 3. Take Action Impact on Stakeholder Decisions Impact on Intel’s Business and External Systems ( Internal stakeholders ) Low High Medium High Medium Corporate Responsibility Materiality Matrix Product Energy Efficiency Environmental Compliance Chemical & Hazardous Waste Management Anti-Competitive Behavior Responsible Product Use Climate Migration & Justice Remote Working Environmental Social Economic/Governance Supply Chain Responsibility Business Ethics Financial & Economic Growth Diversity, Inclusion, & Accessibility Climate & Energy Health & Safety Employee Retention & Talent Development Global Health Pandemics Migrant Worker Rights Supply Chain Distruption Ethical AI New Global Legislation Water Stewardship Data Privacy & Security Human Rights Product Quality & Safety Introduction Responsible Inclusive Sustainable Enabling Appendix Our Business
29 intel.com/responsibility 2021-22 Corporate Responsibility Report Respecting Human Rights Human rights are the fundamental rights, freedoms, and standards of treatment to which all people are entitled. Intel’s Global Human Rights Principles , adopted in 2009, formalize our commitment to respecting human rights; embody common principles laid out in multiple frame - works, including the UN Guiding Principles on Business and Human Rights ; and apply to all employees and contingent workers, including those in our subsidiaries. We are committed to maintaining and improving processes to avoid complicity in human rights violations related to our operations, supply chain, and products. We also look for opportunities to apply our technology to support the advancement of human rights. We have established an integrated approach to managing human rights across our business, including board-level oversight and the involvement of senior-level Manage - ment Review Committees. For example, our annual Combating Modern Slavery and Ensuring Transparent Supply Chains statement is discussed with our Board and signed by one of our directors. Our Corporate Responsibility Office manages our human rights program, and responsibility is also embedded across the company through a cross-Intel Human Rights Steering Committee and close partnerships with global teams that develop and implement policies and actions related to our human rights risks. In 2021, we added our human rights program to an annual Ethics and Legal Compliance review process, which resulted in increased visibility and awareness of human rights topics across the organization. Key learnings will help to drive further improvements. We also meet throughout the year with external stakeholders and experts on human rights to continue to inform and evolve our human rights policies and oversight processes. In 2021, we discussed human rights issues with our investors and NGOs. We also are a signatory to the UN Global Compact , a member of the Global Business Initiative on Human Rights , and a participant in the Centre for Sport and Human Rights and the Partnership on AI . Our Approach to Managing Human Rights Our Operations Our goal is to cultivate a safe, diverse, and respectful work environment where employees can thrive and innovate. See “ Employee Health, Safety, and Wellness ” in the Responsible section and “ Inclusive Workforce ” in the Inclusive section of this report for more detail. In 2021, we deployed a new, holistic human rights training course for employees to help raise their awareness about Intel's initiatives and ways they can take action in their roles to advance our human rights strategy. The course has received positive feedback from employees and we will continue to expand it. The Intel Environmental, Health, and Safety Policy guides us to “provide a safe and injury-free workplace” through our core safety programs and injury-reduction initiatives— not only for our employees, but also for contractors work - ing at our sites. In addition, our recently updated Global Water Policy reinforces our respect for the human right to water by helping us responsibly meet our operational needs as well as those of our communities. Our Supply Chain As a founding member of the Responsible Business Alliance (RBA), we hold our suppliers accountable to the same expectations we have for ourselves. Over the past decade, we have directly engaged with our suppliers to verify compliance and build capacity to address risks of forced and bonded labor and other human rights issues. We also engage with indirect suppliers through our programs on forced and bonded labor and responsible minerals. Our significant invest - ments of time and resources are aimed at influencing system-level, industry-wide improvements to protect and empower workers in the global electronics supply chain and to reduce community impacts. We continue our efforts to combat forced and bonded labor in our supply chain which includes prohibiting holding worker passports and charging workers fees to obtain employ - ment. Since 2014, we have remediated the return of over $25 million in fees to suppliers ’ workers. For more information, see “ Supply Chain Responsibility ” later in this section. Introduction Responsible Inclusive Sustainable Enabling Appendix Our Business
30 intel.com/responsibility 2021-22 Corporate Responsibility Report Our Products We have long been committed to respecting privacy and security related to the development and use of our products. We practice privacy and security by design and our Security Development Lifecycle (SDL) processes define actions, deliverables, and checkpoints aimed at integrating security and privacy protections into our products and services. Intel does not participate in any efforts to decrease security in technology and does not design back doors for access into our products. The Intel Privacy Notice outlines our general approach to managing personal data. In addition, we advocate for global policies and standards to protect privacy and data security. As the range of products and services we offer broadens and changes, we evaluate potential concerns about how technology products may be used to infringe on human rights. The challenges range from product misuse and limits on freedom of expression, to health and safety concerns that may arise from new technologies. We updated the Intel Global Human Rights Principles to clarify language regarding our expectations on product responsibility and human rights. We continuously improve our processes for operationalizing this work. Most Intel products are general-purpose computing products that can be incorporated into systems and applications and that are sold to end users by distribu - tors, system manufacturers, and others, and not directly by Intel. While we do not always know nor can we control what products our customers create or the applications end users may develop, we do not support or tolerate our products being used to violate human rights. When we become aware of a concern that Intel products are being used by a business partner in connection with abuses of human rights, we restrict or cease business with the third party until we have high confidence that our products are not being used to violate human rights. Salient Human Rights Risks Rights holders and relevant potential impacts Intel Employees Intel’s own global workforce, particularly those undertaking manufacturing activities Supply Chain Workers Labor conditions in raw materials sourcing, manufacturing in high-risk markets, and contract workers End Users/Data Subjects Product design considerations and unintended use/misuse of Intel’s products and services Community/Society Risks related to third parties, sponsorship partners, and contribution to broader societal changes Salient Risks Freedom from Slavery and of Movement Freedom of Expression Non-discrimination Right to a Clean, Healthy, and Sustainable Environment Right to Decent Work, Rest, and Leisure Right to Humanitarian and Treatment in Armed Conflict Right to Life and Security of Person Right to Peaceful Assembly and Association Right to Privacy The matrix is a high-level mapping of salient human rights risks within our value chain due to external environmental factors. See Intel’s Code of Conduct , Global Human Rights Principles , 2030 Corporate Responsibility Strategy and Goals , and other Corporate Responsibility policies for more information on Intel’s approach on various human rights and sustainability issues. For more detail, see our Salient Human Rights Risk mapping on the Report Builder website. Introduction Responsible Inclusive Sustainable Enabling Appendix Our Business
31 intel.com/responsibility 2021-22 Corporate Responsibility Report In 2021, our teams continued to implement Intel’s high-confidence human rights standard under the Intel Global Human Rights Principles . We leveraged the UN Guiding Principles and due diligence standards under US law and the laws and regulations that apply to our business globally. We also leveraged existing procedures and methods used in risk-based anti-corruption compliance and supply chain assessment, risk mitigation, training, and remedy processes to implement Intel’s product responsibility standard under the Intel Global Human Rights Principles. As a result, in 2021, while certain product sales to third- party entities met this standard, we continued to restrict other product sales based on the Intel Global Human Rights Principles . Human Rights Impact Assessments In 2016, we engaged a third party to conduct a human rights impact assessment (HRIA) to review our processes and validate our human rights risks. The HRIA confirmed that we were addressing our most salient human rights risks, and reaffirmed our need to assess potential risks associated with emerging technologies. In 2018, we conducted an additional internal AI and autonomous driving HRIA, including assessment of potential risks related to product misuse, algorithmic bias, algorithmic transparency, privacy infringement, limits on freedom of expression, and health and safety. In 2019, we continued development of new internal processes to advance responsible AI practices and ensure that AI lives up to its potential as a positive transformative force for the global economy, health, public safety, and industries such as transportation, agriculture, and healthcare. In 2020 and early 2021, we completed an updated third-party HRIA, involving multiple internal teams and interviews with external stakeholders. This HRIA resulted in the update of our salient human rights risks, including the addition of potential impacts in the areas of product responsibility and responsible AI. 2022 Human Rights Priorities • Continue to assess and strengthen the Intel Global Human Rights Principles , policies, due diligence processes, product responsibility governance, monitoring and employee training to continuously improve and leverage best practices. • Engage in additional stakeholder and industry dialogues regarding potential human rights issues related to emerging technologies, including responsible AI funding and collaboration with academic researchers and DARPA in the areas of privacy and security for machine learning. • Further expand our impact in responsible minerals and accelerate the creation of new sourcing standards. For more details, see “ Responsible Minerals Sourcing ” in the Responsible section of this report. • Continue our work to combat forced and bonded labor in the first and second tiers of our supply chain. We are committed to maintaining and improving processes to avoid complicity in human rights violations related to our operations, supply chain, and products. Responsible AI We can be a role model in our industry by ensuring that our AI development work is consistent with the Intel Global Human Rights Principles and that these principles guide our efforts to build a thriving AI business. We have identified and integrated six areas of ethical inquiry into our product development and project approval processes related to AI capabilities: human rights; human oversight; explainable use of AI; security, safety, and reliability; personal privacy; and equity and inclusion. In 2021, we evolved our governance policies and processes to guide Intel’s AI product development and business practices in the face of the ethical issues that may arise with certain AI applications. This includes further leveraging our Ethical Principles for AI Development, improving the usability of our Ethical AI impact assessment process, and expanding the resources, tools, and oversight to help project teams engage in meaningful inquiry of risks and mitigation strategies throughout the product lifecycle. As a result, we have seen increased participation in this process across all business units. We collaborated with Article One —a strategy and management consultancy with expertise in human rights, responsible innovation, and social impact—to deploy a workshop to educate developers and integrate ethical considerations even more deeply across Intel. We also collaborated with Partnership on AI on multiple initiatives, including AI and shared prosperity, responsible sourcing of data enrichment services, and improving inclusion in AI development. In addition, we have collaborated in the areas of privacy and security for machine learning with DARPA, the University of Pennsylvania, the Private AI Center , the National Science Foundation, and the Stanford Center for AI Safety. We continued to leverage and grow our multi-disciplinary cross-Intel Responsible AI Advisory Council. The council addresses potential issues such protecting privacy while collecting and using data to train AI systems, reducing the risk of harmful bias in AI systems, and building trust in machine learning applications by helping people to better understand them. Introduction Responsible Inclusive Sustainable Enabling Appendix Our Business
32 intel.com/responsibility 2021-22 Corporate Responsibility Report Supply Chain Responsibility We actively manage our supply chain to help reduce risk, improve product quality, achieve environmental and social goals, and improve overall performance for Intel, our customers, and our suppliers. To drive responsible and sustainable practices, we have robust programs to educate and engage suppliers that support our manufacturing operations. We collaborate with other companies and lead initiatives on key issues such as improving transparency around climate and water impacts in the global electronics supply chain and, as part of our RISE strategy, we are advancing industry collaboration on responsible minerals sourcing. Through these efforts we help set electronics industry-wide stan - dards, develop audit processes, and conduct training. More than 9,000 tier 1 1 suppliers in 87 countries provide direct materials for our production processes, intellectual property, tools and machines for our factories, logistics and packaging services, software, office materials, and travel services for Intel. We also rely on others to man - ufacture, assemble, and test some of our components and products. See a list of our Top 100 Production and Service Suppliers , in the Appendix. We continue to collaborate extensively with supply chain-related organizations—including the Responsible Business Alliance (RBA) and its Responsible Minerals Initiative and Responsible Labor Initiative , the Semicon - ductor Industry Association , and SEMI —to help set electronics industry-wide standards, develop audit processes, conduct training, address third-party anti-corruption issues, and more. We expect our suppliers and their suppliers to comply with the Intel Code of Conduct , Intel’s Supplier policies, and the RBA Code of Conduct ( RBA Code ). The RBA Code describes industry environmental, social, and ethical standards, and is consistent with the Intel Global Human Rights Principles , the Intel Statement on Combating Modern Slavery , and the UN Guiding Principles on Business and Human Rights . For more, read our RBA Commitment Letter . We also expect and enable our suppliers to develop their own corporate responsibility strategies, policies, and processes; set goals and report on their perfor - mance; engage with and audit their own suppliers; and develop, manage, and regularly test their business continuity plans. In 2021, we continued to review ongoing COVID-19 and supply chain challenges through our Supply Chain Command Center. Our supplier development, monitoring, and enforcement efforts are integrated across our commodity teams. This integration allows us to scale our coverage, support supplier progress, and influence suppliers that may be reluctant to meet our requirements. We communicate our expectations in our supplier contracts and request- for-proposal documents, on our supplier website , at meetings and training events, and in annual letters to suppliers . We hold ourselves accountable to meet or exceed the same standards that we set for our suppliers, and audit ourselves to the same protocols. Every year we complete the RBA Self-Assessment Questionnaire (SAQ) and publish the results on our corporate website. We follow the RBA Validated Assessment Program (VAP) to conduct audits of our finished goods factories. In 2021, we conducted an RBA VAP audit of our facilities in Kulim, Malaysia and addressed all findings. In 2022, we plan to have RBA audits of our facilities in Vietnam and Costa Rica. Strengthening Supplier Capabilities For more than a decade, we have worked to help less mature and evolving suppliers build critical sustainability and corporate responsibility acumen, including a focus on compliance with the RBA and our Code of Conduct expectations and requirements. We have delivered a broad range of no-cost support options for suppliers, including online resources, interactive training sessions, and connection to external resources such as the RBA and other NGO training and conferences. Safety Programs. We set high safety training and performance expectations during our contracting process and orientation for new suppliers. We validate that suppliers have robust safety management systems and employee safety training programs in place, and evaluate supplier safety performance for compliance with the American National Standards Institute (ANSI) standards, OSHA regulations, and Intel’s minimum safety requirements. In 2021, we partnered with more than 50 suppliers to elevate their safety management systems to ensure safe work practices at Intel sites. In addition, we worked with 43 suppliers to close 131 occupational health and safety audit findings and improve worker conditions in their factories. Beyond our core capability-building offerings, we have long engaged with supply chain sustainability consul - tants to offer suppliers training and programs focused on topics like work-hours management, occupational health and safety, environmental issues, and prevention of forced and bonded labor. 1 Tier 1 suppliers are companies from which Intel makes direct purchases. Among Intel’s 9,000+ tier 1 suppliers, we identify approximately 400 “critical” suppliers that we directly engage through our capability-building programs. These suppliers represent more than 75% of our spends. Beyond this, we engage with critical tier 2 suppliers through our programs on forced and bonded labor, responsible minerals, and supplier diversity. Tier 2 suppliers are companies from which Intel’s tier 1 suppliers make direct purchases. Europe, Middle East, Africa Americas Asia Pacific 46% 28% 26% 2021 Suppliers by Region Introduction Responsible Inclusive Sustainable Enabling Appendix Our Business
33 intel.com/responsibility 2021-22 Corporate Responsibility Report Supplier Diversity and Inclusion We are making solid progress on our accelerated commitment to a diverse and inclusive supply chain and our 2030 RISE goal to double annual spending with diverse suppliers 2 to $2 billion. For more details, see “ Supplier Diversity and Inclusion ” in the Inclusive section of this report. Advancing Supplier Leadership and Accountability We have established several programs to advance our supplier leadership and accountability, as well as ensure the latest information is made available through education and collaboration. Supplier Program to Accelerate Responsibility and Commitment (SPARC). This initiative is designed to help our SPARC suppliers build internal capacity around corporate responsibility through rigorous annual commitments to compliance, transparency, and capability-building. We have increased the number of suppliers required to participate in SPARC over the past eight years as we have broadened our scope to include additional programs and requirements. This increase represents suppliers selected using our risk- based approach and those providing critical materials and services to Intel. Participating suppliers represented over 78% of Intel’s managed supply chain spends in 2021. We continue to raise expectations for our suppliers and expand requirements to encompass a broader set of focus areas. In 2022 we will set the stage for growing environmental concerns and regulations, addressing current global initiatives. Total Audits Conducted Type of Audit 2017 2018 2019 2020 2021 RBA VAP Audits 66 108 112 88 140 Intel RBA-Based Target Audits 52 54 42 38 17 Intel Quality Audits with Sustainability Element 52 59 53 – – Total Audits Conducted 3 170 221 207 126 157 Applying our risk-based approach, we continue to use the RBA program as the industry standard for our validated audits for manufacturing suppliers. In addition, we apply the risk-based criteria to complete targeted assessments of our non-manufacturing suppliers. Our sustainability criteria have also been embedded into our supplier quality assessment process to further extend our reach into the supply chain. For priority and major findings by category and sub-category, visit the Report Builder . In certain circumstances, the same facility may be audited multiple times in a calendar year. We treat each individual audit of a single facility as a unique audit in the above table. Despite continued challenges due to COVID-19, in 2021, over 157 audits were conducted across 89 suppliers. Audits that were planned in 2021 but not executed due to COVID-19 restrictions and still deemed necessary are included in our 2022 plan. Cumulatively, 627 supplier sites had received audits by the end of 2021. 3 Previous years’ figures are updated to reflect the most current information as new audit data becomes available. Supplier Report Card (SRC). We have a regular review and scoring process for our SRC to grade suppliers for product availability, cost, quality, sustainability (ethics, supplier diversity, and environmental and human rights performance), security, safety, technology, and customer satisfaction. These processes allow for executive-level dialogue on past and future performance, and remind suppliers of our expectations. Assessments and Audits. Supplier assessments and audits cover more than 300 environmental, safety, and human rights factors, and help us determine a supplier’s risk profile. The audits, conducted by a mix of third parties and Intel personnel, follow the RBA VAP and help us identify where immediate action is needed and where longer term, corrective “targeted action plans” should be put in place. In 2021, 35% of the combined RBA audits were follow-up or closure audits to verify whether the findings from a previous audit had been addressed. We strive to audit 100% of high-risk supplier sites within a two-year cycle. We have instituted a process of unannounced audits to follow up on credible reports of non-compliance, but we did not need to conduct any such audits in 2021. Targeted Action Plans. When a supplier does not make sufficient progress in addressing audit findings or has particularly egregious issues, we work with the supplier to quickly develop and implement a strong corrective action plan. Supplier progress is reviewed quarterly until we have verified that all key issues have been closed, and that processes have been put in place to prevent recur - rence. If satisfactory progress is not made, we may take additional action, such as not awarding new business (“conditional use” status) until issues are resolved or— when necessary—ending the supplier relationship. While complete closure of some issues can take several years, we work to close egregious issues within 30 days. We help suppliers with targeted action plans make progress in multiple ways. Our actions may include conducting additional reviews, such as unannounced audits, and increasing the frequency of contact between Intel executives and supplier senior management. 2 We recognize diverse suppliers as businesses that are 51% owned and operated by at least one of the following: women; minorities as defined by the country or region where the business was established; veterans/service-disabled veterans; persons who are lesbian, gay, bisexual, or transgender; or persons who are disabled. While Intel recognizes these categories, they may vary in accordance with local law. Introduction Responsible Inclusive Sustainable Enabling Appendix Our Business
34 intel.com/responsibility 2021-22 Corporate Responsibility Report Recognizing and Rewarding Performance We provide regular feedback to suppliers on their overall progress and achievements, and integrate corporate responsibility considerations into our Excellence, Partnership, Inclusion, and Continuous Improvement (EPIC) program. EPIC recognizes suppliers that have demonstrated outstanding, distinguished, and valued performance. For more information and a list of recently recognized suppliers, visit our Top 100 Production and Service Suppliers in the Appendix of this report. Supplier Environmental Impact We partner with our suppliers to decrease their waste generated, water usage, and greenhouse gas emissions, and thereby reduce our own environmental impact, lower supply chain risk, and can decrease costs. We also partner with our tier 1 chemical and gas suppliers on green chemistry initiatives. Our procurement teams work with our logistics and packaging suppliers to drive changes in the materials we use to ship products. Reducing Greenhouse Gas Emissions and Water Use We decrease the greenhouse gas emissions related to our transportation and logistics network by optimizing packaging to reduce the quantity and weight of ship - ments, and by increasing local sourcing. Intel is at the forefront of standardizing transportation emissions reporting within the industry through collaboration with organizations such as the Global Logistics Emissions Council . In 2021, we asked approximately 116 tier 1 suppliers that have higher environmental impacts to submit data on their own carbon footprints through the CDP Supply Chain Climate Change Questionnaire. Of those suppliers, 99% submitted the questionnaire, and 92% of them made their responses public, giving both Intel and other stakeholders information about the environmental performance of our supply chain. Using information provided in our suppliers’ CDP Climate Change Questionnaire helps us ensure that we are focusing on the largest climate change impacts. We also sent the CDP water questionnaire to 52 suppliers that are located in water-stressed regions. We achieved a 98% response rate, with 94% of the 52 suppliers publicly sharing their responses. As a result of our efforts, we were recognized in the CDP Supplier Engagement Leaderboard for the fifth consecutive year. For more information, see the Sustainable section of this report. A Risk-Based Approach to Supplier Assessments New Supplier Assessment: A short survey is sent to new suppliers to determine whether a facility is of potential high risk. We work with suppliers during the on-boarding process to remedy any issues identified. Self-Assessment: Critical and high-risk suppliers 4 complete a questionnaire to determine a facility’s potential gaps to the RBA Code. In 2021, we assessed 374 supplier facilities based on this risk assessment and past performance, a 92% increase from 2020. 71% of these assessments were managed through the RBA tools and 29% were managed with Intel-specific tools while using the RBA Code of Conduct as the basis for conformance. Audit: Higher risk suppliers must undergo either an on- site audit by qualified third-party auditors who use the RBA VAP , or a qualified Intel auditor. The latter audits are specialized according to risk and compliance concerns for a particular supplier or facility. Lower risk suppliers, 5 as determined by the self-assessment, may also be audited at our determination. What we learn from audits helps inform our supplier engagement and capability- building programs. Training/Attestation: In 2021, as part of our progress toward 2030 goals, we began requiring lower risk suppliers to complete training classes through the RBA eLearning Academy. The curriculum instructed the companies on human rights principles of the RBA Code of Conduct and their obligation to abide by the RBA Code. 79 suppliers completed this curriculum in 2021. 4 “Critical suppliers” represent a subset of all tier 1 suppliers with which we have significant business relationships and spends. “High/er risk suppliers” refers to suppliers deemed above average risk, based on data and supplier performance. 5 “Lower risk suppliers” refers to suppliers deemed below average risk, based on data and supplier performance. Introduction Responsible Inclusive Sustainable Enabling Appendix Our Business
35 2021-22 Corporate Responsibility Report Responsible We are building on our long history as a leader in corporate citizenship to further advance safety, wellness, and responsible business practices across our global manufacturing operations, our value chain, and beyond. This includes our strong focus on employee health, safety, and wellness, and our work to advance human rights and to scale responsible minerals sourcing practices across our supply chain and industry. We are also collaborating with others to revolutionize how technology can improve health and safety through strategic healthcare, manufacturing, and transportation technology initiatives. This year’s highlights 41 employees earn safety honors Through the Intel Safety Always-Safety Star program, we honored 41 employees for their work to advance Intel’s safety culture—including improving office ergonomics, developing custom tools and equipment to reduce maintenance ergonomics risks, and providing safety coaching and communications. $25 million in fees remediated To ensure the protection of human rights in the work place, we set expectations with our suppliers that workers should not have to pay for their employment. As a result, we have remediated the return of over $25 million in fees to suppliers’ workers since 2014. 100 million+ safer vehicles on the road to autonomous To date, Mobileye has deployed more than 100 million EyeQ® chips to help keep vehicles—and their drivers and passengers—safer on the road through driving assistance systems. Moving forward, we expect our Responsibility-Sensitive Safety (RSS) model to make autonomous vehicle safety enhancements even greater and more ubiquitous. intel.com/responsibility Introduction Our Business Inclusive Sustainable Enabling Appendix Responsible
36 2021-22 Corporate Responsibility Report Responsible: Our Approach For more than a decade, we have directly engaged with our suppliers to ensure compliance with our corporate responsibility expectations and build capacity to address risks of forced and bonded labor and other human rights issues. Our 2030 goals signifi - cantly expand the number of suppliers covered by our engagement activities to deepen accountability for human rights throughout our global supply chain. We are also leading technology industry initiatives to further advance responsible practices in minerals sourcing and responsible mobility. The impacts of all of the efforts will have even greater reach as we execute our IDM 2.0 strategy and continue to grow globally. We continue to apply our expertise and resources to fur - ther enable others to harness the power of technology to improve health, safety, and well-being. This includes working with the healthcare industry to accelerate critical research and improve healthcare access and affordability; applying technology to build smart and safer workplaces and factories and reduce injuries; and expanding the use of technology in transportation to advance safety and transform personal mobility and access. Through our 2030 goals and IDM2.0 strategy, we will continue to take actions to deepen our focus on maintaining and building a robust safety culture as our business continues to change and grow, and to expand the global impact of our wellness programs. 2030 RISE: Responsible Goals, Initiatives, and Global Challenges Global Challenge: Revolutionize health and safety through technology. Technology Industry Initiatives: Responsible Minerals. Expand our efforts beyond conflict minerals 1 to cover all minerals used in semicon - ductor manufacturing and apply the learnings to lead our industry in creating new sourcing standards. Responsible Mobility. Collaborate with our industry and ecosystem partners to advance the adoption of technology-neutral safety standards to reduce traffic accidents globally. Operational and Supply Chain Goals: Employee Health, Safety, and Wellness. Ensure that more than 90% of our employees believe that Intel has a strong safety culture, and 50% participate in our global corporate wellness program. Supply Chain Human Rights. Scale our supplier responsibility programs to ensure respect for human rights across 100% of our tier 1 contracted suppliers and higher risk tier 2 suppliers. 1 Conflict minerals, as defined by the US Securities and Exchange Commission (SEC), is a broad term that means tin, tantalum, tungsten, and gold (3TG), regardless of whether these minerals finance conflict in the Democratic Republic of the Congo (DRC) or adjoining countries. Introduction Our Business Inclusive Sustainable Enabling Appendix Responsible intel.com/responsibility
37 2021-22 Corporate Responsibility Report Employee Health, Safety, and Wellness We continue to invest in health, safety, and wellness programs to help employees enjoy a better quality of life and contribute to Intel’s success. Throughout our response to COVID-19, our priority has been to protect our essential workers who have worked on site, as well as our employees working remotely. Our Global Environmental, Health, and Safety Policy defines our commitment to provide a safe and injury-free workplace for all our employees, contractors, customers, partners, and the public. We recognize the importance of environmental, health, and safety (EHS) to our business success and we constantly work to assess and improve our EHS management system, standards, culture performance, early intervention, and injury-reduction initiatives. Since 2001, we have maintained a multi-site certification to the internationally recognized ISO 14001 and ISO 45001 standards to ensure that our manufacturing sites sustain a comprehensive, fully integrated EHS management system. In 2021, inde - pendent third-party virtual audits were conducted to maintain this certification. For information on our EHS assurance program, see “ Environmental Management ” in the Sustainable section of this report. For the past two years, Intel’s Pandemic Leadership Team (PLT) has led our response to the COVID-19 pandemic, pivoting quickly and ethically to deal with ever-changing government restrictions and require - ments in the 50-plus countries and regions where Intel operates. From virus variants, case expansions, govern - mental restrictions, and vaccination requirements, the PLT has helped keep Intel's employees and contingent workers safe, healthy, and productive, whether they are working on site or remotely. In 2021, Intel implemented global clinics that delivered vaccinations to more than 60,000 employees, contingent workers, and their household members. As we expand manufacturing operations in support of Intel’s IDM 2.0 strategy, we will continue to implement world-class EHS programs to care for people and the planet—from the development of our products through our manufacturing and supply chain. Advancing accountability and improving performance across our supply chain creates value for Intel and our customers by helping us reduce risks, improve product quality, and achieve environmental and social goals. For more information, see “ Supply Chain Responsibility ” in the Our Business section of this report. Health and safety training creates awareness and enables our employees to better understand their safety responsibilities. Our training system covers information needed for specific jobs (such as electrical safety, ergo - nomics, control of hazardous materials, and chemical safety) in different languages, and includes web-based, instructor-led, and on-the-job training, and innovative learning methodologies such as virtual and augmented reality. We launched an EHS training tracker in 2021 to support both compliance and risk reduction. In 2021, our manufacturing, supply chain, and technology development organizations introduced quarterly, trackable manager “Safety TALKs“ to encourage proactive one-on-one discussions between managers and employees on various safety topics. We also began requiring all employees to complete “Safety Always“ training to boost safety awareness across the company. In addition, we implemented a new requirement for all non-factory employees to complete “Office Ergonomics“ training to build awareness of office ergonomic risks, proper ergonomic workstation set-up, and ergonomic services available. We tracked completion of both classes as a 2021 safety leading indicator, and reported strong performance at 98% and 94%, respectively. During 2021, EHS partnered with our Corporate Services and Global Supply Chain organizations to research and recommend chairs and desks for employees working remotely, and provided a portal to enable easy ordering of ergonomically approved equipment worldwide. In addition, we developed a one-stop Future of Work ergonomics site to provide easy employee access to all key ergonomic services and reporting information. We achieved an EHS training milestone in 2021, with an all- time-high 555,000 EHS training hours completed. Introduction Our Business Inclusive Sustainable Enabling Appendix Responsible intel.com/responsibility
38 2021-22 Corporate Responsibility Report Recognizing that early intervention is critical for good ergonomic health and the prevention of injuries, in 2021, we piloted a proactive employee concierge program called Ergo+, which provides employees with one-on-one advice and proactive ergonomic assessments to help address both remote and in-office setups. Ergo+ includes an easy online tool for employees to sign up for initial consultations and follow-up assessments. The pilot resulted in an increase in employee reporting of intermittent discomfort or concerns, and 90% of those surveyed reported that they would recommend the program to a friend. We plan to expand the program globally in 2022. We also continued to expand our year-round multimedia Safety Always employee awareness campaign. In 2021, we organized our first virtual global safety week, which included multiple, well-received internal and external speakers. The cam - paign also included regular, widely read employee communications on topics such as reporting, ergonomics, and situational safety. Intel ended 2021 with an Occupational Safety and Health Administration (OSHA) recordable rate of 0.93 per 100 employees, compared to the most recently published US semiconductor industry average recordable rate of 0.70 in 2020. 1 Our days away case rate 2 was 0.2 in 2021, compared to the semiconductor industry average of 0.2 in 2020. Ergonomic-related or cumulative trauma disorders (CTDs) remained the most prevalent type of injury experienced at Intel in 2021, accounting for 65% of all reports, followed by strains/sprains. Office ergonomic injuries (predominantly from employees working from home) and COVID-19 cases accounted for the Intel recordable rate increase we observed in 2021 compared to 2020. We had one employee fatality in 2021. There were 31 high-consequence injuries during 2021, with 32% CTD injuries and 32% strain/sprain injuries. We have integrated learnings into our 2022 ergonomics program's early intervention focus plans. In 2021, we expanded the Intel® Vitality program—previously available to employees in the US, United Kingdom, and Vietnam—to Malaysia and Poland. The program focuses on four pillars of wellness: mindset, nutrition, movement, and recovery. Throughout the year, we continued to offer all of our wellness programming virtually, but in some locations, we were also able to bring back in-person wellness services. In 2021, we offered 19,552 virtual Intel Vitality sessions, with a total of 74,810 participants, including 19,320 unique individuals. Participants reported a 95% satisfaction rating with the program. We also continued our global employee access to Headspace , a mindfulness application. Over the course of the year, 18,506 employees used Headspace an average of four sessions per week. Recognizing Safety Achievement Through our Safety Always-Safety Star program, we are proud to recognize employees who exemplify our safety value every day in all they do. Each Safety Star is passionate about main - taining our strong safety culture, serves as a role model, and goes above and beyond to make Intel a safe place. During Global Safety Day in April, the honorees were recognized individually or as part of a team, selected from 124 individual and team nominations received globally. Winners contributed to office ergonomic support, developed safety management processes, addressed site safety, helped mitigate the impact of COVID-19, and provided safety coaching and communications. 1 Source Bureau of Labor Statistics. 2020 indicators are available at https://www.bls.gov/web/osh/ summ1_00.htm . 2 Days away begins the day after the accident. Introduction Our Business Inclusive Sustainable Enabling Appendix Responsible intel.com/responsibility
39 2021-22 Corporate Responsibility Report Intel’s mental wellness strategy is designed to raise awareness of the importance of mental health, cultivate an accepting culture so employees feel safe, and remove barriers to make it easier for our employees and their family members to access and receive care. In response to the pandemic and other difficult events this year, we encouraged utilization of existing mental health resources, including the Intel Employee Assistance Program, which provides confidential counseling and work-life services to employees and their immediate family members. We also launched a digital mental wellness platform to over 75,000 employees to enable easy access to one-on-one coaching, guided medi - tations, therapy, and more. In conjunction with World Mental Health Day in October 2021, we planned Intel’s first Global Mental Wellness week. The event encour - aged employees to invest in themselves, and activities included four speakers, 22 webinars, and other activities. More than 10,000 employees participated. Additional mental wellness events are underway in 2022. 2030 Goal: Employee Safety and Wellness Description. Ensure that more than 90% of our employees believe that Intel has a strong safety culture, and achieve 50% participation in our global corporate wellness program. Baseline. At the start of 2020: (1) 37% of Intel employees (primarily in our manufacturing operations) had the opportunity to provide feedback in our EHS Safety Culture Survey, reporting a baseline average of 79% on “safety is a value“ metrics; and (2) 22% of Intel employees participated in Intel wellness programs (inclusive of employees who reside in countries with no formal program offerings). Progress in 2021. During 2021, our health, safety, and wellness teams took steps to expand the number of employees participating in the safety culture survey to 50%, with an average of 87% reporting on “safety is a value“ metrics. We also worked to increase employee awareness and engagement in our programs, with a focus on prevention and early intervention programs (e.g., ergonomic programs) and participation in the Intel® Vitality Program’s newly expanded virtual offerings. 27% of global Intel employees participated in wellness programs in 2021. Looking Ahead. For our safety culture goal, we will work toward company-wide participation in our safety culture survey (with a target to expand the survey to 62% of employees by end of 2022) and increase employee and man - agement engagement in our safety programs. For our wellness goal, we will continue to further expand our wellness program access to our global employee population over the next four years, with a target to reach 100% of global employees by end of 2025, and then to increase the participation rate for all employees to 50%. Globally, we have 37 on-site health clinics to attend to work-related employee health and safety needs. At our sites in Arizona, New Mexico, and Oregon, we also have Health for Life Centers that provide primary care and specialty services (including acupuncture, chiropractic, behavioral health services, and physical therapy) in a safe and inclusive environment for our employees and their eligible dependents. The Health for Life Centers have administered hundreds of COVID-19 vaccinations and in 2021, delivered approximately 10,000 virtual visits. In 2021, in support of our safety culture and wellness goals, we further increased the percentage of employees who have the opportunity to respond to our safety cul - ture surveys, and achieved 50% employee participation. Our Safety Star Program continues in its fourth year in 2022, and we have adopted multiple leading indicators to assess progress, drive for earlier reporting of ergo - nomic injuries at the first sign of fatigue or discomfort, and promote easier access to services. We also continue to adapt our EHS services to support different work models, including hybrid, onsite, and remote workers. Rate based on 100 employees working full time for one year. Data as of March 1, 2022. Certain historical figures have been updated based on new reported cases received. Recordable and Days Away Injury Rates Introduction Our Business Inclusive Sustainable Enabling Appendix Responsible intel.com/responsibility
40 2021-22 Corporate Responsibility Report Protecting Human Rights in the Supply Chain We have continued to focus during the COVID-19 pandemic on ensuring workers in our supply chain are protected from human rights abuses. Our 2030 RISE goals reflect our intent to drive human rights despite pandemic, economic, or technological headwinds. As such, in 2021, Intel began driving knowledge of and compliance to the RBA Code of Conduct deeper into our supply chain than in previous years. Due to supply chain shortages, many companies in the electronics industry have faced severe worker shortages, which has created pressure for longer working hours and fewer days off for workers. Intel has continued to press suppliers to abide by the RBA Code of Conduct, including allowing workers a day of rest each week, limiting workers to no more than 60 hours of work per week, and making all overtime voluntary. We have worked to build a strong system to detect and address risks of forced and bonded labor among our suppliers and their recruiting and labor agents, including reaching over 135 suppliers at the tier 2 level. Our Statement on Combating Modern Slavery details the expectations we have for ourselves and our suppliers, including prohibitions against holding worker passports and charging workers fees to obtain or keep employ - ment. Since 2014, our ongoing assessments and efforts to reach deeper into the supply chain have positively affected more than 46,000 workers in our extended supply chain. Positive impacts have included the return of over $25 million in fees to more than 21,000 workers by our suppliers since 2014. A fee returned could equate to approximately three to five months of base pay, depending on location and situation. In some instances, we have faced challenges in gaining cooperation from suppliers in repaying workers quickly; we work closely with suppliers to determine acceptable remedies and put systems in place to prevent such issues in the future. Findings that May Trigger Forced and Bonded Labor Risks Findings 2017 2018 2019 2020 2021 Closed 51 46 38 30 17 In Process – 2 – – 37 To t a l 51 48 38 30 54 We proactively work to identify and help suppliers close findings that we believe may be trigger factors for forced and bonded labor. Some historic numbers have been restated due to the timing of reporting. Many challenges exist in combating issues related to forced and bonded labor, including lack of full visibility into our complex, changing, multi-tier supply chain. To increase our reach and positive impact, since 2018 we have required that approximately 50 of our suppliers work with at least three of their own major suppliers to assess and address their risks of forced and bonded labor. Our suppliers continue to complete all deliverables and demonstrate changes to tier 2 supplier policies and procedures and stronger engagements with recruiting and labor agents, resulting in the return of over $1.2 million in fees to their foreign workers since the start of our program. Importantly, our suppliers report benefits as a result of their improved practices, such as reduced business risks, better and larger pools of candidates, a more satisfied workforce, and higher worker retention—all of which can lead to improved productivity and product quality, as well as positive social impacts. Introduction Our Business Inclusive Sustainable Enabling Appendix Responsible intel.com/responsibility
41 2021-22 Corporate Responsibility Report Industry Collaboration through Training Collaboration is key to addressing broad, long-standing issues. Intel co-founded and serves on the working group of the multi-industry, multi-stakeholder Responsible Labor Initiative (RLI), which aims to protect and promote the rights of vulnerable workers. In partnership with RLI and its members, Intel helped create the Practical Guide to Due Diligence on Recruitment Fees in International Supply Chains , which provides guidelines and examples of best practices to achieve fee repayment. The RLI has established the Responsible Recruiting Program, a recruiting agent maturity model. In 2021, Intel further sponsored virtual training sessions, “Mitigating Risks of Forced Labor and Impacts of COVID-19 on Migrant Workers in the Supply Chain,“ and will continue to sponsor them in 2022. For more information on our work on human rights in our supply chain, see “ Respecting Human Rights “ in the Our Business section of this report. 2030 Goal: Supply Chain Human Rights Description. Scale our supplier responsibility programs to ensure respect for human rights across 100% of our tier 1 contracted suppliers and higher risk tier 2 suppliers. 1 Baseline. At the beginning of 2020, 18% of our tier 1 contracted suppliers had been assessed and engaged in our supplier responsibility programs. By the end of 2020, 8% of our contracted suppliers had completed the requirements of the goal. Progress in 2021. In 2021, we completed initial risk profiles on 100% of tier 1 contracted suppliers, and 28% were determined to be higher risk. Those higher risk suppliers have been included in the roadmap for follow-up actions according to our risk model. Overall, we increased to 24% completion toward our RISE goal, and remain on track to 100% completion by 2030. Progress was made in audits for higher risk suppliers, assessments for medium risk suppliers, and—for the first time—RBA training for lower risk suppliers. Looking Ahead. In 2022, our target is to assess, validate, and—where needed—mitigate the risk level of an additional 12% of suppliers. We are also evaluating the impact of IDM2.0 supply chain changes. In addition, we will continue to assess and audit high-risk tier 2 suppliers on Intel sites. 1 Tier 1 suppliers are companies from which Intel makes direct purchases (approximately 9,000 suppliers). Tier 1 contracted suppliers are subject to formal agreements with Intel based on the products and services provided and spends. Tier 2 suppliers are companies from which Intel’s tier 1 suppliers make direct purchases. Cumulative Progress Towards RISE Goal According to the RBA, the payment of recruitment fees by workers to obtain work is one of the most widespread factors that can contribute to situations of forced labor. Intel helped create a guide that details best practices for repayment. Introduction Our Business Inclusive Sustainable Enabling Appendix Responsible intel.com/responsibility
42 2021-22 Corporate Responsibility Report Responsible Minerals Sourcing Like many companies in the electronics industry, Intel and its suppliers use minerals in manufacturing. Over a dozen years ago, Intel began work to responsibly source conflict minerals, 1 and in 2017 we expanded our efforts to also address cobalt in our supply chain. We are proud of the significant progress we have made as a company and as an industry, but we know that there is more work to be done. A key technology initiative in our 2030 RISE strategy is to significantly expand our impact in responsible minerals and accelerate the creation of new sourcing standards. Intel’s strategy is to maintain the positive progress we’ve made to date on 3TG (tantalum, tin, tungsten, and gold) and cobalt, and to proactively address emerging risks from the expanding scope of materials and geographies. Our ambition is to apply our learnings from over a decade and work with our industry to broaden and accelerate the creation of sourcing standards for a much wider set of minerals across additional conflict-affected and high-risk areas (CAHRAs 2 ). More information is available on our Responsible Minerals website . Our Responsible Minerals program, Responsible Minerals Sourcing Policy , and due diligence practices address minerals originating in CAHRAs, and are aligned to the OECD Due Diligence Guidance for Responsible Supply Chains of Minerals from Conflict- Affected and High-Risk Areas (OECD Guidance). Beyond Conflict Minerals: Driving a Responsibly Sourced Mineral Supply Chain In 2021, we sent our first expanded minerals survey for aluminum, copper, nickel, and silver to suppliers contributing these materials in our Intel-manufactured microprocessors. This is an important step in our RISE strategy, as we begin mapping our supply chains for our highest priority minerals. Although sourcing of these minerals is not yet widely reported, we received a response from 89% of relevant suppliers. We are con - tinuing to pursue information on smelters and refiners in our extended supply chain—those that supply our direct suppliers. A list of smelters and refiners reported can be found on our website. To contribute to standards and help define and engage in due diligence within the copper supply chain, Intel is an active partner member of The Copper Mark , participat - ing in its Risk Readiness Assessment (RRA) Technical Revision Committee and Technical Working Group. We are continuing to map our supply chain for targeted minerals, as well as other priority minerals such as zinc and lead. Additionally, we continue to partner with industry associations to ensure standards are in place to enable our ultimate goal of responsible sourcing for all the minerals in our supply chain. We will continue to identify the highest priority minerals in pursuit of our 2030 RISE Goals. Connecting with Mining Communities Intel recognizes the importance of direct engagement with mining communities to address human rights issues in our supply chain. As a complement to our due diligence program, we have an ongoing program to dedicate resources and partner with expert civil society organizations to identify and remedy the challenges of the mining communities that source our products. A few examples of projects supported by Intel in 2021 are: Congo Power , an alliance providing mining areas with clean power, specifically funding the power needs for community training in addition to the educational programming at the Dr. Mukwege School ; PACT-RMI Youth Vocational Training Program, aimed at providing mining alternatives to Congolese youths; and the development of the world’s first Congo-focused North American collection and repository for Congolese- written documents on the Democratic Republic of the Congo (DRC), at the University of British Columbia library. We believe that helping to empower marginalized workers in our supply chain is a crucial step in promoting human rights. Intel also recognizes the local socio-economic impor - tance of the artisanal and small-scale mining (ASM) sector in CAHRAs and seeks to assist ASM sites in meeting downstream compliance requirements through the Better Mining ASM Mine Monitoring Program in partnership with Responsible Minerals Initiative (RMI) and RCS Global . Intel also supported a digital suite designed specifically for the ASM sector, which will create new pathways to track, access, and share data about practices in mining communities. Maintaining a connection and providing support to the communities that we depend on in our vast global supply chain is a crucial component to our responsible minerals program. Introduction Our Business Inclusive Sustainable Enabling Appendix Responsible intel.com/responsibility
43 2021-22 Corporate Responsibility Report Our Due Diligence Continues: 3TG and Cobalt Intel’s responsible 3TG and cobalt program, aligned with the OECD Guidance , focuses on three primary areas: Risk Identification. Each year we conduct a supply chain survey to identify the smelters and refiners that process the 3TG and cobalt contained in the products supplied to Intel, and the country of origin of minerals used. We then compare those smelters and refiners to the list of facilities that conform to a responsible minerals sourcing validation program such as RMI’s Responsible Minerals Assurance Process (RMAP). We use the information to identify potential mineral supply chain risks. Risk Mitigation. When we identify potential risks, we conduct further due diligence, which may include on-site smelter or refinery visits or virtual outreach. Such visits or virtual outreach help identify risks, encourage smelters and refiners to participate in an audit program to validate their sourcing practices, and drive risk mitigation for human rights impacts. When necessary, we will disen - gage from mineral supply chains that cannot uphold our responsible minerals sourcing standards. Additionally, we have increased virtual outreach to smelters and refiners already participating in a third-party audit program to ensure participation continuity, minimize disruption, and provide additional support throughout the pandemic. Supporting In-Region Sourcing. We believe that the creation and support of responsibly sourced 3 minerals from CAHRAs improve the lives of the people in the regions. In addition to our independent project resourcing, our membership in and support of the Public-Private Alliance for Responsible Minerals Trade (PPA) and European Partnership for Responsible Minerals (EPRM) directly support regional projects that enable responsibly sourced minerals from CAHRAs by helping to implement programs that are consistent with the OECD Guidance and supported RMI programs. Intel is also a member of the International Tin Association’s International Tin Supply Chain Initiative (iTSCi), a trace - ability program to help ensure traceability of responsibly mined minerals from mine to smelter. 1 Conflict minerals, as defined by the US Securities and Exchange Commission (SEC), is a broad term that means tin, tantalum, tungsten, and gold (3TG), regardless of whether these minerals finance conflict in the DRC or adjoining countries. 2 CAHRAs, as defined by OECD, are identified by the presence of armed conflict, widespread violence, or other risks of harm to people. Armed conflict may take a variety of forms, such as a conflict of international or non-international character, which may involve two or more states, or may consist of wars of liberation, or insurgencies, civil wars, etc. High-risk areas may include areas of political instability or repression, institutional weakness, insecurity, collapse of civil infrastructure, and widespread violence. Such areas are often characterized by widespread human rights abuses and violations of national or international law. 3 ”Responsibly sourced” refers to products from suppliers, supply chains, smelters, and refiners that, based on our due diligence, are in line with current global standards and respect human rights in every aspect of their practice. 3TG. Through our annual supply chain survey process, in 2021, 99% of the relevant suppliers and refiners reported in our supply chain are deemed responsibly sourced through their conformance to and/or participa - tion in a responsible minerals assurance program. Cobalt. Intel used the RMI Cobalt Response Template (CRT) to survey all suppliers contributing cobalt to our products. In 2021, we received responses from 100% of suppliers surveyed. Intel conducted risk mitigation in our supply chain, including smelter outreach and country of origin assessments, as well as working with direct suppliers to facilitate alternative sourcing where appropriate. Our goal is to responsibly source all cobalt in our products. Through RMI’s cobalt working group and smelter outreach, we are pursuing all smelters and refiners in our cobalt supply chain to participate in RMAP. See a complete list of facilities that processed cobalt in Intel’s supply chain based on supplier responses to our 2021 survey. Intel ’ s long-term leadership in initiatives such as the RMI and PPA allows us to regularly collaborate on the issue of responsible minerals sourcing with other companies, industries, governments, and civil society. Such collabo - ration is crucial to identify and address risks associated with mineral extraction and trade in complex mineral supply chains. All participants, from the mines through device manufacturers, have a responsibility to ensure that they do not contribute to human rights abuses. We continue to advance responsible sourcing across our product lines, materials, and industry as our business and the world landscape evolve. Our annual conflict minerals disclosure filed with the US Securities and Exchange Commission contains additional information about our 3TG and cobalt due diligence practices. Introduction Our Business Inclusive Sustainable Enabling Appendix Responsible intel.com/responsibility
44 2021-22 Corporate Responsibility Report Responsible Mobility The United Nations General Assembly set an ambitious target of 50% reduction in global number of deaths and injuries from road traffic crashes by 2030. According to the World Health Organization, approximately 1.3 million people die each year as a result of road traffic crashes. More than half of all road traffic deaths are among vulnerable road users—pedestrians, cyclists, and motorcyclists. 1 Autonomous vehicle (AV) technology has the potential to improve road safety, save lives, and transform personal mobility, including bringing broader mobility to the elderly and those with disabilities. Intel ’ s Mobileye business is a global leader in driving assistance and self-driving solutions. The company ’ s product portfolio employs a broad set of technologies covering computer vision and machine learning-based sensing, data analysis, localization, mapping, and driving policy technology for advanced driver-assistance systems (ADAS) and AVs. Mobileye technology helps keep the drivers and passengers of more than 100 million vehicles safer today. One of Intel ’ s 2030 RISE technology industry initiatives is to collaborate with industry, ecosystem partners, and governments to advance the adoption of technology- neutral safety standards to advance the AV industry in pursuit of reduced traffic accidents globally. We will achieve this through the standardization of Intel ’ s Responsibility-Sensitive Safety (RSS) safety model to enable safe, commercial deployment of AVs at scale, anywhere in the world, via self-driving Mobility-as-a- Service (MaaS). Introduced in 2017, RSS is a formal model for safety based on human concepts of what it means to drive safely. RSS enables efficient validation of the safety of an AV providing strong assurances to the public of the safety of AVs. RSS formalizes human decision making for safe driving and is based on the need to balance safety with useful driving by making reasonable worst- case assumptions about other road users. RSS is a technology-neutral approach to AV safety and provides regulators around the world a transparent way to evaluate the performance of driverless vehicles. RSS has become a leading model for global AV safety frameworks. Numerous standards bodies are beginning to include RSS in their standards development activities. Regulators and policymakers are looking at RSS as a tool for defining what it means for an AV to drive “ safely. “ Researchers are digging into the application of RSS and pushing the boundaries of its efficacy. Standards progress has been especially robust, as RSS has been contributed to both IEEE and International Organization for Standardization (ISO) standards efforts. Intel leads an IEEE working group to develop an open, transparent, and technology-neutral formal model for safety. The first project from this working group, known as I EEE 2846: Assumptions for Models in Safety-Related Automated Vehicle Behavior , defines reasonably foreseeable assumptions that an AV safety model shall consider about other road users when operating in the real world. The working group includes other industry representatives from Waymo, Uber, FCA, Ford, Motional, Nvidia, and more. Additionally, ISO has adopted the Safety First for Automated Driving paper as a technical report, and it is now being improved to a Technical Standard. This paper was published by Intel and 10 other automotive industry representatives (BMW, Daimler, VW, and more), and includes RSS in the Drive Planning Element that supports a capability to create a “ collision-free and lawful driving plan. “ China ITS, the standards body for the world’s largest passenger vehicle market, has released an AV standard based on RSS. Intel has also presented and contributed RSS to regulatory standards efforts at the United Nations Economic Commission for Europe. Other standards organizations, businesses, and think tanks are evaluating and/or using RSS, including SAE- ITC ’ s Automated Vehicle Safety Consortium, Baidu, Valeo, the RAND Corporation, and Arizona ’ s Institute of Automated Mobility. Intel is also working to educate policymakers on the critical importance of policy actions and regulation to advance the adoption of transparent and open AV safety standards in efforts like National Highway Traffic Safety Administration ’ s Advance Notice of Proposed Rulemaking, Framework for Automated Driving System Safety. Mobileye recently introduced the EyeQ® Ultra,™ the company’s most advanced, highest performing system-on-chip (SoC) purpose-built for autonomous driving. EyeQ Ultra maximizes both effectiveness and efficiency, making it the industry’s leanest autonomous vehicle (AV) chip. This efficiently designed SoC builds on seven generations of proven EyeQ architecture to deliver exactly the power and performance needed for AVs, which are all but certain to be all-electric vehicles. The first silicon for the EyeQ Ultra SoC is expected at the end of 2023, with full automotive-grade production in 2025. 1 Source: World Health Organization, Road Traffic Injuries . Introduction Our Business Inclusive Sustainable Enabling Appendix Responsible intel.com/responsibility
45 2021-22 Corporate Responsibility Report Revolutionizing Health and Safety Through Technology In 2021, we progressed on our global challenge to apply technology to advance healthcare and safety on multiple fronts. Below are a few examples: Expanding Access to Healthcare Sankara Eye Foundation and Singapore-based Leben Care are deploying a comprehensive retina risk-assessment platform in India. Netra.AI , a cloud- based AI solution, is powered by Intel® technology and uses deep learning to remotely and quickly identify conditions such as diabetic retinopathy with the accuracy level of human doctors. Nexleaf and Intel collaborated on ColdTrace 5 , a remote temperature-monitoring unit designed for refrigerators that store vaccines or other temperature-sensitive medical supplies. Functioning as an edge device on the Internet of Things, it communicates via cellular networks, providing customizable analytics, reports, and tools for healthcare workers who are responsible for maintaining vaccine distribution. “Technology and AI are democratizing healthcare access, especially in screening for ailments. ... Like-minded collaborators can create meaningful and impactful solutions for various challenges that face humanity.” — Dr. Kaushik Murali, president of Medical Administration, Quality and Education, Sankara Eye Foundation India Tackling COVID-19 As the world continued to grapple with new variants of COVID-19 in 2021, Intel collaborated with Insilico Medicine , to support the development of the online COVIDomic platform , designed to facilitate the analysis of large amounts of health data collected from COVID-19 patients. The platform includes a user-friendly interface and bioinformatics tools that determine the origin of a specific coronavirus strain and the expected severity of the disease. Advancing Medical Imaging GE Healthcare and Intel collaborated to build GE Invenia ABUS 2.0 , the first US Food and Drug Administration- approved ultrasound screening device for detecting breast cancer in women with dense breast tissue. Mammography is the gold standard for identifying can - cers in breasts, but research shows that mammography misses a third of cancers in patients with dense tissue. Powered by Intel® Core™ processors, GE Invenia ABUS 2.0 enables fast image acquisition and rendering. A second Intel collaboration with GE Healthcare resulted in an AI solution that automatically detects endotracheal tube placement in chest x-ray images . With Samsung-Medison, Intel created NerveTrack , which helps anesthesiologists detect hard-to-find nerves during ultrasound-guided regional anesthesia. The solution is powered by the Intel® Distribution of OpenVINO™ toolkit. Intel collaborated on the development of a screening device aimed at more accurately diagnosing and staging cancer in dense breast tissue. Introduction Our Business Inclusive Sustainable Enabling Appendix Responsible intel.com/responsibility
46 2021-22 Corporate Responsibility Report Protecting Patient Privacy Intel, TheBlue.AI, and apoQlar created Blue.GDPR for Nicklaus Children’s Hospital, a pediatric teaching program in Florida. The solution, accelerated by the Intel Distribution of OpenVINO toolkit, can help find and mask identifying information like faces, names, and addresses in large volumes of data. Blue.GDPR protects patient privacy in VSI HoloMedicine, a system the hospital deployed to enable physicians to use 3D images of patients, viewed through mixed-reality glasses, to visualize, highlight, and measure anatomical structures. Enhancing Healthcare and Safety with Robotics Autonomous mobile robots simplify routine tasks and give healthcare workers more time to focus on immediate patient needs. Equipped with the Intel® RealSense™ D400 camera series, Aethon TUG Robots see obstacles and navigate complex environments to safely deliver linens to nursing units on demand or on a schedule. In collaboration RightHand Robotics, Intel created RightPick2 for automated warehouse order fulfillment. Enabled by Intel RealSense technologies, RightPick2 uses computer vision technology to automatically pick and place thousands of products at high speeds while improving warehouse safety and reducing the potential for human error. Anybotics’ ANYmal industrial-grade robot, which uses Intel® Core™ i7 processors and Intel RealSense cameras, reduces human exposure to hazardous environments by performing routine inspections covering entire facilities. Read more about robotics and Intel RealSense technology. AI for Humanitarian Organizations Intel’s AI4Good initiative joined forces with the American Red Cross to use AI to more quickly collect and analyze large quantities of volunteer survey data to better understand the needs of volunteers responding to the pandemic in central Oregon. The AI-based solution helped uncover key changes needed in resource allocation over time, proving to be a valuable tool for strategy and planning. This type of AI-accelerated workflow could help humanitarian organizations more effectively engage with people who live in communities impacted by disaster. // ANYbotics — Get in touch at [email protected] High- performance & industrial -grade robot technology ROBOTS // 5 ■ 2× built -in computers for autonomy and inspection ■ Integration of dozens of actuators & sensors ■ Real -time & high -performance computation ■ Low thermal footprint ■ 6× depth cameras for 360 ° terrain scanning ■ High precision, resolution, and frequency ■ Indoor & outdoor compatible ■ Low weight and power consumption Studying Astronaut Health In 2021, Frontier Development Lab (FDL), using Intel’s AI technology, conducted a landmark study to better understand the physiological effects of radiation exposure on astronauts. Cosmic radiation can penetrate several layers of steel and aluminum to affect human tissue during space travel, leading to future cancer complications. “This research is so valuable; it could one day help astronauts at the International Space Station, future space stations, and on the upcoming 2024 lunar mission,” said Paul Duckworth, FDL researcher. Introduction Our Business Inclusive Sustainable Enabling Appendix Responsible intel.com/responsibility
47 intel.com/responsibility 2021-22 Corporate Responsibility Report Inclusive Diversity, equity, and inclusion have long been core to Intel’s values and instrumental to driving innovation and delivering strong business growth. We are advancing diversity, equity, accessibility, and inclusion in our global workforce, and advocating for public policies and laws that improve the lives of our employees and our communities. We are intensifying actions to advance our 2030 goals, which include doubling the number of women and underrepresented minorities in senior leadership and increasing the representation of women in technical roles to 40%. Our aim is to continue to expand opportunities for our employees and the industry through technology, inclusion, and digital readiness initiatives. This year’s highlights 4 industry-wide inclusion actions In April 2021, we launched the Alliance for Global Inclusion, a coalition of technology and adjacent industry partners focused on driving collective impact in four key areas: leadership representation, inclusive language, inclusive product development, and improving STEM readiness in underrepresented communities. As we celebrate our one-year anniversary, we have doubled the number of members. 10x spending with diverse-owned suppliers compared to 2014 We spent $1.4 billion with diverse-owned suppliers in 2021, 10 times the annual amount we spent when we kicked off our supplier diversity program, and strong progress toward our 2030 goal to reach $2 billion annually. 1 M Girls Moonshot In its first year since the launch, the Million Girls Moonshot reached 160,000 girls across the US via 21,000 after-school and summer STEM programs, and 612 new STEM partnerships. Introduction Our Business Responsible Sustainable Enabling Appendix Introduction Our Business Responsible Sustainable Enabling Appendix Inclusive Inclusive
48 intel.com/responsibility 2021-22 Corporate Responsibility Report Inclusive: Our Approach Diversity and inclusion are instrumental in driving innovation and delivering strong business growth. We hold ourselves, our people, our leaders, and the industries we lead to the highest standard by creating an inclusive culture for all and advancing diversity and inclusion in the industry and beyond. For more than a decade, we have taken actions to deeply integrate diversity and inclusion expectations into our culture, performance management systems, leadership expectations, and annual bonus metrics. We transpar - ently report our representation and pay equity data to hold ourselves accountable and encourage action by others. This is not added work, it’s how we work. Through an integrated strategy focused on hiring, reten - tion, and progression, we reached full representation 1 of underrepresented minorities and women in our US workforce, and achieved gender pay equity globally and race/ethnicity pay equity in the US. We are proud of what we have accomplished to date, but we recognize we still have work to do, including beyond the walls of Intel. Our RISE strategy and 2030 goals set our global ambitions for where we want to be at the end of the decade. We will continue to advance inclusion in our workforce using a holistic approach toward representa - tion, pay equity, and creating an inclusive and accessible culture that enables employees to develop and progress in their careers at all levels. In 2021, we continued to link a portion of our executive and employee compensation to diversity and inclusion metrics to drive accountability and progress. Just as we value diversity and inclusion to foster innovation within Intel, our commitment to diversity and inclusion extends to our suppliers. Our vision to grow a diverse and inclusive global supply chain includes increasing our annual spending with diverse-owned suppliers to $2 billion by 2030, as well as working with others to expand and enable inclusive sourcing practices across the industry. We know that today’s greatest challenges require a shared commitment to a plan and meaningful action to advance inclusion and social equity. That is why we committed our scale, expertise, and reach and launched the Alliance for Global Inclusion in 2021 with the goal of creating and implementing an Inclusion Index with unified goals and metrics. We work with a broad range of stakeholders on initiatives that expand the diverse pipeline of talent for our industry. We aspire to make technology fully inclusive and expand technology access and digital readiness for millions of people around the world who currently do not have the technology skills or access needed to participate and thrive in our digital economy. 1 In 2018, Intel met full representation of its workforce, meaning our workforce reflected the percentage of women and underrepresented minorities available in the US skilled labor market. 2030 RISE: Inclusive Goals, Initiatives, and Global Challenges Global Challenge : Make technology fully inclusive and expand digital readiness. Technology Industry Initiatives: Inclusion Index. Drive full inclusion and accessibility across the technology industry by creating and implementing a Global Inclusion Index with common metrics to advance progress. Inclusive Pipeline. Expand the inclusive pipeline of talent for our industry through innovative global education initiatives and STEM programs for girls and underrepresented groups. Operational and Supply Chain Goals: Senior Leadership. Double the number of women and underrepresented minorities in senior leadership roles. Technical Roles. Exceed 40% representation of women in technical positions. Inclusive Leadership. Ensure that inclusive leadership practices and accountability are embedded in our culture globally by creating and adopting an inclusive leader certification program. Accessibility and Disability Inclusion. Advance accessibility and increase the percentage of employees who self-identify as having a disability to 10% of our workforce. Supplier Diversity. Increase global annual spending with diverse suppliers by 100% (to $2 billion). Introduction Our Business Responsible Sustainable Enabling Appendix Introduction Our Business Responsible Sustainable Enabling Appendix Inclusive Inclusive
49 intel.com/responsibility 2021-22 Corporate Responsibility Report Inclusive Workforce We believe that when every employee has a voice and a sense of belonging, Intel can be more innovative, agile, and competitive. An inclusive culture that welcomes all perspectives is critical for attracting, retaining, and progressing top talent, and top talent has a direct impact on innovation and on our products. Intel is committed to providing a work environment where employees from all backgrounds are valued, respected, challenged, acknowledged, and rewarded so they can achieve their full potential. Through our 2030 goals, we are committed to further advancing the representation of women and underrepre - sented minorities in leadership and technical positions at Intel, advancing accessibility, and embedding inclusive leadership practices in our culture and across our business. Learn more about our strategy on our Diversity and Inclusion website. Transparency and open sharing of our data enables us to both celebrate progress and identify key areas for action and improvement. In 2021 we continued our focus on career development and progression of diverse talent. We saw absolute numbers increase in all categories. Some of the numbers from 2020 to 2021 did not increase much as percentages or—in some cases— decreased, because of the unprecedented growth in our company. For example, the percentage of Intel employees who identify as veterans dropped slightly, from 7.3% in 2020 to 7.2% in 2021, yet the number of employees who identify as veterans increased by roughly 150. In addition, our global representation of technical women declined from 25.2% in 2020 to 24.3% in 2021, but more technical women—some 26,000—work at Intel than at any time in our recent history. Women at Intel – Global Data 1 Positions 2019 2020 2021 Board of Directors 20.0% 30.0% 30.0% Executives 20.1% 20.7% 20.7% Senior Leadership 18.6% 18.8% 18.7% Senior 20.3% 21.3% 21.7% Experienced 29.4% 30.4% 31.2% Entry-Level 37.8% 37.9% 36.5% All Global Employees 27.5% 27.8% 27.7% Technical 24.8% 25.2% 24.3% Non-Technical 58.3% 57.7% 54.4% US Workforce Representation Data 1 Group 2019 2020 2021 Women 26.4% 26.3% 25.8% URMs 2 15.8% 16.3% 16.1% URMs in Senior Leadership 7.3% 7.6% 7.8% URM Women 3.8% 3.8% 3.8% White 45.9 % 45.8 % 44.1 % Asian 37.9 % 37.6 % 36.3 % Hispanic/Latinx 10.1% 10.5% 9.3% African American 4.9% 5.0% 4.9% Native American 0.8% 0.8% 0.9% Pacific Islander 0.3% 0.4% 0.4% Veterans 7.0% 7.3% 7.2% Two or more 3 N/A N/A 2.2% Other 4 N/A N/A 1.8% Undesired Turnover Group Represented 2021 Global Overall 5.6% Global Women 5.3% US Women 6.0% US URM 2 4.9% US Hispanic/Latinx 4.6% US African American 5.8% US Native American 2.8% 1 2021 data as of Dec. 25, 2021; 2020 data as of Dec. 26, 2020; and 2019 data as of Dec. 28, 2019. “Executives” refers to salary grades 12+ and equivalent grades. “Senior Leadership” refers to salary grades 10+ and equivalent grades. “Senior” refers to salary grades 8-9 and equivalent grades. “Experienced” includes salary grades 6 to 7 and equivalent grades. “Entry Level” refers to salary grades 2 to 5 and equivalent grades. “Technical” is based on Intel’s internal job codes and reflects technical job requirements. The definition of “technical” employee was revised in 2021 to better align with industry standards. While this data represents women and men, we acknowledge that this is not fully encompassing of all gender identities. See information about our self-identify initiatives related to our LGBT+ employees later in this section. 30% of our Board members self-identified as female. 2 We define URM to include our Hispanic, African American, and Native American employees. 3 “Two or more” ethnicity category includes employees who have checked two or more ethnicities as part of their self identifiable data choices. 4 “Other” = unknown, declined, not specified. These figures include all regular Intel employees who voluntarily left Intel, but do not include contract employees, interns, or employees who separated from Intel due to divestiture, retirement, voluntary separation packages, death, job elimination, or redeployment. Introduction Our Business Responsible Sustainable Enabling Appendix Introduction Our Business Responsible Sustainable Enabling Appendix Inclusive Inclusive
50 intel.com/responsibility 2021-22 Corporate Responsibility Report Raising the Bar Intel’s ambitious goals are designed to continue to raise the bar for ourselves and the industry to deliver greater value through corporate responsibility excellence. We will achieve those goals by strengthening our systems, processes, and programs to drive diversity, equity, inclusion, and accessibility throughout our workforce. To the right are descriptions of two of our workforce inclusion goals and progress we made in 2021. Read about our other 2030 inclusion goals in “ Accessibility and Disability Inclusion “ and “ Supplier Diversity and Inclusion .“ 2030 Goal: Representation in Senior Leadership Description. Double the number of women and underrepresented minorities (URMs) in senior leadership roles. Baseline. 1,250 women and 380 URMs in senior leadership roles as of April 30, 2020. 5 Target for 2030 is to reach 2,500 women and 760 URMs in senior leadership. Progress in 2021. During 2021 we surpassed by 74 our milestone goal of reaching 1,375 women in leadership roles, ending the year with 1,449 women in senior leadership roles across the globe. The above-and-beyond results in 2021 set us up to continue making progress in women in senior leadership. Although the absolute number of women leaders increased, given the overall growth of the company, relative representation of women leaders decreased 0.1 percentage points. Our US URM senior leaders also increased, from 384 to 444. For 2021, we established a mile - stone goal to increase representation by 10% of Black/African American employees in senior, director, and executive roles in our US population. We exceeded this milestone, increasing representation by 11%. Looking Ahead. We are on track to achieve our 2030 goal. We acknowledge the opportunity to leverage the company’s growth and IDM 2.0 strategy to further progress the representation of women and URMs in our workforce. 2030 Goal: Women in Technical Positions Description. Exceed 40% representation of women in technical positions. Baseline. 24.9% of technical roles held by women globally as of April 30, 2020. 5 Progress in 2021. At the end of 2021, 24.3% of technical roles were held by women, a decrease from 25.2% at the end of 2020, despite the company having grown its technical headcount by 8.8%. Looking Ahead. To meet our goal of increasing representation of women in technical roles to 40%, we will be implementing targeted programs to increase the number of women hired for technician, engineering hardware and software roles through sourcing, pipelining and workforce development initiatives. To drive additional corporate level focus we have made this an Annual Performance Bonus goal for all employees in 2022. In addition, we set a goal that our hiring for technical entry-level roles is at least 30% women. 5 We selected the April 30 baseline to align with the completion of our annual performance review process and promotion cycle. Introduction Our Business Responsible Sustainable Enabling Appendix Introduction Our Business Responsible Sustainable Enabling Appendix Inclusive Inclusive
51 intel.com/responsibility 2021-22 Corporate Responsibility Report Pay Equity At Intel, we strive for an inclusive and fully engaged workforce that is reflective of the best and brightest talent in our industry. Since 2019, we have achieved gender pay equity globally and we continue to maintain race/ethnicity pay equity in the US. We achieve pay equity by closing the gap in average pay between employees of different genders or race/ethnicity in the same or similar roles after accounting for legitimate business factors that can explain differences, such as location, time at grade level, and tenure. Intel’s legal and human resources teams work with third-party experts using proven statistical modeling techniques to monitor and advance global pay equity. Our comprehensive analysis includes base pay, bonuses, and stock grants. Individual employees who are identified as having a gap through this analysis receive appropriate adjustments. A key component of our pay equity strategy is our commitment to transparency, which helps us to hold ourselves accountable and encourage action by others. In support of this goal, we first publicly released our EEO-1 survey pay data in 2019, we feel it is important to continue collecting and disclosing diversity and inclusion data publicly. Inclusive Culture Inclusion is one of Intel’s core values and it is at the heart of our culture. We have taken actions to integrate our inclusion expectations into our policies, performance management systems, leadership expectations, annual bonus metrics, and employee surveys. The Intel Code of Conduct and Intel Global Human Rights Principles set out our commitment to nondis - crimination and to provide a workplace free of harassment. We have redesigned our employee performance management system and leadership promotions process to focus on results delivered, as well as how those results are achieved through alignment with Intel’s values and commitment to inclusion. Inclusion@Intel. The global Inclusion@Intel portal provides a community for employees and empowers them to build tangible and actionable inclusive practices into their everyday work environment. This unique plat - form provides highlights on inclusive leaders, inclusion training, sharing of best practices, videos, podcasts, and scenario cards that can be used to encourage critical conversations. Our Inclusive Leaders program is designed to equip managers to play leadership roles in growing Intel's inclusive culture and fostering leadership skills needed to build diverse and inclusive, high-performing teams. In 2021, we expanded the program across Intel worldwide via workshops and small-cohort-based learning. Employees completed over 4,000 individual learning modules in 2021. For further impact, we also integrated the inclusion content into new “Manager Academy“ training and began rolling it out to our 13,000 managers worldwide in 2021. Inclusive Hiring Practices. We have developed a set of best practices and training to mitigate the influence of unconscious bias in the hiring process. These practices include posting of formal requisitions for internal positions, using impartial descriptions of qualifications for all open jobs, and having diverse slates of candidates and diverse hiring panels. In 2021, we also required inclusive hiring training for all of our hiring managers. Linking Compensation to Diversity and Inclusion Goals Since 2008, we have linked a portion of our executive and employee compensation to corporate responsibility metrics, including diversity and inclusion metrics. In 2021, we met these metrics, which focused on the 2030 workforce goal milestones of reaching 1,375 women in senior leadership roles globally and increasing by 10% the representation of Black/African American employees in senior, director, and executive level roles in our US workforce. In 2022, the goals related to inclusion include: increasing by another 10% the representation of Black/African American employees in senior, director, and executive level roles in our US workforce; women representing 30% of technical entry-level hires; and $1.4 billion in annual spending with diverse suppliers. For more information, see our 2022 Proxy Statement , “ Supplier Diversity and Inclusion “ later in this section of the report, and the Sustainable section of this report. Introduction Our Business Responsible Sustainable Enabling Appendix Introduction Our Business Responsible Sustainable Enabling Appendix Inclusive Inclusive
52 intel.com/responsibility 2021-22 Corporate Responsibility Report Leadership Councils and Employee Resource Groups We offer close to 40 Employee Resource Groups (ERGs) and seven Leadership Councils that connected over 25,000 employees in 2021. Some 21% of our employees are members of ERGs. Leadership Councils. Our Leadership Councils, composed of over 400 Intel leaders, help guide and mentor members of the ERGs. Their mission is to promote the progression and growth of diverse employ - ees and foster an inclusive culture where all employees can thrive professionally. The Intel Black Leadership Council, Intel Disability Leadership Council, Intel Latinx Leadership Council, Intel Native American and Pacific Islander Leadership Council, Intel Network of Executive Women, Intel Veteran Leadership Council, and Out and Ally Leadership Council host sponsorship programs to help support and advance leaders within their respective communities, while driving business results. Leadership Councils are composed of Intel Senior Leadership, with membership usually starting at the director or principal engineer level. Each council is supported by a sponsor at the executive or senior vice-president level. ERGs. Intel has ERGs organized around race, national origin, sexual orientation and gender identity, parent - hood, disabilities, education, faith and beliefs, and other common affinities. ERGs can serve as powerful networks, offering opportunities for personal and profes - sional development, access to mentors, and volunteer activities that facilitate teamwork and build camaraderie. We encourage employees to participate in ERGs beyond their personal affinities to build relationships with a wider community and exchange learnings. We believe that retention rates increase when people feel included in deep and wide-ranging networks. We chartered a new ERG in 2021, Partners for Inclusion and Equity, which provides a forum for ongoing, safe, and open conversations about the impacts of racism. Membership in this new ERG grew to nearly 400 in under a year. Intel’s Cross-Faith and Beliefs ERG Leaders Alliance, made up of seven belief-based ERGs, received the Above and Beyond Award in the Culture Impact cat - egory from Seramount, a leading force in promoting diversity, equity, and inclusion in the corporate market. In addition, Intel placed #1 on the Fortune 100 Corporate Religious Equity, Diversity & Inclusion Index 2021. Intel Employee Resource Groups Our ERGs are part of the engine that drives community and inclusion at Intel. The vast variety of these groups reflects how Intel tries to include and empower every employee to embrace a sense of belonging. Agnostics, Atheists, and Allies at Intel American Veterans at Intel Arabs at Intel Community Asian Cultural Integration Baha'i Intel Network Employees X-Site Together Embracing Diversity Community Intel Armenian Society Intel Bangladesh Association Intel Bible-Based Christian Network Intel Chinese Employee Network Intel Disability and Accessibility Network Intel Doctorates Leadership Forum Intel Eastern European Balkanika Group Intel Filipino Employee Network Intel French Speakers Network Intel Gay, Lesbian, Bisexual, or Transgender Employees Intel Hindu Network Intel India Employee Group Intel Iranian Employee Group Intel Jewish Community Intel Korean Community Intel Latinx Network Intel Muslim Employee Group Intel Native American Network Intel Nepalese Group Intel Pakistani Employee Group Intel Parents Network Intel Russian-Speaking Employee Group Intel Sikh Employee Group Intel Taiwan Network Intel Vietnamese Group India Veterans at Intel Network of Intel African Ancestry NextGen Professionals Network Pacific Islanders of Intel Partners for Inclusion and Equity Senior Women’s Community Turkish Employee Network at Intel Women at Intel Network Employee Surveys. Through our regular Employee Experience Surveys , employees can voice their percep - tions of the company and their work experience, including their views on our diversity and inclusion performance and culture. In 2021, 90% of employees reported, “I am treated with dignity and respect at work” and “Intel makes it easy for people from diverse backgrounds to fit in and be accepted,” an increase in favorable responses year over year. We also created the Employee Inclusion Survey to develop deeper understanding of how Introduction Our Business Responsible Sustainable Enabling Appendix Introduction Our Business Responsible Sustainable Enabling Appendix Inclusive Inclusive
53 intel.com/responsibility 2021-22 Corporate Responsibility Report different employee populations experience inclusion at Intel, identify opportunities for improvement, and better understand root causes of any systemic issues and how to address them. Employees from 30 countries were invited to participate and over 27,000 responded. We shared results with employees and enabled them to ask questions about actions. The table below shows the percent favorable (“Strongly Agree“ or “Agree“ with the statement) as scored by different demographic groups. Despite these high-level results, the wide range of experiences reported by different demographic groups indicates that Intel has room for improvement in inclusion for some populations. This data will help guide our continued efforts in driving an inclusive culture. Employee Inclusion Survey Results (Shown percentage of favorable response) Global Employees US Employees Question All Women LGBT+ Employees Employees with Invisible Disability All URM Hispanic or Latinx American Indian or Alaska Native Black or African American Black or African American Women There are visible role models like me at Intel 80% 77% 52% 66% 74% 63% 66% 65% 56% 40% My manager values diverse talents, beliefs, backgrounds, and experiences 89% 90% 83% 86% 87% 86% 86% 85% 84% 80% Intel provides a safe and inclusive workplace for people like me 90% 90% 81% 81% 85% 83% 86% 77% 78% 71% There is fairness in the Insights/ Rewards process 72% 72% 66% 64% 62% 60% 63% 62% 54% 47% I can be open about who I am and still be successful at Intel 83% 83% 66% 69% 77% 75% 78% 66% 70% 61% Focus on LGBT+ Inclusion In 2021, we continued to cultivate a work environment that recognizes LGBT+ employee value, provides competitive benefits, and fosters belonging. IGLOBE, our LGBT+ ERG, expanded to 17 chapters, with new chapters in Poland, Germany, the Netherlands, and China. IGLOBE is guided by the Out and Ally Leadership Council (OALC) of senior leaders who promote visibility and focus on progression of LGBT+ employees and expansion of allyship through education, mentoring, and advocacy. In 2021, participation in the LGBT+ mentor program increased by 35%. Since 2002, the Human Rights Campaign (HRC) has listed Intel on its Corporate Equality Index (CEI), awarding Intel the top score of 100 in 17 of those years. The CEI recognizes employers that take steps to ensure greater equality for LGBT+ workers and their families in the form of policies, benefits, and practices. Intel Guadalajara also earned 100 points and received HRC Equidae MX Certification, awarded to companies in Mexico committed to providing LGBT+ inclusion. In our 2021 Employee Inclusion Survey (EIS), our LBGT+ employees reported strong favorable results in some areas, but also indicated that we have more work to do in psychological safety. Less than half of LGBT+ respondents said they had a positive experience in being open about their sexual orientation and gender identity, and have visible role models. The data allowed us to explore the dynamics of different identity groups for the first time; for example, the transgender community had a high belonging score (90% favorable), while our non-binary colleagues had one of the lowest scores related to visible role models (39% favorable). As part of the EIS, 5.1% of our employees that responded to the survey shared that they are a member of the LGBT+ community, but only one in three of those who responded to the survey has self-IDed in our human resources system (available in several countries). We have made progress educating employees on the importance of self-IDing, and in 2022, we plan to expand our self-ID capability to additional countries. We will also con - tinue to focus on retention and progression through our mentor program, OALC speaker series, and other initiatives driven by OALC and IGLOBE. Introduction Our Business Responsible Sustainable Enabling Appendix Introduction Our Business Responsible Sustainable Enabling Appendix Inclusive Inclusive
54 intel.com/responsibility 2021-22 Corporate Responsibility Report Accessibility and Disability Inclusion We strive to become a global employer of choice for people with disabilities and those caring for family members with disabilities. According to the World Health Organization, 15% of the world’s population (over 1 billion people) have some form of disability and it is estimated that 70% of disabilities are invisible. 6 In 2021, we launched the new Intel name sign, a critical component of disability inclusion and support of the Deaf community. The Intel Corporate Accessibility Policy outlines our commitment to a culture of accessibility and broader impact through our technology. Through our three-pillar strategy, we focus on advancing accessibility through our workplace, products, and industry. We focus on advancing accessible design and innovative technology solutions, physical and digital accessibility in the work - place, integration of accessibility best practices in our culture, use of accessible hiring and employee practices, and external engagement and collaboration. The Intel Disability and Accessibility Network (IDAN) has a presence at 12 of our sites worldwide and is sup - ported by the Intel Disability Leadership Council. These groups advocate for and work to advance and retain our disability community, while amplifying awareness both internally and externally. The team has also advanced a plan to ensure that employees who are caring for a family member are supported. In 2021, Disability:IN recognized IDAN as Employee Resource Group of the Year for exemplary programming and practices for employees. IDAN also received internal recognition as Intel’s ERG of the year through our Global Diversity and Inclusion Achievement Awards. In 2021, for the fifth year in a row, Disability:IN gave Intel the maximum score of 100 in the Disability Equality Index (DEI), and named Intel one of the Best Places to Work for People with Disabilities. The DEI, a joint initiative with the American Association of People with Disabilities, is a comprehensive benchmarking tool that provides an objective score and roadmap on disability inclusion policies and practices. In early 2021, Intel CEO Pat Gelsinger signed the CEO Letter on Disability Inclusion to commit to benchmarking our disability inclusion journey with the DEI, and Intel also joined The Valuable 500 , a global CEO community focused on advancing disability inclusion through business leadership. In 2021, we continued employee training on how to create accessible communications materials, meetings, and events. We delivered accessibility training to over 1,500 employees and also added captioning to Intel Developer Zone videos to further support accessibility for our developer community. 2030 Goal: Accessibility and Disability Inclusion Description. Advance accessibility and increase the percentage of employees who self-identified as having a disability to 10% of our workforce by 2030. Baseline. 1.4% of Intel’s US workforce self-identified as having a disability as of December 2020. Progress in 2021. 3.8% of Intel’s US workforce self-identified as having a disability as of December 2021. 2021 was a year of laying the groundwork for us to begin preparing for the global expansion of our self-identification process, and to develop our maturity model and scaling roadmap to fully embed accessibility into our culture and processes globally. Looking Ahead. In 2022, we are continuing to assess systems, processes, and resources to prioritize a multi-year execution plan. 6 World Health Organization and Invisible Disabilities Association . Accessible Product Design Accessible technology allows people to acquire education, have a career, use government services, make purchases, pursue hobbies, and much more. Access to information and communications technologies is defined as a basic human right in the United Nations Conventions on the Rights of Persons with Disabilities . As part of our Inclusive Global Challenges, our goal is to ensure that every client computing platform we produce expands accessibility for more people than the platform before, with experiences designed in collaboration with people with disabilities. By 2030, all Intel user experience teams will have adopted inclusive design and research processes with relevant operational research support. In 2021, we hired a full-time inclusive design operations program manager, and we have adopted an Accessibility Maturity Model to chart our progress toward our 2030 goals. We have also created new matrixed ways of elevating accessibility across our product design segments. Our work has resulted in new assistive technologies that use indoor navigation, assistive speech, and 3-D printing. For example, as part of the Intel Incubation Program, Intel catalyzed OmniBridge to enable face-to-face con - versations between people who communicate through American Sign Language and those who speak English. The system harnesses the power of AI-driven machine translation technology. Learn more . Introduction Our Business Responsible Sustainable Enabling Appendix Introduction Our Business Responsible Sustainable Enabling Appendix Inclusive Inclusive
55 intel.com/responsibility 2021-22 Corporate Responsibility Report Inclusion for Everyone We recognize and respect the worth and dignity of every employee and want everyone to contribute at their full potential. We promote and sustain a sense of belonging for everyone, but have identified areas where we need to do better. First, we recognized that some of our diversity and inclusion efforts have been more US focused, even though Intel is a global company. We have adjusted by ensuring that global goals are a significant part of our 2030 RISE strategy and by integrating all regions even more in our processes. We identified our factory workers as another group we could better engage. We are launching a program to increase engagement with our factory workers and provide alternative ways of engagement for all. We also recognized that some communities have felt excluded from our diversity and inclusion efforts. Our efforts have been focused on equity of opportunity and changes in culture that should benefit everyone. We have taken steps to make it more explicit that we want to include everyone in our efforts. In 2021, a group of men and women from Intel business groups around the globe organized Intel’s International Men’s Day to celebrate men’s positive contributions to society, promote positive male role models, and focus on men’s health and well-being. The event included partnerships with several Intel ERGs, as well as external organizations such as Movember and the Better Man Conference. The celebration attracted more than 1,000 attendees, and included 24 speakers from nine countries. Hiring, Retention, and Progression We have developed a set of programs and initiatives to support inclusive hiring, retention, and progression practices. Diversity and inclusion start from the moment we identify candidates and try to fill roles with the best available talent. Inclusive hiring practices include, in part, ensuring that we have a pool of diverse candidates. We have invested in programs that enable us to reach underrepresented candidates and give them equal opportunities to compete for jobs. Through the Intel Scholars Program, we engage with internal business units, Intel leaders, and 15 external partners to support underrepresented students pursuing degrees in STEM fields. The program includes financial scholarships, exposure to Intel jobs, mentors, networking, research insights, and training opportunities. We supported 354 scholars in 2021 through our scholarship programs. In 2016, we launched our confidential retention Warmline service, and in 2021 extended real-time Warmline support and guidance at scale for our global workforce. The Warmline provides employees with guidance through challenges in areas such as career progression, belonging/integration, job skills alignment, and employee-manager connection. In addition to supporting employees before they consider leaving Intel, the Warmline provides a robust data set to help us identify patterns, locate problem areas, and address issues proactively and systemically. Some 83% of employees who used the Warmline service in 2021 have stayed at Intel and 99% would recommend it to others. In 2021, we also, launched the Executive Warmline to better serve executives with internal transition and navigational support. Of the executives who used the Executive Warmline since its launch, 69% have stayed at Intel. We have also been piloting new programs to support retention and promotion. The first pilot, for senior-level women across the globe, aims to increase promotion and development opportunities and improve job satisfaction and retention through leadership and sponsor/protégé matching. In 2021, 95 women participated in the pilot, and we aim to scale it further in 2022. A second pilot, Talent Keepers, aims to engage mid- level Black and African American employees in the US and Costa Rica more directly with their managers in career development and progression discussions and initiatives. A total of 124 pairs of employees and managers completed the program in 2021, and we expect to add 300 more participants in 2022. Introduction Our Business Responsible Sustainable Enabling Appendix Introduction Our Business Responsible Sustainable Enabling Appendix Inclusive Inclusive
56 intel.com/responsibility 2021-22 Corporate Responsibility Report Social Equity Intel is committed to a culture of inclusion for all, and we recognize our shared responsibility to combat the structural inequalities impacting our employees and communities. We acknowledge accelerating equity is critical to successfully creating a culture of inclusion and belonging. At Intel, social equity is an extension of our Global Human Rights Principles and means creating a world in which all people, regardless of their identity or background, have equal voice, representation, and access to opportunities. In 2020, Intel established the Social Equity Program Office chartered to leverage data to address inequality and drive equitable change inside Intel, in our communities, and across broader society. We launched enterprise-wide sprint teams at all levels across our Human Resources and business organiza - tions, and defined tangible social equity goals to accelerate our 2030 RISE Strategy. Our social equity strategy includes programs, resources, investments, and policy advocacy to remove systemic barriers to a fully inclusive workplace and society. Intel’s Global Social Equity Policy Principles guide our work with governments and organizations to build a more equitable world. In 2021, we focused on creating measurable progress across four key areas: people, philanthropy, products, and policy. People: Action from the Inside Out Our social equity strategy begins with leveraging capabilities across Intel to drive equitable change from the inside out. Working toward our 2030 goals, we are taking action to accelerate US representation of African American employees at senior, executive, and director levels by 30% by the end of 2023. We achieved an 11% increase in 2021 and have set a mile - stone goal to achieve another 10% in 2022. Setting interim milestones ensures sustained progress as we further integrate equity into our systems and practices to close persistent gaps in African American and other inclusive leadership representation goals. Driving equity also requires personal transformation and action. Intel leaders continue to hold listening sessions to learn from lived experiences of employees. We also provide learning and engagement pathways for our employees and managers. Our Social Equity Speaker Series, an inclusive forum with expert external speakers, provides safe and supportive platforms for developing shared language and deeper learning from diverse perspectives. Philanthropy: Catalyzing Change Intel and the Intel Foundation are catalyzing change through strategic engagements and community partnerships. Recognizing that some issues of inequality are deeply embedded throughout society, Intel estab - lished multi-year investments with several organizations at the forefront of advancing social justice and anti- racism at scale around the world. The organizations were selected based on input from our Network of Intel African Ancestry and the Intel Black Leadership Council and focus on critical areas including equitable justice, digital equity, education equity, and economic equity. Intel, the Intel Foundation, and employees donated $600,000 through donation matching campaigns that supported social equity and justice causes globally in 2021. Intel and the Intel Foundation support community programs that place equity and access at the center of their offerings. For example, the Equity in STEAM initiative —a partnership with YWCA Metropolitan Phoenix—is designed to address the systemic barriers preventing women and people of color from pursuing careers in STEAM. In early 2022, the initiative announced funding grants and a leadership cohort for 20 Arizona educators and nonprofits . Products: Advancing Equity Through Technology Solutions We continue to leverage Intel’s expertise to unleash the power of data and technology to advance social equity. Collaborating with others, our data scientists and engineers are researching more inclusive, accessible designs for future products. Our teams are also working to prevent algorithmic bias as part of our focus on responsible AI practices and the development of inclusive coding language. Through the Intel RISE Technology Initiative (IRTI), our employees submit their ideas for technology projects in collaboration with Intel customers to positively impact social equity and human rights. In 2021, more than $1.4 million was directed to support innovative global projects at the intersection of human rights and social equity to expand access and opportunity for healthcare, digital inclusion, and economic and food security. Policy: Advocating for Social Justice Intel advocates for programs, public policy, and legislative solutions that combat systemic inequity. In early 2021, we pledged $5 million to North Carolina Central University, a historically Black college or university (HBCU), to create the first Tech Law and Policy Center. Today, only 5% of US attorneys are Black, even though more than 13% of the US population is Black. HBCUs are key to producing the next generation of legal and policymakers who will lead the charge to eradicate systemic and structural inequities. Intel also introduced expungement clinics to further our commitment to social equity. Introduction Our Business Responsible Sustainable Enabling Appendix Introduction Our Business Responsible Sustainable Enabling Appendix Inclusive Inclusive
57 intel.com/responsibility 2021-22 Corporate Responsibility Report Social Equity and Racial Justice Collaborations Intel has provided both financial and in-kind support to organizations working to advance economic equity, education equity, and equitable justice and anti-racism innovations at scale. Economic Equity Living Cities . Living Cities and Intel are equipping US city leaders in the Closing the Gap Network with racial equity tools and competencies to advance equity across government policies and functions focused on economic mobility and closing racial wealth gaps. PolicyLink . Intel and Policy Link are using data-driven strategies through the National Equity Atlas and policies to drive economic equity in US cities. Additionally, they recently published The CEO Blueprint establishing corporate racial equity standards to advance equity as a business challenge. Greater Houston Community Foundation . Intel is collaborating with the City of Houston’s Complete Communities Initiative to ensure all Houstonians have access to quality services, amenities, and opportunities for economic mobility. Education Equity X-Prize Foundation . In 2020, Intel and the X-Prize Foundation co-developed an X-Prize Racial Equity Alliance to bring together leaders, experts, and Intel employees to tackle social and racial equity challenges. In 2022, Intel Employee Service Corps volunteers engaged approxi - mately 100 employees with the Racial Equity Alliance to launch the Racial Equity Alliance Ideas Competition, presented by Intel. The competition aims to generate ideas for future XPRIZE competitions with the goal of advancing educational equity in the US. UNESCO . Intel and UNESCO are delivering gender-transformative digital skills education and developing inclusive anti-racism educational resources for educators around the world. Obama Foundation . Through the Obama Leaders program, Intel is equipping changemakers in Africa, Asia-Pacific, and Europe with the leadership skills and resources they need to drive equity innovation in their communities. Equitable Justice Vera Institute of Justice . Intel and Vera are working on evidence-based, data-driven programs that center racial equity to improve outcomes for all in the criminal justice system. Introduction Our Business Responsible Sustainable Enabling Appendix Introduction Our Business Responsible Sustainable Enabling Appendix Inclusive Inclusive
58 intel.com/responsibility 2021-22 Corporate Responsibility Report Building a Diverse Technology Industry We are committed to supporting the development of a more diverse technology industry through investments, collaborative initiatives, and research projects. We are also focused on inspiring more girls and women and underrepresented minorities to pursue and succeed in technology careers through education initiatives, financial assistance, and internship opportunities. Alliance for Global Inclusion and Inclusion Index As part of our 2030 RISE commitments, we are working drive full inclusion and accessibility across the tech - nology industry by partnering with others to create an inclusion index with common metrics and collaborative actions to advance progress. In 2020, we hosted a series of visioning conversations with representatives of 19 chief diversity and inclusion officer teams across our industry and adjacent ones. The result was the launch in 2021 of the Alliance for Global Inclusion , a coalition focused on creating a shared set of diversity and inclusion metrics. Since its launch, the Alliance has more than doubled in size, from five to 12 members and has made meaningful progress on creating an Inclusion Index to serve as a benchmark for companies to track diversity and inclusion improvements, provide information on current best practices, and highlight opportunities to improve outcomes across industries. The Alliance also created teams to drive metrics in four critical areas: leadership representation, inclusive language, inclusive product development, and STEM readiness in under-resourced communities. In December 2021, the Alliance published suggested guidance to secure diverse representation on boards of directors. Investing in Diverse-Owned Technology Start-Ups Intel Capital has continued its commitment to invest in technology companies led by women and underrepre - sented minorities, entrepreneurs living with disabilities, US-based entrepreneurs from the LGBTQ+ community, and US military veterans. In 2021, approximately 30% of Intel Capital’s venture stage dollars committed were in start-ups led by diverse leaders. In August 2020, Intel Capital announced a commitment to double its investments in Black founders over the next five years, with 15% of our total new deals led by Black founders. At the end of 2021, 11% of our venture dollars committed were in companies led by Black founders. Investing in Pathways to the Technology Industry In 2017, we launched a $4.5 million program with historically black colleges and universities (HBCUs) aimed at increasing the number of Black and African American students who pursue electrical engineering, computer engineering, and computer science fields. Our partnerships with six HBCUs—Howard University, Florida A&M, Tuskegee, Morgan State, North Carolina A&T, and Prairie View A&M—include 12 research programs and sponsorship of more than 100 students, including more than 75 graduate research assistants and student researchers. These programs are focused on key research areas, including AI, cybersecurity, data analytics, and embedded systems. For example, in 2021 Tuskegee completed research on power system stability and wind ramp prediction, while Morgan State developed eight machine-learning labs to support seven electrical and computer engineering courses reaching 150 students per semester. Intel has also partnered with the American Indian Science and Engineering Society (AISES) to expand computer science education and career readiness in schools in Arizona, California, and Oregon that serve Native American students. The Intel Next Generation of Native American Coders project features a two- semester course with culturally contextualized lessons, hands-on independent projects, mentorship, teacher training, equipment and supplies, and more. The aim of the initiative is to increase the number of Native American students in technology and engineering fields in academia and professionally. Since 2017, Intel has provided $1.16 million to 178 students as part of the AISES Intel Growing the Legacy Scholarship Program . Intel is a founding member of the Reboot Representation Tech Coalition , formed and spearheaded by Melinda Gates’ incubation company, Pivotal Ventures. The initiative aims to align existing philanthropic donations and increase funding to double the number of women of color graduating with computing degrees by 2025. Coalition members have pledged more than $12 million to reach this goal. Recent educational initiatives include $100 million to be invested over the next decade to establish semi - conductor manufacturing education and research collaborations with university, community colleges and technical educators across the U.S. Intel intends to fund $50 million in grants in Ohio over the next 10 years. Part of this investment will establish the Intel® Semiconductor Education and Research Program for Ohio to fund a collaborative, multi-institution research and education program that will emphasize gaining real-world experience and innovating in semiconductor fabrication. Intel will also partner with the US National Science Foundation (NSF) on a national funding initiative. NSF will match Intel’s $50 million investment, making $100 million available in funding opportunities. NSF will release a solicitation for proposals from researchers and educators across the nation to develop curriculum improving STEM education at two-year colleges and four-year universities, inclusive of minority- serving institutions, and novel research to advance semiconductor design and manufacturing. Intel announced the new Semiconductor Technician Quick Start program with Maricopa Community Colleges in Arizona. Quick Start is an accelerated two-week program that prepares students for a rewarding career as a semiconductor technician with hands-on learning from industry-experienced Intel employees as instructors. Introduction Our Business Responsible Sustainable Enabling Appendix Introduction Our Business Responsible Sustainable Enabling Appendix Inclusive Inclusive
59 intel.com/responsibility 2021-22 Corporate Responsibility Report Supplier Diversity and Inclusion Our commitment to diversity and inclusion extends beyond Intel to our suppliers. We believe a diverse supply chain supports greater innovation and value for our business while helping to enable Intel’s vision to create world-changing technology to improve the life of every person on the planet. Our vision to grow a diverse and inclusive global supply chain includes increasing our annual spending with diverse-owned suppliers, as well as working with others to expand and enable inclusive sourcing practices across the industry. On our path to reach our 2030 RISE goal to increase annual spending with diverse suppliers to $2 billion globally, we have set three major milestones focused on spending with women-owned suppliers outside of the US and minority-owned suppliers globally, including US Black-owned suppliers. We put these milestones in place to advance racial and gender economic equity. We are expanding opportunities for diverse-owned companies to compete for new business and increase their positive impact in their communities and our industry. Inclusion of diverse-owned suppliers is built into our operations and outlined in our Supplier Diversity Policy . We have integrated requirements for including diverse suppliers into our supplier bidding, selection, and management processes, and in our EPIC award. We apply these expectations and requirements to tier 1 2 suppliers, and we also expect our non-diverse suppliers to report their own spending with diverse-owned suppliers and subcontractors. 2 “Tier 1 suppliers“ are companies from which Intel makes direct purchases. “Tier 2 suppliers“ are companies from which Intel’s tier 1 suppliers make direct purchases. 2030 Goal: Supplier Diversity and Inclusion Description. Increase global annual spending with diverse suppliers 1 by 100% to $2 billion. Baseline. $1 billion in annual spending with diverse suppliers as of January 1, 2020. Progress in 2021. At the end of 2021, we had increased our annual spending to $1.4 billion, bringing us to a ten-fold increase in diverse supplier spends since our diverse supplier program's inception in 2015. We have made strong progress toward our 2030 goal and our three milestones focused on women-, minority-, and US Black-owned suppliers. Looking Ahead. In 2022 and beyond we will continue our progress toward our milestones to spend $500 million annually with women-owned suppliers outside the US by the end of 2025 and $800 million annually with minority- owned suppliers globally by end of 2023, including $250 million with US Black-owned suppliers. 1 We recognize certified diverse suppliers as businesses that are at least 51% owned, operated, and controlled by any of the following categories: women; minorities as recognized by the country or region where the business was established; veterans/military service- disabled veterans; persons who are lesbian, gay, bisexual, or transgender; or persons with disabilities. While Intel recognizes these categories, they may vary in accordance with local law. “One of Intel’s 2030 RISE goals—to reach $2 billion in annual spending with diverse suppliers—goes beyond numbers. Realizing full diversity and inclusion across our supply chain globally is critical to delivering world-changing technology that improves the life of every person on the planet.” — Keyvan Esfarjani, Executive Vice President and Chief Global Operations Officer at Intel Introduction Our Business Responsible Sustainable Enabling Appendix Introduction Our Business Responsible Sustainable Enabling Appendix Inclusive Inclusive
60 intel.com/responsibility 2021-22 Corporate Responsibility Report Collaborating to Drive Change Globally Over the past decade, we have partnered with other companies, NGOs, and governments to create opportunities for diverse suppliers, including hosting supplier workshops and collaborating on country- level certification standards. This work has included our partnership with NGOs and certifying bodies, such as WeConnect International, a global network that connects women-owned businesses to qualified buyers around the world. In 2021, Intel was recognized as one of the Top 10 Global Champions for Supplier Diversity and Inclusion by WeConnect International with the National LGBTQ Chamber of Commerce and Disability:IN. In addition, we continued to share with companies across industry sectors best practices on how to set up or expand supplier diversity programs and processes globally. See the Quick Start Guide . Intel’s Supplier Diversity and Inclusion program in 26 countries and regions works with NGOs to identify and certify potential suppliers. United States Canada Mexico Costa Rica Brazil South Africa Australia Malaysia Singapore Hong Kong Taiwan Japan South Korea Mainland China India Kenya Israel Turkey Nigeria Spain France Germany Netherlands Ireland United Kingdom Invest in Supplier Diversity Around the World Switzerland Supplier Feature: HB Safety & HB Innovation, Israel Hadas Blum, a female entrepreneur, founded and manages two companies in Israel, HB Safety and HB Innovation. HB is the largest organization in Israel focused on creative safety solutions and innovation. Supporting Intel. About 14 years ago, Intel offered HB the opportunity to participate in a project. Intel supported HB ’ s innovative ideas, such as inviting CEOs from across Israel to a “ Managers Leading Safety “ forum to learn how Intel manages safety. Since then, HB has been a key partner with Intel in Israel. Enabling safety with strategy and innovation. As it is with Intel, safety is a way of life for HB. HB brings new approaches to assimilating safety processes that empower workers and management through positive feedback, remove barriers, and promote a common “ safety language. “ The strategy encourages open communication and willing participation among work groups and managers to drive a successful safety culture across the entire site. PAS by HB Innovation. HB Innovation designed a powerful safety tool—PAS, an automated digital process management system through which safety issues are quickly reported, dealt with, and resolved. The system allows for issue reporting in any language and automatically generates final reports and delivers them to relevant parties. HB doesn ’ t stop with the workplace; the company also emphasizes and encourages workers to adopt safety at home, on the roads, and as a way of life. Learn more about Intel ’ s efforts to create opportunities for diverse- owned businesses around the world to thrive. Introduction Our Business Responsible Sustainable Enabling Appendix Introduction Our Business Responsible Sustainable Enabling Appendix Inclusive Inclusive
61 intel.com/responsibility 2021-22 Corporate Responsibility Report Making Technology Fully Inclusive and Expanding Digital Readiness We are committed to our 2030 global challenge to advance inclusion and accessibility for millions of people who do not have the technology skills or resources needed to access educational, economic, and community resources in our digital economy. In 2021, we scaled a number of programs and collaborations with customers, governments, and other stakeholders in the areas of technology access and online learning, digital skills and readiness, and technology applications to advance social equity and human rights. Technology Skills for Today and Tomorrow Digital readiness encompasses digital skills, trust, and responsible usage of emerging technologies for broader socio-economic benefits. Globally, there is a gap emerging between new jobs that require digital skills and a workforce that lacks the required skills to fill these jobs. According to Accenture,¹ closing the digital skills gap could add up to $11.5 trillion US in GDP in 14 G20 countries by 2028. To address immediate semiconductor manufacturing technical challenges and workforce shortages, in March 2022, we announced a $100 million investment over the next decade to establish semiconductor manufacturing and research collaborations with universities, community colleges, and technical educators across the US. We will invest $50 million directly into higher education institutions in Ohio, where we plan to build two new leading-edge chip factories. An additional $50 million from Intel will be matched by $50 million from the US National Science Foundation in national funding opportunities. Aligned with Intel ’ s corporate purpose and RISE 2030 strategies and goals, Intel has rolled out Intel® Digital Readiness Programs globally in partnership with govern - ments, academia, civil society, and industry stakeholders as a shared-value initiative to demystify and democratize emerging technologies. Intel Digital Readiness Programs empower wider non-technical audiences, future developers, and next-generation technologists with the appropriate skills, mindsets, tools, and opportunities to use technology effectively and responsibly. During 2021, Intel drove a wide range of initiatives—including AI for Citizens, AI for Youth, AI for Future Workforce, AI for Current Workforce, and Digital Readiness for Leaders—aimed at empowering citizens, students, professionals, and leaders to participate in and benefit from a digital economy. We scaled the programs by working with more than 20 countries, 50 education ministries, and other partners, impacting over 13,000 institutions and 1 million people globally. In the US, the AI for Workforce program expanded to 33 community colleges across 18 states, since Intel and the Maricopa County Community College District launched the first Intel-designed AI associate degree program in late 2020. Through collaboration with Dell and the American Association of Community Colleges, we expect the program to reach all 50 states by 2023. In China, AI for Youth and AI for Future Workforce pro - grams expanded to five provinces through collaboration with ministries, key universities, and industry partners. In Asia, Intel Digital Readiness programs reached eight countries/regions—India, South Korea, Singapore, Malaysia, Indonesia, Thailand, Taiwan, and Japan— including new programs: AI for Citizens, AI for Current Workforce and AI for Future Workforce. We also scaled 1 It’s Learning. Just Not As We Know It. Introduction Our Business Responsible Sustainable Enabling Appendix Introduction Our Business Responsible Sustainable Enabling Appendix Inclusive Inclusive
62 intel.com/responsibility 2021-22 Corporate Responsibility Report the AI for Youth program within the European Union, launched the AI for Future Workforce program in agri - cultural vocational schools in Poland, worked with local schools to include AI for Youth in the formal education system in Israel, and kicked off a digital readiness journey in South Africa in partnership with Smart Africa . To celebrate AI innovations with students, next- generation technologists, and future developers around the world, we also introduced the inaugural Intel® AI Global Impact Festival , with theme of “Enriching Lives with AI Innovation.“ The virtual event attracted more than 111,000 next-generation technologists from 135 countries. Participants from 20 countries submitted more than 230 projects showcasing innovative ways to solve various social problems using AI. Intel Digital Readiness Programs are shared- responsibility, shared-values initiatives based on a public-private partnership model. In partnership with 30 governments and 30,000 institutions worldwide, we are committed to scale the program to reach more than 30 million people by 2030 with AI skills training for current and future jobs. Intel® Future Skills. Using a design-thinking methodology and hands-on learning, the Intel Future Skills program gives students the framework needed for a lifetime of problem solving and discovery through science, tech - nology, engineering, arts, and math (STEAM) learning. The program’s learning platform is made up of more than 25 projects and 40 hours of content, which challenges students and encourages them to them to think differently, fail fast, and develop a growth mindset. The model combines technical learning with social emotional learning and enables students to recognize and understand the people they are creating for by building essential empathy and communication skills. In 2021, we began providing all content online at no cost. In addition, Intel Employee Service Corps volunteers delivered first virtual Intel Future Skills Sports STEAM summer programs. Two camps were powered by the Olympic and Paralympic Program Office for 200 middle school girls from 35 US states and Puerto Rico, and a third camp, done in partnership with GirlUp, delivered a virtual Women in Science (WiSci) STEAM camp in Morocco for 100 high school girls. In 2022, in partnership with the Winter Paralympic Games, Intel will sponsor three fully accessible sports-themed Intel Future Skills camps for 200 middle school students with and without disabilities. National Q-12 Education Partnership. To support the quantum industries of the future, the White House Office of Science and Technology Policy and the National Science Foundation are spearheading the National Q-12 Education Partnership between the fed - eral government, industry, professional societies, and the education community. The goal is to foster training opportunities to increase the capabilities, diversity, and number of students who are prepared to engage in the quantum workforce. As a member of the partnership, Intel produced the “Adventures in Computing” video series to introduce STEM learners to the field of quan - tum computing through entertaining interviews with Intel women engineers and scientists. Dr. Eric Lander, US Presidential Science Advisor and White House Office of Science and Technology Policy director, highlighted the Q-12 Education Partnership as a great example of how companies are working together to engage students early and grow the American high-tech workforce by “not just cloning the people who are in it but expanding to include everybody in this country who wants to be part of it.“ Million Girls Moonshot Since 2017, the Intel Foundation has invested $4.65 million in grants supporting meaningful STEM experiences for middle school girls and their families. Building on proven results of those investments and the Intel® She Will Connect initiative, the Intel Foundation is partnering with other foundations and companies on the Million Girls Moonshot (MGM). MGM aims to reach and collectively engage 1 million more girls through innovative, high-quality STEM capacity in all 50 US states. In 2021, its first year since launch, MGM reached 160,000 girls across the US via 21,000 after-school and summer programs and more than 600 new STEM partnerships. Throughout the year, MGM engaged over 250 Intel volunteers, who provided 2,800 hours of service. One of the volunteers commented, “I am so grateful for the opportunity to make a positive impact on younger girls and encourage them to pursue education and careers in STEM fields. As a woman in STEM, and a woman of color at that, I believe it is import - ant to act as a positive role model for the next generation to prove that we can do it and we do belong in STEM!” The remarkable outcomes and impact of the MGM movement are captured in its Year 1 Evaluation Report . Introduction Our Business Responsible Sustainable Enabling Appendix Introduction Our Business Responsible Sustainable Enabling Appendix Inclusive Inclusive
63 intel.com/responsibility 2021-22 Corporate Responsibility Report Global Women in Science (WiSci) STEAM Camps. In collaboration with the United Nations Foundation Girl Up Initiative and the US Department of State’s Office of Global Partnerships, the Intel Foundation supports the Women in Science (WiSci) program, a unique global effort to bridge the gender gap in STEM fields through access to education, mentoring, and leadership training. In August 2021 and January 2022, WiSci Morocco and WiSci Central America, respectively, brought together nearly 300 camp participants from Morocco, Cote D’Ivoire, Panama, Costa Rica, and the US to participate in one- to two-week virtual STEAM camps. Many previous WiSci participants have gone on to pursue STEM fields in college and launched successful careers. In fact, based on a recent impact study, of all WiSci alumni pursuing higher education, 78% are studying STEAM subjects. Ileana Valdez’s amazing story is a powerful example of the lifelong impact that WiSci has on hundreds of girls. Empowering Women in AI. Women in AI at Intel are working with Women in AI (WAI) , a nonprofit work - ing toward inclusive AI that benefits global society to empower women and minorities as AI and data experts, innovators, and leaders. In 2021, Intel sponsored WAI’s three-day WaiHACKATHON USA , a summer program where attendees focused on advancing at least one of the 17 UN Sustainable Development Goals. Winners developed solutions using AI for autoimmune disease progression and targeted treatment; AI-powered sen - sors to ensure food chain transparency; and the use of VR and AI to encourage increased empathy, retention, and diversity in the workplace. Inclusion for Boys. In 2021, Intel invested over $150,000 to expand accessibility and inclusion for middle school boys of color through strategic partnerships with Big Brothers Big Sisters of America (BBBS) and the KIPP Foundation. Boys living in underserved communities often face multiple adverse challenges. BBBS offers a technology-enhanced mentoring program that provides support for boys to help them reach their full potential. The hybrid program enables quality mentoring to happen anytime, anywhere by combining in-person one-to-one meetings with communication through a secure, customizable digital platform. The platform is integrated with a match management system to serve middle school boys nationwide. The KIPP Foundation is committed to the academic achievement, economic stability, families, and com - munities of the students it serves. KIPP aims to inspire students to progress successfully from middle school to high school to college and, ultimately, to first jobs with competitive career paths in STEM fields. An Intel community grant is helping improve the implementation of the highly successful Amplify science curriculum and increase its adoption across the entire KIPP net - work of 113,000 students in 255 public charter schools in 20 US states and the District of Columbia. Amplify’s literacy-rich science curriculum provides a world-class science education while inviting students to explore phenomena with the purpose of solving real problems. STEM training for employability by Intel India engineers; 500 girl engineering students trained. Intel India is actively driving STEM training for girls in the ecosystem through various diversity and inclusion programs including BeingWISE (Women Innovators, Social Leaders, and Entrepreneurs), an industry-wide initiative to accelerate women’s participation in the workforce. Led by employees and run in collaboration with partners, the programs have positively impacted around 500 girl students in 2021 alone. Intel employee volunteers train and mentor girl students in STEM by conducting various technical and soft skills workshops, trainings and hackathons in collaboration with training partners like Do-It-Yourself Academy . Introduction Our Business Responsible Sustainable Enabling Appendix Introduction Our Business Responsible Sustainable Enabling Appendix Inclusive Inclusive
64 intel.com/responsibility 2021-22 Corporate Responsibility Report Sustainable Driving to the lowest possible environmental footprint as we grow helps us create efficiencies and respond to the needs of our stakeholders. We invest in conservation projects and set company-wide environmental targets, seeking to drive reductions in greenhouse gas emissions, energy use, water use, and waste generation. We also work with others to increase our “handprint”—the ways in which Intel® technologies can help others reduce their footprints. This year’s highlights Achieved net positive water in 3 countries In 2021, we conserved 9.3 billion gallons of water in our operations and enabled restoration of 2.3 billion gallons through watershed restoration projects. These achievements advanced us toward our goal of net positive water, resulting in 99% (by volume) of global fresh water treated and returned to communities or the environment and restored through watershed projects. We have achieved net positive water in three countries: the US, India, and Costa Rica. 80% green power globally In 2021, we maintained our renewable electricity supply at 100% in the US, Europe, Israel, and Malaysia, and achieved 80% renewable electricity globally. Over the last five years, we’ve purchased 30 billion kWh of renewable electricity, enough to power more than 2.8 million US households for one year. 1 5% total waste to landfill During 2021, we sent approximately 5% of our total waste to landfill and continue to work toward our goal of zero total waste to landfill by 2030. Through the end of 2021, circular economy practices were applied to 65% of our manufacturing waste streams via reuse, recovery, or recycling. 1 Based on average US household energy usage figures published by the US Energy Information Administration. Introduction Our Business Responsible Inclusive Sustainable Enabling Appendix
65 intel.com/responsibility 2021-22 Corporate Responsibility Report Sustainable: Our Approach Through conservation, strong collaborations, and application of technology, we have long worked to reduce the environmental impact of our operations. We have also partnered with governments, other companies, our suppliers, and nonprofits to help others reduce their own environmental impacts. Our 2030 RISE goals help answer the call for even more urgent action by expanding our efforts to achieve carbon neutral computing to further address climate change. Our 2030 goals include achieving net positive water, 100% renewable electricity, zero waste to landfill, and further reduction in our absolute greenhouse gas (GHG) emissions, even as we continue to expand our manufacturing capacity. Additionally, building on our 2030 goals, we recently announced our commitment to achieve net zero GHG for Scope 1 and 2, by 2040. Our strategy also includes creating a collective approach to reduce GHG emissions across the semiconductor industry, and increasing the use of technology to reduce climate impact. To achieve our 2030 sustainable chem - istry technology industry initiative, we have developed a unique methodology to calculate our manufacturing chemical footprint, which will be instrumental in helping us identify projects to soften that footprint. We recognize that solving the world’s environmental challenges requires broad, collective action—action that starts with individuals. For that reason, we have long encouraged our employees’ passion for the environment by supporting sustainability projects within the company, with customers and our local communities. Since 2008, we have also linked executive and employee compensation to corporate responsibility factors, including sustainability metrics related to energy and water conservation, waste reduction, and water restoration. We also seek to inspire others to create technology-based sustainability solutions. For example, Intel is the headline sponsor for InnovateFPGA , a global design contest that invites teams of students, makers, or engineers to develop field-programmable gate array (FPGA)-based solutions that reduce environmental impact. To learn more, see “ C ollaborating for Technology Impact “ in the Enabling section of this report. We believe that Intel’s position in the technology ecosystem, our wide range of technology, and the passion and expertise of our employees will enable us to form crit - ical partnerships, develop new approaches, and make significant progress over the next decade and beyond. Our commitment to renewable electricity includes an array of wind micro-turbines atop Intel's worldwide headquarters in Santa Clara, California. 2030 RISE: Sustainable Goals, Initiatives, and Global Challenges Global Challenge: Achieve carbon neutral computing to address climate change. Technology Industry Initiatives: Sustainable Manufacturing. Create a collective approach to reducing emissions for the semiconductor manufacturing industry and increase the use of technology to reduce climate impact in global manufacturing. Sustainable Chemistry. Enable greener and circular chemistry strategies across the technology industry value chain by transforming chemical footprint methodology. Operational and Supply Chain Goals: 100% Green Power. Achieve 100% renewable electricity use across our global manufacturing operations. Energy Conservation. Conserve 4 billion kWh of energy. Emissions Reductions. Drive a 10% reduction in our absolute Scope 1 and 2 GHG emissions as we grow, informed by climate science. Product Energy Efficiency. Increase product energy efficiency 10x for Intel client and server microprocessors to reduce our Scope 3 emissions. Net Positive Water. Achieve net positive water—by conserving 60 billion gallons of water and funding external water restoration projects. Zero Waste to Landfill. Achieve zero waste to landfill and implement circular economy strategies for 60% of our manufacturing waste streams in partnership with our suppliers. Introduction Our Business Responsible Inclusive Sustainable Enabling Appendix
66 intel.com/responsibility 2021-22 Corporate Responsibility Report Environmental Management Unlike many companies in the electronics industry that outsource their production, we manufacture the majority of our products in our own wafer fabrication facilities. As a result, Intel’s direct environmental footprint is more significant than those of our “fab-less” competitors, whose manufacturing footprints sit in their supply chains. This business model also gives us a unique advantage when it comes to integrating sustainable practices within production, as we have direct control over manufacturing processes. Governance and Management The Intel Code of Conduct , Climate Change Policy , Global Water Policy , Energy Policy , and Environmental, Health, and Safety Policy guide our sustainability strategy and help us set goals. We consider environmental impact when we select sites, design buildings, set performance levels for manufacturing tools, and establish goals for production processes. For over a decade, Intel has maintained multi-site, third-party-verified International Organization for Standardization (ISO) 14001 registration to evaluate the effectiveness of our environmental management system. Our Corporate Energy Management System follows the ISO 50001 Energy Management Standard; to date, we have received third-party ISO 50001 accred - itation for all of our manufacturing sites. To minimize our emissions of particulate matter (PM) including PM less than 2.5 microns (PM 2.5 ), volatile organic compounds (VOCs), hazardous air pollutants (HAPs), nitrogen oxides (NOx), and carbon monoxide (CO), we use emissions reduction strategies, including abatement equipment such as rotary concentrator thermal oxidizers, wet electrostatic precipitators, wet scrubbers, and ultra-low NOx burners. We also conduct regular environmental, health, and safety (EHS) program self-assessments to validate EHS compliance at the individual site level. In addition, our senior global EHS professionals partner with legal counsel to complete internal audits related to compli - ance, management systems, and business risk at various Intel sites. The audits include in-depth documentation and records reviews, interviews with site leadership, and physical inspections related to EHS compliance. Key to our chemical management strategy is a compre - hensive review of materials, which starts with a regulatory search of all applicable chemical regulations and use restrictions. The search includes Intel-specific restrictions (which often go beyond regulatory requirements), and local and global regulations. We then identify the environ - mental and safety controls needed to protect personnel and the environment during a chemical’s intended use. In 2021, we launched new chemical management soft - ware systems to improve employee access to hazard information and increase the efficiency and quality of EHS review of new chemical introductions that also includes a review of our chemical suppliers’ regulatory obligations. On an annual basis, we report Intel’s emissions, waste transfers off-site, and treatment of reportable chemicals in the countries where Intel operates in accordance with local and national regulations, such as those set by the US Environmental Protection Agency (EPA). To better understand how Intel compares to others in our industry, we regularly benchmark our environmental performance with semiconductor and other large compa - nies. To build a supportive policy environment for private sector leadership on climate change, Intel participates in organizations such as the Center for Climate and Energy Solutions , the American Council for an Energy- Efficient Economy , and the Alliance to Save Energy . We also engage our main suppliers on sustainability issues to help them reduce their climate and water impacts, reduce waste and identify circular solutions, advance green chemistry and footprinting practices, and identify collaboration opportunities. To learn more, see “ Public Policy and Political Accountability ” and “ Supply Chain Responsibility ” in the Our Business section of this report. EHS Compliance Reporting Data Year Number of NOVs Fines or Fees 2017 11 $8,075 2018 8 $1,600 2019 7 $400 2020 9 $7,086 2021 9 $2,100 In 2021, government officials made 152 visits (including audits and inspections) to Intel sites across the globe, including 54 health and safety agency inspections, 28 fire protection agency inspections, and 70 environmental agency inspections. Details on Notices of Violations (NOVs) are provided in the Appendix of this report, and previous NOV data can be accessed on our Report Builder website. Senior management reviews all NOVs to ensure that root cause corrective actions for all identified concerns are put in place and tracked to completion. Intel’s Leixlip campus in Ireland. Introduction Our Business Responsible Inclusive Sustainable Enabling Appendix
67 intel.com/responsibility 2021-22 Corporate Responsibility Report Smart and Green Building Practices Our engineers have long incorporated green design into the new construction and renovation of our facilities, which helps us achieve efficiencies in energy consumption, water use, and recycling. We also partner with companies and nonprofits to expand the number of manufacturers implementing green building practices. We have achieved LEED® green building certification for more than 17.9 million square feet of space in 50 buildings. Our new factories and office buildings incor - porate many heat recovery and water conservation and recovery technologies. Currently Intel has several new buildings and site expansions going through the LEED certification process. As part of our recent net zero GHG announcement , we committed to build our new factories to LEED standards. Intel also partners with a robust ecosystem of equipment manufacturers and systems integrators to deliver a new generation of smart building solutions built on interop - erable, secure, and scalable Internet of Things technolo - gies and advanced data analytics—at the network edge. Read more about smart buildings with Intel® Internet of Things technologies. Product Ecology Intel’s vision is to avoid the use of substances in our products that could harm the environment or human health, and to ensure that we act responsibly and with caution. Intel product material restrictions are based on consideration for legal requirements, international trea - ties and conventions, and specific market requirements. For more than a decade, we have collaborated with suppliers and customers to work toward eliminating hazardous substances such as lead and halogenated flame retardants from our products. While legislation does not require the elimination of halogenated flame retardants in all electronic components, Intel has played a role in facilitating industry consensus around low-halogen practices. We engage with industry com - mittees on the development of materials declaration, test methods, and eco-design standards. Intel leads several global environmental regulations influencing and harmonization efforts within multiple industry trade associations. We also meet the requirements of the European Union’s Registration, Evaluation, Authorization, and Restriction of Chemicals ( REACH ) regulation and comply with applicable product ecology regulations. When hazardous substances are included within our products, we take steps to ensure that they are handled safely from the time they enter our operations until they are properly disposed of or recycled. Managing electronic waste (e-waste) such as computers, monitors, and phones is a global concern. Most of our products—including motherboards, microprocessors, and other components—fall within the scope of e-waste laws when they are incorporated into a final product, generally by an original equipment manufacturer (OEM). As such, we work with OEMs, retailers, customers, and others to identify shared solutions for used electronics. We also take steps to integrate environmen - tal considerations into the design of our products to minimize environmental impacts of electronics at their end of life. Intel supports the development of green procurement standards and tools such as EPEAT and other eco-design directives. These eco-design standards, directives, and tools are designed to help purchasers in the public and private sectors evaluate, compare, and select electronic products based on environmental leadership and corpo - rate social responsibility attributes. Linking Compensation and Financing to Environmental Performance Since 2008, we have linked a portion of executive and employee compensation to corporate responsibility factors. Our 2021 bonus incorporated environmental-related metrics aligned to our 2030 goals, including conserving more than 7.5 billion gallons of water in our operations, restoring more than 1.5 billion gallons of water to our local watersheds, and conserving 125 million kWh of energy. We exceeded each of the targets, conserving 9.3 billion gallons and restoring 2.3 billion gallons of water, and conserving 162 million kWh of energy globally. In 2022, environmental metrics include achieving 90% renewable electricity globally, conserving 8.5 billion gallons of water in our operations, and restoring 2.5 billion gallons of water to local watersheds. For more information, see our 2022 Proxy Statement . In 2021, we also integrated sustainability metrics into our financing activities for the first time. We entered into a $5 billion, five-year variable-rate revolving credit facility which, if drawn, is expected to be used for general corporate purposes. The interest rate is subject to adjustment if we achieve, or fail to achieve, certain annual energy and water conservation targets established to maintain our progress toward our 2030 corporate responsibility goals on energy and water. In 2021, for the second consecutive year, we achieved these targets. Introduction Our Business Responsible Inclusive Sustainable Enabling Appendix
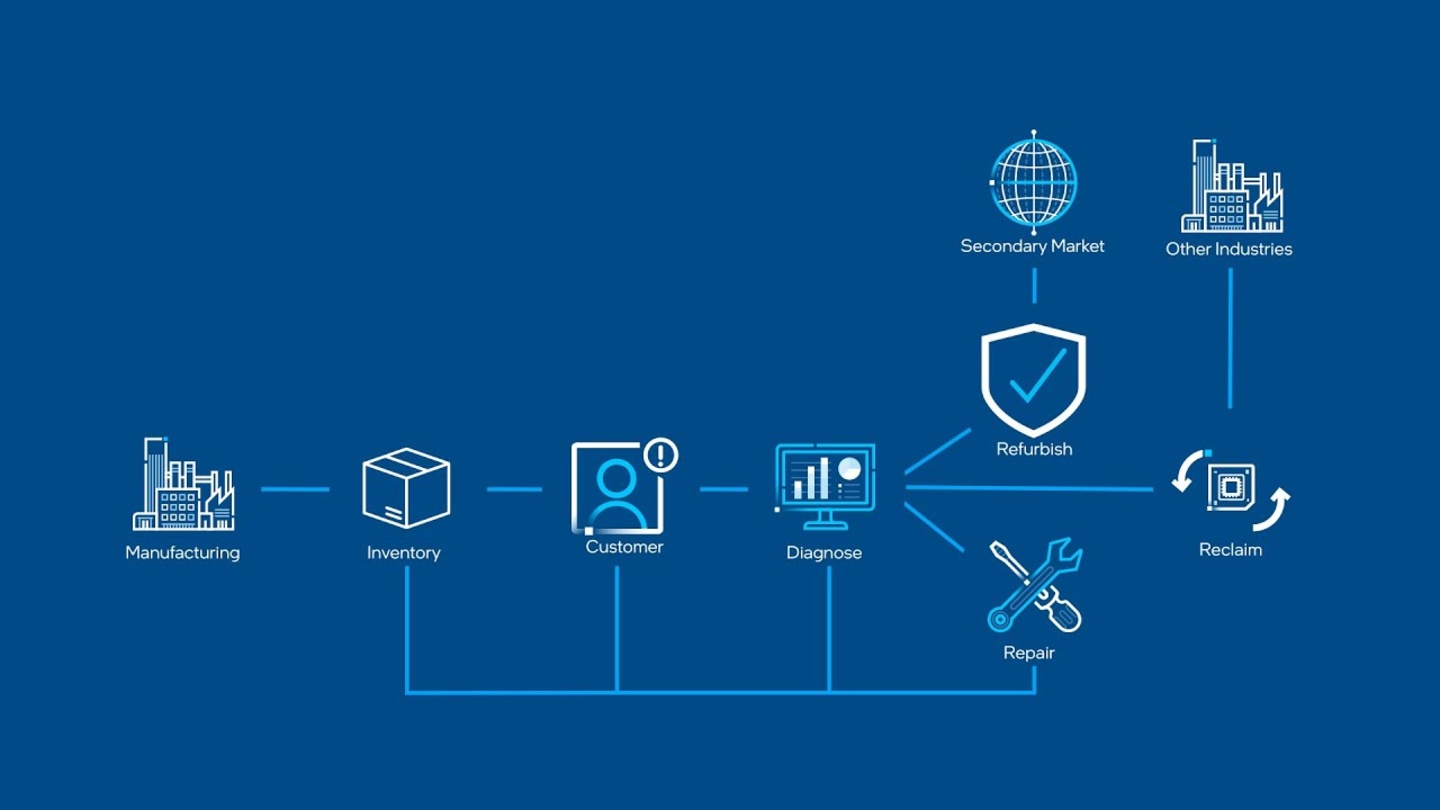
68 intel.com/responsibility 2021-22 Corporate Responsibility Report Climate and Energy Climate change is a serious environmental, economic, and social challenge. We focus on reducing our own climate impact—the emissions resulting from our own operations, our supply chain, and the marketing and use of our products. We also work to identify ways that Intel technology can help others reduce their climate impacts. Our Climate Change Policy outlines our formal position on climate change and our policy advocacy principles. Reducing Our Operational Carbon Footprint For over two decades, Intel has set aggressive green - house gas (GHG) reduction goals to conserve energy and minimize GHG emissions. We have invested in GHG reductions, including chemical substitution, abatement, energy conservation, process optimization, and renewable and alternative electricity. As a result of these actions, we have avoided nearly 75% of our cumu - lative Scope 1 and 2 emissions over the last decade. We collaborate with others in the semiconductor and other manufacturing industries to identify new and innovative approaches to reduce emissions. For more information, see “ Sustainable Manufacturing and Chemistry Initiatives ” later in this section. Energy Conservation Reducing operational energy use is core to Intel’s overall climate strategy and our 2030 goals. Cumulatively we conserved approximately 486 million kWh of electricity from the 2020 baseline through the end of 2021 toward our 4 billion kWh goal, resulting in cumulative savings of more than $30 million. Our energy management systems follow the international ISO 50001 Energy Management System standard. Although energy conservation opportunities are present across the spectrum of Intel’s manufacturing operations, we have identified strategic investment areas in efficient lighting, chilled water cooling, compressed air, and heat recovery and electrification. Read the blog . Energy Use Our 2021 absolute energy use increased 9% compared to 2020 due to bringing new tools online and the additional complexity of newer technologies. In 2021, approximately 83% of our global energy use was electricity. Electricity Diesel Fuel Natural Gas/Liquefied Petroleum Gas 4 2 6 8 10 12 0 2021 Billion Kilowatt – Hours 2017 2018 2019 2020 1.6 0.02 6.7 1.8 0.01 7.8 1.8 0.01 8.8 2.0 0.01 9.6 5.9 1.4 0.01 2030 Goal: Energy Conservation Description. Achieve cumulative electricity savings of 4 billion kWh from 2020 to 2030. Baseline. Progress measured from baseline of Jan. 1, 2020. Progress in 2021. In 2021, we invested in projects that enabled us to conserve approximately 162 million kWh of electricity. We have conserved a cumulative total of 486 million kWh of electricity since the base - line date. Looking Ahead. In 2022, we plan to continue to invest in new and innovative projects that will conserve an additional 100 million kWh of electricity. Alignment with TCFD We are committed to transparency around our carbon footprint and climate risk and use the framework developed by the Task Force on Climate-Related Financial Disclosures (TCFD) to inform our disclosure on climate governance, strategy, risk management, and metrics and targets. For governance and strategy, we follow an integrated approach to addressing climate change, with multiple teams responsible for managing climate-related activities, initiatives, and policies, including manufacturing and operations, government and public affairs, supply chain, and product teams. Senior executives and the Board’s Corporate Governance and Nominating Committee review strategies and progress toward goals. We describe our overall risk management processes in our 2022 Proxy Statement , and we describe our climate-related risks and opportunities in this report; our Climate Change Policy ; “Risk Factors” within of our 2021 Annual Report on Form 10-K ; and in our most recent CDP Climate Change survey, which is available on our Report Builder website. We employ a variety of climate-related assessments and scenarios across multiple aspects of our business. In 2021, subject matter experts from multiple business groups partnered to further drive the integration of climate change considerations into our processes for assess - ing risks and opportunities and to conduct a climate change scenario analysis. A more detailed mapping of our climate disclosures aligned with the TCFD and Sustainability Accounting Standards Board (SASB) framework is included in the Appendix. Introduction Our Business Responsible Inclusive Sustainable Enabling Appendix
69 intel.com/responsibility 2021-22 Corporate Responsibility Report 2030 Goal: Scope 1 and 2 GHG Emissions Description. Drive a 10% reduction in our absolute Scope 1 and 2 GHG emissions from 2020 to 2030. Baseline. Progress measured as percent reduction from our calendar year 2019 emissions. Our combined Scope 1 and Scope 2 GHG emissions in 2019 were 2.88 million metric tons of CO 2 e. Progress in 2021. During 2021, our Scope 1 and 2 emissions increased by approximately 14% from the 2019 baseline. Looking Ahead. In 2022, we will continue to take action to reduce emissions through abatement, investments in renewable electricity, process and equipment optimization, and energy conservation. In addition to this 2030 goal, in April 2022 we announced a new commitment to reach net zero Scope 1 and 2 GHG emissions by 2040. Next year we will begin reporting progress toward both the 2030 and 2040 commitments. Scope 1 + 2 GHG Emissions Our combined Scope 1 (direct) and Scope 2 (indirect) GHG emissions increased by approximately 14% on an absolute basis in 2021 from the 2019 baseline, driven by the complexity of current manufacturing process technologies. Scope 1: Perfluorocarbons (PFCs) Scope 2 (Electricity – Market Based) Scope 1: Combustion Scope 1: Other 1 0.5 1.5 2 2.5 3 0 2021 Million Metric Tons C O 2 e 2017 2018 2019 2020 0.52 0.26 0.72 0.97 0.69 0.30 0.47 1.12 0.70 0.33 0.55 1.30 0.68 0.91 0.34 0.96 0.70 1.12 0.37 1.10 Intel’s GHG Emissions—Where Are We Headed? For over two decades, we have tracked our Scope 1 and Scope 2 emissions against a science-based reduction target of 80% from 2000 levels by 2050. In recent years, our absolute GHG emissions have increased due to significant growth and complexity of our current manufacturing process technologies. Since 2000, our Scope 1 and 2 emissions have decreased by about 19% on an absolute basis, even as we expanded our manufacturing capacity significantly. We are committed to driving reductions through our 2030 RISE goals and our recently announced commitment to reach net zero GHGs for Scope 1 and 2 by 2040, as well as through collaboration with others in the semiconductor and other manufacturing industries. For more information, see ‘‘ Sustainable Manufacturing and Chemistry Initiatives “ later in this section. Our emissions calculations are based on Global Reporting Initiative Standards, the World Resources Institute/World Business Council for Sustainable Development’s The Greenhouse Gas Protocol: A Corporate Accounting and Reporting Standard, and internal criteria defined by Intel management. Additional GHG emissions reporting is publicly available in our CDP questionnaire response on our Report Builder website. 3 1 Scope 1+2 GHG Emissions Million Metric Tons CO 2 e 4 2 2030 2010 2020 2000 IPCC Reduction Target (80% from 2020) Scope 1+ 2 GHG (Market-Based) Emissions Cooling system at Intel’s Mission Campus in Santa Clara, California. Introduction Our Business Responsible Inclusive Sustainable Enabling Appendix
70 intel.com/responsibility 2021-22 Corporate Responsibility Report 2021 GHG Emissions Reported by Category (metric tons of CO 2 e) Scope Emissions Notes Scope 1 (Direct) Emissions 2,181,000 Manufacturing process, onsite fuel combustion, refrigerants, onsite fleet/ air travel. Scope 2 (Indirect, Electricity) 1,093,000 Market-based method; 2 includes renewable electricity purchases. Scope 1 and 2 Total 3,274,000 Scope 3 Total 28,863,000 Indirect/value chain. Leased Vehicles and Commuting 289,000 Employee leased vehicles and commuting. Logistics and Distribution 207,000 Upstream and downstream transport and distribution. 3 Employee Business Travel 12,000 Air travel, car rentals, and hotel stays. Supply Chain 4,924,000 Represents the 2022 estimate based on key suppliers’ 2021 CDP Climate Change Questionnaire information. Capital Goods 141,000 Extraction, production, and transport of capital goods purchased. Fuel and Energy Related Activities 121,000 Impacts related to extraction, production, and transportation of fuels and energy purchased, not already included in Scope 1 or 2. Market-based method. 4 Waste Generated in Operations 60,000 Disposal and treatment of waste generated in our operations. Product Energy Usage 22,903,000 Represents the GHG emissions of the product lifetime (5,264,000 metric tons of CO 2 e annualized). Includes consideration of cloud service provider publicly reported use of renewable electricity in data centers. 5 Processing of Sold Products 206,000 Processing of intermediate products sold to down-stream manufacturers. 2 Location-based method Scope 2 emissions (does not account for any renewable electricity purchases) = 3,820,000 metric tons CO 2 e/year. 3 Upstream portion = 85,000 metric tons; downstream portion = 122,000. 4 Market-based method includes renewable purchases. Location-based method emissions (does not account for any renewable electricity purchases) = 298,000 metric tons of CO 2 e/year. 5 Lifetime and annual product energy usage emissions without consideration of customer renewable electricity are 32,632,000 and 7,475,000 metric tons CO 2 e, respectively. Renewable and Alternative Electricity In addition to conserving energy, we pur - chase green power and operate on-site alternative electricity projects that provide power directly to Intel buildings. Over the last five years, Intel’s renewable electricity supply and renewable electricity attribute purchases have totaled more than 30 billion kWh, enough to power more than 2.8 million US households for one year. 6 Over the last decade, Intel’s on-site alterna - tive and renewable electricity installations and our installed capacity have grown exponentially. We now have more than 100 alternative and renewable electricity installations with capacity of more than 50,000 kW across 23 Intel campuses, with an additional 15 installations under construction. These installations use 22 different technology applications, such as solar hot and cooling water systems, solar electric photovoltaic-covered parking lots, and mini bio-energy, geothermal energy, and micro wind turbine array systems. These on-site projects, which include pilots of innovative technology applications, help us displace grid-supplied, carbon- intensive electricity sources and identify future installation and technology opportuni - ties for both Intel and the broader alternative and renewable electricity market. When installed, our projects are often the largest corporate on-site projects of their type in a country or region. 6 Based on average US household energy usage figures published by the US Energy Information Administration . 2030 Goal: Renewable Electricity Description. Achieve 100% renewable electricity across our global operations, including manufacturing. Baseline. During 2020, we had reached 100% renewable electricity in our US and European operations, 50% for our Israel operations, and 71% globally. Progress in 2021. We continued our 100% renewable electricity commitment for our US, Europe, Israel and Malaysia operations, and achieved 80% globally by the end of 2021. Looking Ahead. We will continue to explore additional locations to increase renewable electricity. For more than a decade, Intel has been one of the top voluntary corporate purchasers of green power in the US EPA’s Green Power Partnership (GPP) program. In addition to generating on-site and off-site renewable electricity and purchasing renewable electricity from our utility suppliers, we purchase green attributes from multiple sources of generation. These include wind, solar, hydroelectric, and geothermal, which are certified and verified by nonprofit validation accreditors such as the Center for Resource Solutions’ Green-e program to meet GPP program requirements. Our approach to renewable and alternative electricity investments has been to reduce our own carbon foot - print while encouraging others to take similar actions. We are encouraged by actions we have seen over the past decade—by companies, investors, utilities, and governments—to increase commitments and invest - ments in renewable energy supplies and apply new technologies. Introduction Our Business Responsible Inclusive Sustainable Enabling Appendix
71 intel.com/responsibility 2021-22 Corporate Responsibility Report Product Energy Efficiency Each new generation of products offers higher perfor - mance and improved energy efficiency compared to previous generations. Building energy efficiency into our products not only reduces our Scope 3 GHG emissions, but also presents an opportunity to create value for our customers by helping them lower their Scope 2 GHG emissions, energy use, and overall environmental impact. In 2021, we launched 12th Generation Intel® Core™ pro - cessors for desktop and notebook computers, with hybrid architecture comprising performance cores and efficient cores. Performance boost 1 with hybrid technology will lead to higher performance per watt in client products, helping us meet our 2030 10X product efficiency goals. During 2021, we continued our work on energy-efficiency initiatives and have made substantial progress in replacing traditional system sleep and idle states with Modern Standby. Intel maintained 100% adoption of Modern Standby on notebook PC designs using 12th Generation Intel Core processors (ADL-P and ADL-U). The transition of desktop PCs to Modern Standby ramped in 2021 with a doubling of design wins through ecosystem partnerships. Intel collaborated with the technology industry to enable customers to successfully transition to Tier-2 specifications of California Energy Commission (CEC) computers standard (approximately 15% annual PC energy use reduction). We also worked with industry partners and the Consumer Technology Association to influence US computer and display standards to align with the existing CEC standards and future CEC revi - sions. This alignment is critical to prevent a patchwork of state-level certification requirements. Working with the European Commission and other stakeholders on EU Lot 3 Computers regulation revision, Intel continued to make progress with DIGITALEUROPE on new software tools for PC active mode energy-efficiency labeling recom - mendations. We also worked with government policy makers In South Korea to influence the direction of the new version of computer standard. For server energy efficiency, Intel collaborated with technology industry consortia and European Standard - ization Organizations to support development of new harmonized standards in support of EU Lot 9 server regulation already in effect. We also contributed to server energy-efficiency standards initiatives in the UK and India. In China, as part of industry consortia we are working with China National Institute of Standardization to agree on a workable solution for SPEC® SERT® suite and China’s indigenous benchmark tool (BenchSEE) to co-exist, in order to comply with China’s upcoming server energy- efficiency standard. We have estimated the GHG emissions due to energy consumption by Intel® processors sold in 2021. The annual and lifetime emissions of Intel processors when used in customers’ compute applications (i.e., server, desktop, notebook, and workstation) equate to approximately 5,264,000 and 22,903,000 metric tons of CO 2 e, respectively. The decrease in annual and lifetime emissions compared with 2020 is driven primarily by significant improvements in our server CPU calculation methodology for product energy usage and associated GHG emissions. Refine - ments for 2021 included incorporating both enterprise and cloud data center models. While there was no change to traditional enterprise data center methodology, the cloud data center model required significant refinement to CPU percent average active power in line with CPU usages in today’s data centers. Further refinements for 2021 included accounting for the emissions reduction impacts of the use of renewable electricity by our cust- omers. Specifically, calculations included consideration of cloud service provider publicly reported use of renewable electricity in data centers. Yearly emissions due to energy consumption of Intel processors are expected to trend downwards as our customers further adopt renewable electricity initiatives and goals. Net lifetime emissions after accounting for renewable electricity is going down, even with higher percent average active power in cloud data centers. For more information, see “ Achieving Carbon Neutral Computing ” later in this section. 2030 Goal: Product Energy Efficiency Description. Increase product energy efficiency 10X for Intel client and server microprocessors to reduce our Scope 3 emissions. Baseline. Progress on the client component of our product energy efficiency goal is measured using SPEC® CPU2017 Integer Rate benchmark and Display On Idle Power using an end of 2019 baseline. Desktop and notebook product efficiencies will be reported together as a single number through a weighted average of desktop and notebook pro - cessor sales volumes. Progress on the data center component of our product energy efficiency goal is measured using SPEC® Server Efficiency Rating Tool (SERT®) suite 2 on Intel and/or OEM commercial systems, using an end of 2019 baseline. Progress in 2021. Client product energy efficiency is slightly behind goal. In 2021, we released our 12th Generation Intel® Core™ processors, which achieved 2X improvement in product energy efficiency vs. 2019 baseline but fell slightly short of our aggressive internal goal of 2.3X. Server product energy efficiency is slightly behind goal. In 2021, we released our 3rd Generation Intel® Xeon® Scalable processors, which achieved 1.48X improvement in product energy efficiency vs. 2019 baseline but fell slightly short of the 1.53X internal goal that provides a linear path to 10X by 2030. Looking Ahead. For 2022, we plan to report on server progress toward the 2030 goals based on soon-to-be released 4th Generation Intel® Xeon® Scalable processors (code-named “Sapphire Rapids”) and client progress based on our next-generation processor code-named “ Raptor Lake . ” 1 https://download.intel.com/newsroom/2021/manufacturing/12th- Gen-Blueprint-Series-Presentation.pdf 2 SPEC and SERT are registered trademarks of the Standard Performance Evaluation Corporation (SPEC). Introduction Our Business Responsible Inclusive Sustainable Enabling Appendix
72 intel.com/responsibility 2021-22 Corporate Responsibility Report Water Stewardship Semiconductor fabrication requires significant water use. By responsibly managing our water use, guided by our Global Water Policy , we can meet our business needs, as well as those of our communities. In 2021, we returned and restored approximately 99% 1 (by volume) of our fresh water withdrawals to our communities through efficient water management, water reuse, and project funding that enabled water restoration in local watersheds. Our water strategy has three main objectives: conserve water used in our operations, collaborate on water ini - tiatives with local communities, and create technology solutions to help others reinvent how they use and conserve water. As a part of our 2030 RISE goals, we aim to achieve net positive water by conserving 60 billion gallons of water (cumulative from 2020) and funding water projects that will restore more fresh water than we consume to our local watersheds. We estimate that our water conservation efforts saved approximately 9.3 billion gallons of water in 2021. We also completed new projects in 2021 that we estimate will save more than 1.6 billion gallons annually, once operational. Over the last 10 years, our water conserva - tion efforts have saved approximately 44 billion gallons of water, enough to sustain about 400,000 US homes for one year. 2 During 2021, we continued to fund water restoration projects benefiting the watersheds that we impact and the communities where we operate, including new proj - ects in Arizona, New Mexico, Ireland, Malaysia, and India. See details about our detailed water footprint and water risk assessment by location in the Appendix. Additional information is also available in our most recent CDP Water Security report posted on our Report Builder website. 1 Water returned (12.0) + water restored (2.3)/water withdrawal (14.3) = 99% (small rounding difference). 2 Based on average US household water usage figures published by the US Environmental Protection Agency . Water Usage and Conservation Our 2021 absolute fresh water use increased 3% as we continued to bring tools online and the complexity of newer technologies grew. We increased our water conservation from 2020 to 2021 by about 31%, and increased 114% in the last two years, due to significant investments in water conservation projects. We define water withdrawals, or water usage, as total gallons of incoming fresh water used. “Operations” includes all manufacturing and non-manufacturing sites with 2,000 or more employees where Intel has operational control. 11.1 3.5 12.0 4.4 12.6 4.4 13.8 7.1 14.3 9.3 Water Conserved Water Withdrawals (Usage) 12 0 Billions of Gallons 18 6 2021 2017 2019 2020 2018 Normalized Production Index (Year 2017 = 100) Net Positive Water 2030 Goal: Net Positive Water Description. Achieve net positive water by conserving 60 billion gallons of water and funding water restoration projects that restore more fresh water than we consume to our local watersheds. Net positive water is defined as water returned through water management practices, plus water restored to local watersheds, equivalent to >100% of our freshwater consumption. Baseline. Progress measured from baseline of Jan. 1, 2020. Progress in 2021. During 2021 we conserved 9.3 billion gallons of water and more than 16 billion gallons cumula - tively from the 2020 baseline. In addition, Intel- enabled projects restored 2.3 billion gallons of water to our watersheds. As a result, we have achieved 99% toward our net positive water globally, and reached net positive water in three countries: the US, India, and Costa Rica. These achievements advanced us toward our 2030 goal of net positive water, resulting in 99% 1 (by volume) of our fresh water usage that was returned and restored, and significant progress toward our goal to conserve 60 billion gallons of water by 2030. Looking Ahead. In 2022 we expect to conserve 8.5 3 billion gallons of water in our operations and commu - nity partnerships, and enable restoration of 2.5 billion gallons of water to local watersheds. 3 Our 2022 target was set based on the exclusion of water savings at our Dalian, China manufacturing site. The Dalian site was sold subsequent to year-end 2021 as part of the first closing of the divestiture of our NAND Memory business. 77% 85% 87% 90% 8.6 1.8 1.4 1.3 2.5 2.4 9.9 10.2 11.1 99% 0.1 12.0 2.3 0.3 0.7 Water Restored (Watershed Projects) Remaining Gap (Water Consumption) Net Positive Water Progress (% Returned + Restored) Water Returned (Site Discharge) 12.0 – Billions of Gallons of Fresh Water 16.0 8.0 4.0 75% –% 100% 50% 25% 2021 2017 2019 2020 2018 Introduction Our Business Responsible Inclusive Sustainable Enabling Appendix
73 intel.com/responsibility 2021-22 Corporate Responsibility Report Water Conservation and Restoration Below are examples of water conservation and restoration projects Intel recently implemented or funded as part of our commitment to achieve net positive water: We implemented ultra-pure water efficiency projects in our factories by optimizing recipe flows and reducing or eliminating bypass flows. After successfully piloting these reduction projects at our Ronler Acres facility in Oregon, we are implementing similar projects at our other factory sites. Total savings of 256 million gallons were achieved during 2021. We estimate that we will save 450 million gallons in 2022, increasing to over 700 million gallons per year by 2025. During 2021, we made significant progress in the operation of our on-site water reclaim facilities. These innovative water treatment plants allow Intel to treat and reuse water within our operations in systems such as cooling towers and scrubbers, resulting in a substan - tial increase in water conservation. Our Ocotillo water recycling facility in Arizona , for example, treated and reused approximately 1.1 billion gallons of water during 2021. Wicklow Mountains National Park Blanket Bog Restoration Project – National Parks and Wildlife Service. Intel’s first water restoration project in Ireland is a pilot project that will re-wet close to 150 acres of degraded peat bog to increase water storage levels by an estimated 13 million gallons each year. These headwaters supply the Poulaphouca (Blessington) reservoir, a drinking water source for the greater Dublin area. The bog restoration will also protect biodiversity and improve carbon storage, and is likely to improve water quality. Upon completion of the pilot, the resulting data will be used to evaluate a full-scale peat bog restoration effort. Agua Tica Forest Protection – Fundecor. This project, which is expected to restore up to 46 million gallons of water per year, aims to promote water restoration through innovative forest protection schemes in Agua Tica’s action area. Agua Tica is the first public-private water fund established in Costa Rica with the purpose of improving water quality and quantity access through a green infrastructure investment portfolio. Landown - ers are compensated for the environmental services of their properties and incentivized to avoid conversion of existing forests to a more degraded condition, enabling activities such as natural and assisted regeneration, sus - tainable agricultural practices, environmental education, agroforestry systems, and reforestation. 15-Mile Reach 2021 Flow Restoration – Colorado Water Trust. This project in the Colorado River basin, which restored an estimated 226 million gallons of water in 2021, facilitates an agreement to lease water and pass additional flow downstream and through hydropower turbines to enhance flows in the 15-Mile Reach. The leased flows support fish and wildlife, and also benefit conditions upstream on the Fryingpan and Roaring Fork Rivers. As a further benefit, this flow is used by a hydroelectric power plant. For more information on these and other projects, visit our Water Restoration website. Through conservation and Intel- enabled restoration projects, we have achieved 99% (by volumne) toward our net positive water globally, including net positive water in three countries: the US, India, and Costa Rica. Intel and the National Parks and Wildlife Service launched a blanket bog restoration project in the Wicklow Mountains National Park. This is Intel’s first water restoration project in Ireland. 15-Mile Reach 2021 Flow Restoration in the Colorado River watershed, supporting Arizona’s water resources. An Intel-supported project aims to promote water restoration in Costa Rica through innovative forest protection schemes. Introduction Our Business Responsible Inclusive Sustainable Enabling Appendix
74 intel.com/responsibility 2021-22 Corporate Responsibility Report Waste and Circular Economy Solutions Much of the waste we generate results from construction and manufacturing activities. Since the mid-1990s, we have increased our global recycling rate of non- hazardous waste from 25% to 89% even while Intel’s business and production continued to grow. We also decreased our total waste generation by 17% between 2020 and 2021, despite increased manufacturing complexity and company growth. As part of our 2030 goals, we have expanded our commitment to achieve zero total waste to landfill, and increased our focus on implementing circular economy strategies for our manufacturing waste streams. Circular Solutions for Manufacturing Waste Major semiconductor manufacturing-related waste streams include lithography-related solvents, metal plating waste, specialty base cleaners, spent sulfuric acid, ammonium sulfate, and calcium fluoride. Our operations also generate plastic, metal, kitchen, and general office waste. We continue to find ways to recover materials and regenerate resources to create circular economy solutions that reduce costs and environmental impact. In 2021, we reused, recovered, or recycled 65% of our manufacturing waste, or approximately 133,000 metric tons. Intel is investing in segregating constituents of our spent solvent waste to enable our waste vendors to more easily refine the high-value solvent and reintro - duce it into the merchant market as a replacement raw material. This will also decrease the fossil fuel combustion required for the distillation process by over 50%, leading to a reduction in GHG emissions at the waste vendor’s facility. We also send sulfuric acid waste from our manufacturing operations to an off-site facility, where it is processed to technical grade sulfuric acid. It is then directed back to our manufacturing operations, where we use it in on-site wastewater treatment systems. 2030 Goal: Zero Waste 1 /Circular Economy Description. Achieve zero total waste to landfill and implement circular economy strategies for 60% of our manufac - turing waste streams in partnership with our suppliers. Baseline. During 2020, 5% of our total waste went to landfill, and we had implemented circular economy strategies for 65% of manufacturing waste. Progress in 2021. By the end of 2021, we maintained 5% total waste to landfill and implemented circular strategies for 65% of our manufacturing waste. Our 2030 goal of 60% will be challenging in future years given our projected growth and new waste streams, suppliers, and locations that will require new circular economy strategies. Looking Ahead. In 2022, we plan to continue to focus on opportunities to upcycle waste by working further on waste segregation practices and collaborating with our suppliers to evaluate new technology for waste recovery and reuse. 1 Intel defines zero waste to landfill as less than 1%. Total Waste Generated and % to Landfill Our 2030 total waste definition includes hazardous waste and non- hazardous solid waste, as well as non-hazardous liquid waste and chemical debris. In line with common waste reporting practices, we do not include salts and biosolids from our on-site water reclaim facilities in Israel, Oregon, and Arizona. % Total Waste Sent to Landfill Total Waste Generated 240 0 Thousands of Metric Tons 360 120 2020 2021 2018 2019 2017 480 183 205 387 344 414 7% 3% 5% 9% 5% Circular Solutions for Manufacturing Waste Streams In 2021, 79% of Intel’s manufacturing waste was fuel blended, recycled, reused, or recovered. Manufacturing waste represented 59% of our total waste in 2021, and included hazardous and non-hazardous waste associated with wafer manufacturing. For our circular solutions strategy, we follow the Ellen McArthur Foundation definition of circular economy and upcycling of waste. Upcycling is defined as keeping products and materials in use via reuse, resale, repurposing, and recycling. It includes recovering and restoring products, components, and materials through strategies like reuse, repair, remanufacturing, use as feedstock, and recycling. It does not include fuel blending unless it is done after recovery of a major constituent of the waste stream. 26% Re-use 30% Recovered 9% Recycled 14% Fuel Blended 7% Treatment 11% Incineration 3% Landfill Introduction Our Business Responsible Inclusive Sustainable Enabling Appendix
75 intel.com/responsibility 2021-22 Corporate Responsibility Report Product Ecology – Circular Supply Chain The application of circular economy principles across the supply chain is a cornerstone of our drive to sustainability leadership. Intel’s supply chain plays a pivotal role through the implementation of circular economy solutions for manufacturing waste upcycling, extending the useful life of equipment and returned products, materials reclaim, and the use of post-consumer recycled materials on transportation media. The consolidated efforts across the supply chain resulted in: • 131,000 metric tons in total landfill avoidance, including 5,900 metric tons through the reuse of capital tools. Less than 1% of high-value e-waste went to landfill. • 2,000 metric tons of material sent for precious metals (gold, platinum, copper, etc.) reclaim. • A 54% reuse/recovery rate on product returned to Intel. • An increase of e-waste collection to 40 countries globally. • The extended life of more than 13,000 computing assets into secondary market programs. • An estimated reduction of up to 500 metric tons of Scope 3 CO 2 emissions. To build on these benefits and drive increased focus and coordination, we are taking an integrated approach across our supply chain groups (Materials and Equipment Sourcing, Logistics, and Resale) to building a common set of circular economy performance metrics. These metrics are aligned to the Intel 2030 RISE goals of zero waste to landfill and implementing circular economy strategies. In 2021, we recycled over 78,000 metric tons, or 96%, of our construction waste. Sustainable Packaging Intel has a history of practicing sustainable packaging methods to improve packaging designs and sustainable material selection. We focus on reducing unfavorable material, increasing material efficiency, designing for recovery and recycling, prioritizing recycled content, and sourcing responsible materials. Working with suppliers, we developed a reusable precision thermoform tray for incoming material and for finished goods shipping to customers and eliminated piece part trays that were historically sent to landfill. The mass of the thermoform tray is 50% of that of an industry injection molded tray and made of a more recyclable material (PET). The closed pocket elimi - nates non-recyclable covers that were previously used to prevent product contamination in typical industry trays. We worked to include post-consumer recycled material in the thermoform trays so that nearly half of the tray is non-virgin material. Since 2009, we conservatively estimate that we have eliminated over 18,000 metric tons of plastic material through these initiatives. To drive further progress, we set a target that by 2025, over 95% of the materials used in our new product packaging designs, by weight, will be recyclable or reusable. As of the end of 2021, we were ex - ceeding this goal, at 96%. Circular Across Supply Chain Materials Waste upscaling Chemical footprint reduction e-Waste recycling FAB & ATM Equipment Capital equipment reuse Expanding equipment life Landfill avoidance Global Logistics Org (GLO) Packaging optimization Re-useable transportation media CO 2 reductions Water usage reductions Intel Resale Corp (IRC) Capital equipment Returned Product IT assets Precious metal reclaim Equipment procurement Materials repurposing Global Reverse Logistics (GRL) Returns Asset Recovery Extend use, reuse, repair, resale, reclaim Introduction Our Business Responsible Inclusive Sustainable Enabling Appendix
76 intel.com/responsibility 2021-22 Corporate Responsibility Report Sustainable Manufacturing and Chemistry Initiatives Two of our 2030 RISE technology industry initiatives focus on collaborations within our ecosystem to accelerate progress on reducing climate impact in semiconductor manufacturing and advancing sustain - able chemistry principles through the application of a chemical footprint methodology. Sustainable Manufacturing Intel is committed to contributing to the global effort toward science-based approaches to GHG emissions reductions in line with efforts to limit global warming to 1.5°C. However, we face challenges in gaining formal approval for an emissions-reduction target under the existing methodology of the Science-Based Targets Initiative (SBTi) due to a number of factors: First, the absolute contraction approach for setting science-based targets does not take into account early action to reduce absolute emissions. The convergence approach within SBTi's sectoral decarbonization approach (SDA) enables consideration of early action, but there is currently no SDA for the semiconductor industry. Second, demand for semiconductors is increasing, due in part to the role that technology plays in driving climate solutions. Current frameworks do not include consider - ation of the application of technology to reduce climate impact in global manufacturing. In addition, emissions pathways for non-CO 2 gases may differ from those for CO 2 due to differences in factors such as mitigation potential. Process emissions for the semiconductor manufacturing industry include non- CO 2 gases such as perfluorocarbons (PFCs) and nitrous oxide. Consideration of sector-specific differ - ences in emissions pathways for CO 2 and non-CO 2 GHG emissions is a potential area of importance for future research and for expanding opportunities for sector- specific approaches to targets. In 2021, we continued to work with industry stakeholders to assess the potential for the development of a sector- specific approach to setting science-based GHG emissions-reduction targets for the semiconductor manufacturing industry. The goal is to expand the number of companies in our sector setting science- based targets. Sustainable Chemistry Sustainable chemistry is a scientific concept that seeks to improve the efficiency with which natural resources are used to meet human needs for chemical products and services. Sustainable chemistry encompasses the design, manufacture, and use of efficient, effective, safe, and more environmentally benign chemical products and processes. Sustainable chemistry is also a process that stimulates innovation across all sectors to design and discover new chemicals, production processes, and product stewardship practices that will provide increased performance and value while meeting the goals of protecting and enhancing human health and the environment. 1 Our 2030 sustainable chemistry initiative is based upon the development and implementation of a chemical foot - print methodology to enable quantification of a baselines against which further progress can be measured, as well as to identify those chemical uses and processes for which significant improvements can be made. We intend to apply the chemical footprint methodology not only to Intel’s direct manufacturing operations, but also to integrate the methodology within the semicon - ductor manufacturing supply chain both upstream and downstream of our manufacturing operations. In 2021, Intel’s Sustainable Chemistry Team continued efforts to refine the chemical footprint methodology for use in evaluation of the chemical supply chain, as well as to integrate the methodology into the chemical supply chain to enable better assessment of full lifecycle impact. In addition, we continued to provide webinars to further the promotion of the chemical footprint meth - odology as a technology industry initiative. Sustainable chemistry baselines were completed for the current manufacturing technologies, as well as for the year 2020. We also completed an initial analysis of current chemical uses, and those identified as the highest impact chemistries have been included within a set of priority projects to further scope and disposition. In 2022, we plan to complete a proof of concept to enable visualization of the top impact chemical uses by mass and chemical footprint values, and to identify po - tential projects that will result in meaningful reductions in chemical footprint values. In addition, we will continue to actively participate in external chemical management initiatives geared toward the improvement of chemical management practices within our supply chain. Chemical Footprint Methodology Manufacturing Chemical Footprint = Mass of Chemical Used x Weighting Factors* For each chemical used, we have assigned a weighting factor from 1-4, with 4 representing the biggest impact. The methodology will also take into consideration the effectiveness of the control technology. *(reputation impact x expectation of regulation x human health factors x environmental impact x climate impact) 1 Source: OECD Sustainable Chemistry . Introduction Our Business Responsible Inclusive Sustainable Enabling Appendix
77 intel.com/responsibility 2021-22 Corporate Responsibility Report Achieving Carbon Neutral Computing As we continue to take actions to reduce Intel’s own global manufacturing and supply chain climate foot - print and to advance product energy efficiency, we have also taken on the global challenge to partner with the technology industry and other stakeholders to achieve carbon neutral computing by 2030. In addition, Intel announced plans in 2022 to achieve net-zero green - house gas emissions in its global operations by 2040. Conceptually, carbon neutral computing is achieved when the positive benefits of the ICT sector “hand - print”—the ways in which technology is applied to reduce climate impact across the economy—equals or exceeds the climate and energy “footprint” of product-related emissions and carbon embedded in technology systems. Our global challenge framework includes partnering with others to accelerate the sustainability of PCs, improve the energy efficiency of data centers, and accelerate handprint projects to reduce emissions across high-impact industries such as utilities, oil and gas, and manufacturing. Collaborating on Sustainable PC Design Partnering with PC manufacturers, we are assessing the carbon footprint of PCs across their life cycles to identify carbon reduction opportunities. To illustrate, Intel published the ATX12VO power supply specifica - tion, which provides higher platform power efficiency in a smaller footprint. Together with Modern Standby, the latest ATX12VO desktop systems will have over 40% reduction in typical energy consumption relative to an average system. 1 In March 2022, Intel partner MSI announced the first ATX12VO system. In addition, Intel’s Project Athena Desktops take advan - tage of both Modern Standby and the ATX12VO power supply unit to ensure smaller, more efficient form factors designed to help OEMs meet Energy Star and EPEAT environmental responsibility standards. Enabling Customers to Achieve Platform Carbon Neutral Goals Based on power and performance optimization done in partnership with OEMs, Intel 11th Generation Intel® Core™ mobile processor (Tiger Lake)-based systems achieve 16 hours of battery life on Windows 2 —double the eight hours of battery life in 2015. In addition to enhanced battery life, Intel has set a new goal to lower emissions related to reference platform designs for client form factors by 30% or more by 2030. These efforts are taking shape with Dell’s Concept Luna prototype device , developed in partnership with Intel to showcase future possibilities for sustainable PC design. In our efforts to reduce carbon footprint at a platform level, we are also implementing technologies across the product life cycle (manufacturing, use, and asset retirement). Specifically, we focus on reducing compo - nent count and the area of the main board, and increasing system and display energy efficiency. We are also advancing the use of bio-based printed circuit boards to aid in the separation of materials and components when recycling, and to reduce overall electronic waste. For enterprises, the Intel vPro® Platform enables sus - tainable management throughout the entire device life cycle, enabling IT organizations to reduce emissions. Intel® NUC – Sustainability in Action The Intel® NUC line of small form-factor PCs demonstrates sustainability in action. We have achieved over 25% savings in electricity during the product's manufacturing process by transitioning to a low-temperature solder. With Intel NUC Mini PCs, Intel continues to focus on landfill avoidance and use of recyclable materials. In 2021: • Intel repaired, reused, or recycled over 70,000 units returned by customers through the Intel NUC return material authorization program. • We kept >99.5% of all returned material (by weight) out of landfills. • Over 95% of packaging for all Intel NUC products (by weight) was designed to be recyclable or reusable in secondary markets. • Post-consumer recycled polymers were used to manufacture many of the Intel NUC Mini PC chassis. Find out more at intel.com/NUCsustainability . Intel’s interoperable, secure, and scalable industrial computers along with our software components are driving advancements in smart energy. 2 https://www.intel.com/content/www/us/en/products/systems- devices/sku/h91417889/microsoft-surface-laptop-4/specifications. html 1 See notices and disclaimers for details. Read more complete information about performance and benchmark results. Introduction Our Business Responsible Inclusive Sustainable Enabling Appendix
78 intel.com/responsibility 2021-22 Corporate Responsibility Report Reducing the Carbon Impact of Data Centers and the Network We have worked with our worldwide ecosystem to reduce data center carbon impact in two areas: 1) Lowering energy consumption during the compute “use phase,” which accounts for the primary source of data center carbon emissions; and 2) Reducing the embodied carbon in the equipment itself in the “create phase,” which represents roughly 10%-20% of emissions. Use phase. The primary source of emissions in the use phase is from electricity used to power the data center and network. One of the ways we are reducing electricity use is through AI-based telemetry, which intelligently monitors and controls electricity in the data center and throughout the network. Intel® Xeon® Scalable processors incorporate registers for monitoring cache, CPU frequencies, memory bandwidth, and input/ output (I/O) access. These telemetry capabilities show the potential for significant energy savings at scale; within its data center that houses 5G communication facilities, Japan Telecommunications operator KDDI reduced overall electricity consumption by 20% in a trial using 3rd Generation Intel Xeon Scalable processors and Intel’s comprehensive power management and AI capabilities. Create phase. Intel is focusing on efforts to reduce the carbon footprint at a platform level by enabling modular component design where CPU, I/O, and accelerator modules can be repaired or upgraded independently to extend the useful life of the platform. Working alongside key data center partners, we are contributing to the Open Compute Project (OCP) to advance modular designs, establish carbon footprint metrics, and set reduction goals. The most recent advancements are specified in the Blue Glacier project, which published a Revision 1 specification for modular design through OCP. Optimizing software for sustainability. We work with the world’s largest cloud and communications service providers, independent software vendors, and open source software communities to optimize hundreds of data center and network applications to address software inefficiencies. Software efficiency continues to lag hardware capabilities, resulting in wasted electricity and higher carbon footprint through over-provisioning of equipment. Intel introduced oneAPI to better exploit the latest hardware’s cutting-edge features to unleash application performance across CPUs, GPUs, FPGAs, and other accelerators. Emerging Innovation. Other ways Intel is working to increase data center and network efficiency include: • Advanced liquid cooling technologies that reduce the data center air conditioning burden while enabling reuse of exhaust heat are in various stages of proof-of- concept and production deployment. This technology can reduce cooling electricity expenses by 90% and the carbon footprint by 40%. Read more about Intel’s pilot with Submer. • The latest Intel® Xeon® processor roadmap features products using both efficiency cores and performance cores. Efficiency cores—used in the upcoming Intel Xeon processor code-named “Sierra Forrest”—enable lower power consumption across workloads that are optimized for best power efficiency. Performance cores—used in the future product code-named “Sapphire Rapids”—have built-in accelerators to drive artificial intelligence, data streaming, crypto, and a range of other workloads at a lower energy cost. • Collaborations with industry partners to proliferate sustainable compute at the 5G edge by enabling local, renewable energy sources to power data centers placed closer to where data originates are ramping at worldwide scale. Expanding the Technology "Handprint" To build a supportive policy environment for private sector leadership on climate change, we participate in a range of organizations, policy forums, and coalitions. We are working with other companies and policymak - ers to enable technology-based solutions that provide greater carbon benefit than the carbon embedded in those solutions. For example, Intel has developed a solution that can be integrated into existing energy grid infrastructure to create a smarter grid that can adapt to changing energy consumption needs and sources. We aim to accelerate the deployment of such projects within Intel’s operations and also in external projects in collaboration with our customers. In addition, we are working with the Center for Climate Change and Energy Solutions and Gridwise Alliance , which advocate for innovation and investments in climate solutions, including expanding ICT’s role in driving change and grid modernization appropriations as part of future infrastructure investments. We also worked within our Digital Climate Alliance , a coalition of technology companies, to successfully support policies in the “Infrastructure Investment and Jobs Act” passed by the US Congress late in 2021. Finally, we worked with the American Council for an Energy-Efficient Economy to evaluate methodologies for quantifying the climate benefits of Intel’s handprint technologies. For more detail, see “ Governance, Ethics and Public Policy ” in the Our Business section of this report. Parking lot solar panels and electric vehicle charging stations at Intel’s campus in Folsom, California. Introduction Our Business Responsible Inclusive Sustainable Enabling Appendix
79 intel.com/responsibility 2021-22 Corporate Responsibility Report Enabling Acting alone, Intel cannot achieve the broad, societal impact we aspire to. We are committed to creating a better world through the power of our technology and the expertise and passion of our employees. We also believe that the health of our company and the communities where we operate depends on an increasingly inclusive community of innovators prepared for the jobs of the future. Acting on Intel and the Intel Foundation’s vision, “Empowering human potential. Igniting positive change,” we are challenging ourselves to do even more. Our mission is to empower youth and communities with the skills and confidence to rise, advance, and excel by bringing people, partnerships, and technology together. This year’s highlights 848,000 volunteer hours Over the past decade, Intel employees donated more than 10 million volunteer hours. Despite COVID-19-related challenges, our employees and retirees found ways to continue to support local communities—including virtual activities—by volunteering more than 848,000 hours globally in 2021. $9.5 million invested in social impact tech Through the Intel RISE Technology Initiative (IRTI), we have invested $9.5 million for more than 60 projects addressing health and life sciences, education, economic recovery, social equity and human rights, accessibility, and sustainability. $760 million Intel Foundation contributions Since its founding in 1988, the Intel Foundation has enabled positive social impact for our local communities and for underserved populations through more than $760 million in funding of programs and STEM initiatives. Introduction Our Business Responsible Inclusive Sustainable Appendix Enabling
80 intel.com/responsibility 2021-22 Corporate Responsibility Report Enabling: Our Approach Our employees are our greatest asset, and their engineering expertise and passion for applying Intel® technology to help solve global challenges are critical to the achievement of our 2030 RISE goals. We have long cultivated a culture that strongly encourages employees to get involved in their communities, with 10 million volunteer hours contributed globally over the past decade. With our new goals, we have committed to donate another 10 million volunteer hours the next decade and to increase the impact of our skills-based volunteering. To catalyze action and amplify the impact of our employees’ service and generosity, Intel and the Intel Foundation invest in matching programs and innovative partnerships and collaborations. In turn, our investments and support of local communities help us build trust with external stakeholders and realize our corporate purpose of enriching lives through technology. As an innovation leader, Intel is well-positioned to share its technology expertise and solutions with communities, customers, governments, non-governmental organizations (NGOs), and educators to help them reach their own goals and effect broader change. We aspire to drive collective impact through our Intel RISE Technology Initiative in partnership with our customers and other stakeholders, and to explore innovative ways to apply technology to solve global challenges. “The tremendous success of the Million Girls Moonshot Movement is in large part due to the leadership and engagement of the Intel Foundation.” — STEM Next Opportunity Fund Introduction Our Business Responsible Inclusive Sustainable Appendix Enabling
81 intel.com/responsibility 2021-22 Corporate Responsibility Report Employees Changing the World Our goal is to empower all of our employees to take action to advance Intel’s 2030 RISE strategy and goals. Intel and the Intel Foundation invest in programs that create opportunities for employees around the world to learn and connect with each other, to further integrate corporate responsibility and sustainability into their team's work objectives, and to share their engineering and other skills with our communities. Intel Involved and Skills-Based Volunteering In 2021, we continued to empower our employees to give back through Intel Involved, our global corporate employee volunteer program. Since the program’s launch in 1995, our employees have generously donated their skills, technology expertise, and more than 19.6 million hours of service to tackle environmental challenges, improve education, and help meet community needs around the world. Through Intel Involved, we identify and organize service projects for individuals and teams. The Intel Foundation amplifies the impact of volunteerism by donating cash to eligible nonprofits and schools where Intel employees and US retirees donate at least 20 hours of service in a year. In 2021, the Foundation provided $6.7 million in volunteer matching grants, and since 1995, matching grants of more than $128 million have positively impacted communities around the world. Over the past year, when in-person gatherings were limited, we continued to offer virtual volunteer opportu - nities for employees to give their time and talent to those in need. We expanded our criteria for what counts as volunteering to include acts of kindness, such as shopping for a house-bound neighbor. Our employees reported more than 848,000 volunteer hours globally in support of schools and nonprofit organizations in our communities. The Intel Employee Service Corps (IESC), Intel’s flagship skills-based volunteer program, harnesses the passion and expertise of Intel employees to drive positive social impact in communities around the world. IESC provides employees with short-term immersive and collaborative experiences in partnership with gov - ernments and non-governmental organizations (NGOs) to address local and global challenges, including disaster relief. In 2021, one team of IESC volunteers launched a Racial Equity Ideas Competition to crowdsource social equity solutions, and another helped deliver sports- themed virtual STEAM summer programs for middle and high school girls around the world. Making a Difference in Local Communities Our employees have found countless ways to provide service, even as the COVID-19 pandemic continued in 2021. One of our employees is a passionate volunteer for a food bank in Poland. She organizes two food drives every year, including coordinating collection logistics and coordinating with Intel employees. In 2021 she also organized five workshops for employees on subjects like food waste, food cooperatives, gardening, and more. Intel employees in China organized a tree-planting event in collaboration with more than 30 organizations, attracting more than 800 volunteers. Employees in China also hosted onsite and virtual events to promote environmental protection aware - ness among students and members of the local community, and organized campaigns aimed reducing food waste and taking other actions to promote sustainability. Although she does not have a technical background, an Intel employee in Guadalajara has dedicated hundreds of hours planning and organizing trainings for young girls who compete—and perform well—in the Technovation Challenge in Mexico. Like many Intel employees, she is extremely passionate and supportive of all projects related to girls and women in STEAM. In Ireland, an employee set up a first-of-its-kind, all-inclusive, non-competitive soccer academy at his local soccer club. The academy is open to all children with autism, Aspergers, ADHD/ADD, and other related conditions. Participation helps children develop sports knowledge, physical motor skills, independence, and social skills. Being on a team also helps with social inclusion by creating peer group networks, and improves confidence, competence, and empowerment—all while providing fun. $90.9 Million. Total matching grants for employee volunteer service through the Intel Involved Program over the past decade. Introduction Our Business Responsible Inclusive Sustainable Appendix Enabling
82 intel.com/responsibility 2021-22 Corporate Responsibility Report Sharing Valuable Skills We believe the skills employees bring to volunteering are as important as the time they contribute. For example, in 2021 our legal team donated over 1,500 hours, estimated to be valued at over $375,000. 1 This is particularly significant given the crit - ical community need and the cost nonprofits and schools would incur if they had to pay for the services that are delivered at no charge through our volunteers. Another employee began working with Sense International in 2019, translating content to help empower thousands of children and adults with deafblindness across India. He applied for a Intel Foundation Seed Grant to implement online training for parents, caregivers, and educators to support children with deafblindness, and is heavily involved in the operations of the cause. He has also worked to recruit and organize more than 100 Intel volunteers for the project. 2030 Goal: Community Impact Description. Deliver 10 million volunteer hours to improve our local communities, including an increase in skills-based volunteerism. Baseline. Progress measured from baseline of Jan. 1, 2020. Progress in 2021. While the pandemic continued to limit opportunities for some types of in-person volunteerism, during 2021, our employees donated 848,000 hours of service in our local communities. Included were many COVID-19-related projects that leveraged employees' technology skills and expertise. Looking Ahead. In 2022, our target is to reach 1 million volunteer hours, and to continue to expand our skills-based volunteering activities. 2021 Volunteerism by the Numbers 20% Percentage of employees who volunteered 848,000 Number of hours $6.7 M Total dollars matched by the Intel Foundation for Intel Involved volunteer hours. 2 $24.2 M Estimated in-kind value of volunteer hours. 3 1 Based on Taproot’s Pro Bono executive legal valuation rate of $195/hr. 2 Volunteer payments made in 2021 are for 2020 hours. Payments are processed once the year closes. 3 Based on the 2021 Value of Volunteer Time rate of $28.54 per hour published by Independent Sector. Introduction Our Business Responsible Inclusive Sustainable Appendix Enabling
83 intel.com/responsibility 2021-22 Corporate Responsibility Report Global Volunteerism, Local Impact Volunteer Heroes. Each year, the Global Intel Involved Hero Awards program recognizes Intel super volunteers. Finalists receive $2,500 grants from the Intel Foundation for the charitable organization or school of their choice. The overall winner receives an additional $7,500 grant for his or her designated organization and is recognized at Intel’s Legends and Luminaries event celebrating the top employees’ achievements each year. This year’s global hero, Ankit Navik, started a mobile service program in 2014 to train students in India on the intricacies of mobile and PC repair and assembly. He recruited 35-plus volunteers for the project, which has now trained more than 180 students, many of whom have since secured jobs or opened their own businesses. The Association of People with Disability will receive a $10,000 grant in recognition of Navik’s many years of service. Other finalists from Costa Rica, India, Ireland, Israel, Mexico, Poland, and the US stepped up to support their communities in multiple ways—from planting trees and STEM tutoring, to strengthening nonprofit organization leadership and resilience. Grants for Volunteer Projects The Intel Foundation awards Seed Grants of up to $10,000 to support employee-initiated community service projects. Projects are selected based on their originality, potential impact, and expected outcomes. The following are examples of volunteer projects selected to receive Seed Grants in 2021: Outdoor school learning yard . Intel employees in Israel are transforming an unused outdoor space at Hachita School into a vibrant garden and learning space to be used by classes of all ages. Refurbishing computers for education. In Penang, Malaysia, Intel employees are establishing a program to accept used computers from local companies to be refurbished for use at a school in Penang. Refurbishing the computer systems will keep the systems from being scrapped. Funding will also be used to purchase new hard disks, monitors, and software for the school. Training against human trafficking. Fin de la Esclavitud, a nonprofit in Guadalajara, Mexico, will work with Intel employees to expand and digitize its anti-human trafficking training program to enable a virtual course. Sensory room for children with autism. Intel employees in Texas are working with Kiker Elementary School in Austin to design and establish a dedicated sensory room for children with autism and others who need support. STEM learning initiative. Intel employees are partnering with Mentoralia, A.C., a nonprofit in Jalisco, Mexico, to expand Technovation Girls, a 12-week program that enables girls to build mobile apps or AI projects that address a community problem. Introduction Our Business Responsible Inclusive Sustainable Appendix Enabling
84 intel.com/responsibility 2021-22 Corporate Responsibility Report Intel Foundation: Rising to the Future Since 1988, the Intel Foundation has given more than $760 million to enable positive social impact. The Foundation’s work is guided by the passion of Intel’s people and the company’s commitment to equitable access to education and opportunity. The Intel Foundation embraces a bold vision: empowering human potential and igniting positive change to drive an even deeper impact in the future and advance gender and racial equity and social justice globally. To achieve this vision, the Foundation has accelerated its mission to empower youth and communities with the skills and confidence to advance and excel by bringing people, partnerships, and technology together. Watch the video . The Foundation collaborates with nonprofit, public and private organizations, and schools to create and deploy global solutions by contributing thought leadership and financial resources to innovative programs that support underserved populations. The Foundation’s priorities include: Amplifying employees’ time and generosity: The Foundation connects employees’ and US retiree’ passions to philanthropy to take on global challenges and meet community needs through matching funds to schools and nonprofit organizations where our employees and US retirees volunteer and make donations. Promoting STEM education: Recognizing the life-changing power of technology and learning, the Foundation champions immersive STEM experiences to help ensure that the next generation of innovators is diverse and inclusive. Responding to humanitarian crises and natural disasters: When humanitarian crises or natural disasters strike, the Foundation matches employees’ donations to support communities and provides options for employees to make their donations count where and when they are needed most to achieve long-term impact. The Foundation continues to collaborate with the STEM Next Opportunity Fund on the Million Girls Moonshot to engage more girls in STEM. To learn more, see “ Building a Diverse Technology Industry ” in the Inclusive section of this report. Setting New Heights for Humanitarian Crises and Natural Disaster Relief In 2021, the Foundation supported emergency response organizations responding to an increased number of humanitarian crises and natural disasters, including wildfires, floods, winter storms, tornadoes, earthquakes, hurricanes, COVID-19, and more. Through the Intel Foundation Humanitarian Crises and Disaster Relief program, 16 campaigns raised nearly $2 million in donations and matches to aid recovery across 13 countries. More recently, the Foundation launched an employee donation campaign in response to the humanitarian crisis in Ukraine. Together, the Foundation and Intel employees raised over $2 million to support Ukraine aid efforts. I'm extremely thankful to Intel for giving us an opportunity to do our bit during these challenging times. It is heartening to know that fellow Intel employees rose to the occasion, and we met the original goal so quickly. I hope the outpouring of help and support continues until the situation stabilizes back in India. I did my bit and hope everyone does too. —Intel employee, following the donation of $250,000 by employees within 24 hours to help combat the devastating spread of the coronavirus in India. Foundation and Corporate Giving 2021 Contributions (in millions) Forms of Giving US International To t a l Corporate Cash $29.6 $13.6 $43.1 Foundation Foundation Grants $2.0 $0.3 $2.3 Donation Matching $15.8 $5.7 $21.5 Volunteer Matching $4.1 $3.1 $7.2 In-Kind Giving $1.4 $0.5 $1.9 To t a l $52.9 $23.1 $76.0 In 2021, charitable giving by Intel and the Intel Foundation totaled $76.0 million, compared with $80.4 million in 2020. As part of our social impact strategy, we work with a broad range of nonprofit and education partners, including providing grants and other in-kind support. For all of our contributions, we maintain control and review processes to track contributions and ensure alignment with Intel’s values and strategy. Recipients of grants from Intel and the Intel Foundation are required to verify compliance with Intel’s non-discrimination policy. In 2021, examples of funded organizations receiving significant grants in each of our giving categories included: Higher Ed (University of California at Berkeley, National Science Foundation), K-12 Education (STEM Next Opportunity Fund, Penang Science Cluster), and Community and Civic Organizations (American Heart Association, US India Friendship Alliance Inc). 1 Includes organizations focused on addressing community needs, disaster relief, diversity and inclusion, environmental impact, arts and culture, and other civic-related activities. Community and Civic Organizations 1 Higher Education K-12 Education 44% 14% 42% Community Giving by Category Introduction Our Business Responsible Inclusive Sustainable Appendix Enabling
85 intel.com/responsibility 2021-22 Corporate Responsibility Report Collaborating for Technology Impact To solve global challenges, we are changing the ways we work with customers, external partners, and employees. Below are examples of collaborations that focus on our 2030 RISE goals and strategic growth areas. Safer Indoor Navigation Through the Intel RISE Technology Initiative (IRTI), we are collaborating with GoodMaps to deliver a high- quality indoor wayfinding solution for people who are blind or visually impaired. Safely and effectively navigating indoor spaces results in greater independence and con - fidence when traveling. Intel is investigating mapping algorithms and advances in AI to improve the precision and accuracy of GoodMaps’ indoor wayfinding service. In this video , students at Portland State University share their experiences with the technology and how it has changed their lives for the better. Digital Access for the Next 50% Intel formed an alliance with 50 partners from Fortune 500 companies, NGOs, and academia—including Dell, World Wide Technology, and African Mobile Networks— to build the N50 Project . The project, part of the IRTI, aims to bring access to affordable digital content, applications, and services to the next 3.9 billion people to provide health, social, and financial benefits to margin - alized communities. In partnership with the N50 Project, the Intel Foundation is providing funding to Geeks Without Frontiers to build 10 solar-powered communica - tion centers in areas neighboring Ukraine. The centers, equipped with connectivity, charging ports, and more, aim to alleviate communication and information challenges for millions of refugees. Voice Banking Technology for Motor Neurone Disease According to the Motor Neurone Disease (MND) Association , one in every 300 people will receive a diagnosis of MND—a condition that progressively robs a person’s ability to move, speak, eat, and drink. Scientists have yet to discover a cure for MND, but technology is helping those living with the disease. Intel, Dell Technolo - gies, Rolls-Royce, and the MND Association are partnering to apply voice banking technology to drive positive change for people with MND. The technology solution works by training an AI-based algorithm that will serve as digital voice for someone who may lose their ability to speak in the future. The digital voice can create any word or sentence with the same characteristics as the original voice using learned critical words and syllables. Record - ings are analyzed and digitized by SpeakUnique’s cloud computing infrastructure, which runs on Amazon’s EC2 instances and is powered by Intel® Xeon® processor- based servers. One Intel team helped shape the user experience and accessibility, while another contributed expertise gained from past voice accessibility projects with renowned physicist Stephen Hawking, who had ALS, the most common type of MND. “What I think is brilliant about this project is that you're asking people to do something that’s very natural to them. True acces - sibility is about recognizing the human experience and building around it,” said Lama Nachman, Intel Fellow and director of the Human & AI Systems Research Lab. Nachman’s team built the communication platform that Hawking used and made it accessible to everyone through open-source platforms. Introduction Our Business Responsible Inclusive Sustainable Appendix Enabling
86 intel.com/responsibility 2021-22 Corporate Responsibility Report Inspiring Sustainability Solutions Intel believes that the intelligent use of field- programmable gate arrays (FPGAs) in edge and cloud computation can reduce demands on our planet's resources. The InnovateFPGA global design contest was developed to inspire students, makers, and engineers to develop FPGA-based, cloud- connected solutions that will have real-world environmental impact. Intel is the headline sponsor of the contest, and Intel, Terasic, Microsoft, and Analog Devices joined forces to create the contest platform, which can connect sensors and other devices with an Intel® FPGA and other services. Each competing team receives a no-cost development kit and design tools to help them showcase their ingenuity. This year’s InnovateFPGA will culminate in a Grand Finale event at Intel in June 2022. Watch the video to learn more about the competition. Technology, Purpose, and the Olympics Intel has been a worldwide partner of the Olympic Games since 2017 and plays a key role in accelerating the adoption of new technologies in sports. In 2021, Intel proudly became a Worldwide Paralympic Partner to support the International Paralympic Committee. In 2022, for the second year in a row, Intel won a Partner award from the US Olympic and Paralympic committee for our commitment to athletes, especially as they have dealt with the challenges of training and staying close to loved ones while competing through the pandemic. Our support included a collaboration with Samsung to provide over 800 Tokyo 2020 and Beijing 2022 athletes with Galaxy Pro 360 laptops. In partnership with the International Olympic Committee (IOC), we are creating experiences that are more innova - tive and immersive than ever before, using Intel’s leading technologies for audience interaction and to enhance the Games through 2024. We are excited to apply new technologies like AI to bring deeper levels of connectivity and interaction to Olympic fans around the world. Intel will continue to engage in purpose-led collaboration with the IOC centered around our 2030 RISE goals, particularly on sustainability and improvement of the environmental impact of digital activities, as well as diversity and inclusion. We have started to work with the Paris, France 2024 Organizing Committee on its environmental excellence initiatives, with an initial focus on carbon neutrality and sustainable procurement. We will also continue to collaborate with the IOC through its Athlete365 program, which offers support, guidance, and resources to help elite athletes transition into careers in business. Intel is committed to making the Olympic Program a catalyst for our transformation, and through our work we are creating memorable experiences for athletes, partners, customers, viewers at home, and our employees. Seven Intel employees were selected as torch bearers in the Paralympic Torch Relay in March 2022. They represented a cross-section of employees from our Shanghai, Chengdu, Dalian, and Beijing sites. Introduction Our Business Responsible Inclusive Sustainable Appendix Enabling
87 intel.com/responsibility 2021-22 Corporate Responsibility Report Appendix This section includes: About This Report Independent Limited Assurance Statement Performance Data Summary SASB and TCFD Framework Alignment UN Sustainable Development Goals Non-GAAP Financial Measures Intel 2021 Water Inventory by Location and Source 2021 Environmental, Health, and Safety Violations Top 100 Production and Services Suppliers Acronym Index Introduction Our Business Responsible Inclusive Sustainable Enabling Appendix
88 intel.com/responsibility 2021-22 Corporate Responsibility Report About This Report We prepared this report in accordance with the Global Reporting Initiative (GRI) Standards: Comprehensive option. A GRI Content Index is provided on our Report Builder website. We also use other recognized frameworks to inform the content of this report, including the Sustainability Accounting Standards Board Standards, the Task Force on Climate- Related Financial Disclosures framework, the UN Global Compact, and the UN Sustainable Development Goals. We continue to integrate sustainability information into our investor communications, and additional information about Intel’s operations and financial statements is available in the 2021 Intel Annual Report on Form 10-K . The Our Business section of this report covers content recommended by the International Integrated Reporting Council for inclusion in “integrated reports,” and can be downloaded as a standalone document or read as an interactive part of our full 2021-22 Corporate Responsibility Report. For a high-level overview of Intel’s corporate responsibility, supporting documents and data, past reports, and to customize a report with the sections you choose, visit our Corporate Responsibility and Report Builder websites. A printed summary of the report is available by request. Send questions, comments, or feedback to Jocelyn Cascio, Ag. Director of Corporate Responsibility, Intel Corporation, 5000 W. Chandler Blvd., CH7-437, Chandler, AZ 85226 US You can also use our web-based feedback form or the CSR@Intel blog to contact our Corporate Responsibility team. For best viewing results on a PC or tablet, we recommend using Adobe Acrobat DC or QuickTime . For best printing results, use letter-size paper. Report Scope and Profile With the Intel 2021-22 Corporate Responsibility Report, we aim to provide stakeholders with a balanced view of our corporate responsibility strategy and performance for Intel’s world - wide operations during fiscal year 2021 (ended December 26, 2021). Our previous report was published in May 2021. References to “Intel” throughout this report pertain to Intel Corporation. The Intel Foundation is a separate entity. The report does not include performance information for Intel’s joint ventures or firms included in the investment portfolio of Intel Capital, Intel’s global investment organization, unless specified. Financial data is presented in US dollars. This year’s report does not reflect any significant changes in reporting scope compared to our previous report. Principles and policies apply to all officers and employees of Intel and its subsidiaries, unless otherwise noted. Key performance indicators cover our global manufacturing operations, including our wafer manufacturing and assembly and test facilities. Unless stated other - wise, 2021 data is considered final based on information received by May 1, 2022, and provided that information reproduced or derived from the 2021 Intel Annual Report on Form 10-K speaks as of January 22, 2022, the date we submitted our Form 10-K for filing. Approach to Report Assurance The information in this Corporate Responsibility Report is subject to internal reviews and, for selected content, external reviews. On a regular basis, we validate the management systems and processes used to collect the data. We have maintained a multi-site ISO 14001 certification for our manufacturing locations since 2001, which requires independent third-party audits at many of our sites each year. In 2019, we established a company-wide certification to ISO 45001, an internationally recognized standard for environmental, health, and safety management systems, which requires independent third-party audits at our manufacturing sites. As of January 1, 2022, all of our manufacturing sites meet the ISO 50001 Energy Management System standard. Our operations in Ireland are covered by the European Union Emissions Trading Scheme. For many years, we have obtained third-party verification for our greenhouse gas (GHG) emissions. Since 2012, we have completed third-party assurance for selected indicators contained in our Corporate Responsibility Report. For the 2021-22 Corporate Responsibility Report, we engaged Apex Companies LLC to complete the assurance review. Their report is included in this Appendix. This 2021-22 Corporate Responsibility Report contains forward-looking statements, and actual results could differ materially. Risk factors that could cause actual results to differ are set forth in the “Risk Factors” section of the 2021 Intel Annual Report on Form 10-K , as updated by our Quarterly Report on Form 10-Q for the quarter ended April 2, 2022. These risk factors are subject to update by our future filings and submissions with the US Securities and Exchange Commission and earnings releases. Forward-looking statements are based on expectations as of the date of this report, unless an earlier date is indicated. Statements derived from our 2021 Annual Report on Form 10-K speak as of January 27, 2022. Intel disclaims any duty to update any statement made in this report except to the extent required by law. This report contains non-GAAP financial measures relating to our performance. You can find the reconciliation of these measures to the most directly comparable GAAP financial measures in this Appendix, and further explanation of these adjustments in the “Non-GAAP Financial Measures” within “Management’s Discussion and Analysis” in the 2021 Intel Annual Report on Form 10-K . Introduction Our Business Responsible Inclusive Sustainable Enabling Appendix
89 intel.com/responsibility 2021-22 Corporate Responsibility Report Independent Limited Assurance Statement For a PDF copy of this statement, including a summary of data within the scope of assurance for 2021, access the Report Builder website. Pag e 1 of 2 INDEPENDENT LIMITED ASSURANCE STATEMENT To: The Stakeholders of Intel Corporation Introduction and Objectives of W ork Apex Companies , LLC (Apex) has been engaged by Intel Corporation (Intel) to provide limited assurance of its selected environmenta l, safety , supplier , and diversity data. This assurance statement applies to the related information included within the scope of work described below (Subject Matter ). This information and its presentation in Intel ’s 2021 Corporate Responsibi lity Report ( ‘ the Re port ’ ) are the sole r esponsibility of the management of Intel . Apex was not involved in the drafting of the Report . O ur sole responsibility wa s to provide independent assurance on the acc uracy of the Su bject Matter . This is the third year in wh ich we ha ve provide d assuranc e over Intel ’s Corporate Responsibility Report . Scope of Work The scope of our work was limited to assurance over the following environme ntal, safety , supplier, and dive rsity data included within Intel ’s 2021 Corpora te Responsi bility Report (‘the Rep ort’) for the period of calendar year 2021 (the ‘ Subject Matte r ’) : ▪ Global Greenhouse Gas Emissions (Scope 1 , Sc ope 2 location -based and market -based, and Scope 3, Category 5 – Waste generated in operations ) ▪ Renewable Energy Percenta ge ▪ Water Conservation ▪ Energy Conservation ▪ Number of Responsible Business Alliance (RBA) Validated Audit Program (VAP) supplier audits co nducted ▪ Priority/Ma jor Finding s by Categ ory fo r RBA VAP supplier audit s ▪ Recordable Injury and Illness Ra te ▪ Cumulative T rauma Disorder (CTD) Cases as Percent of Total Cases ▪ Percent of Underrepresented Min orities in Senior Leadership (Hispanics, African American, and Native Americans in U.S. only) ▪ Percent of Women in Senior Leadershi p (Global) ▪ Global Emplo yee Turn over Rate ▪ Volunteer hours ▪ Charitable contributions (methodology) ▪ Supplier Diversity Spend Our assurance does not extend to any other inform ation included in the Report . Repo rting Boundaries The following are the boundar ies used by Intel for reporting sustai nability data: ▪ Operational Control ▪ For GHG Emis sions - all manufacturi ng site s and all non -manufacturing sites with air permits ▪ For Water and Energy - all manufacturing and technology development ( TD ) sites, non -manufacturing sites where Intel has operatio nal cont rol that have either >= 2,000 employees or < 2,000 employee s that consume or generate an amoun t that i s material to the global inventory. *Material is defined by Intel as any site ≥ 1% of the global total for that metric/inventory Note: Manufacturing sites includ e waf er fabs, assembly test ( ATM) , technology development (TD), and mas k op eratio ns Reporting Criteria The Subject Matter needs to be read and unde rstood together with t he description of the Subject Matter in the Report. The reporting criteria for g reenhouse gas (GHG) emissions was the World Resources Institute (WRI) /World Business Council for Sustainable Developm ent (WBCSD) Greenhouse Gas Prot ocol Corporate Accounting an d Reporting Standard . The reporting criteria for the safety data was the OSHA and US Burea u of Labor Standard s. The reporting criteria for supp lier a udits w as the RBA Code of Conduct. The reporting cri teria for other data is bas ed on company criteria, as described in the CR Report. Limitations and Exclusions Excluded from the scope of our work is any assurance of inf ormation relating to: ▪ Text or other wri tten statements associated with Intel ’s 2021 Re port ▪ Activities outside t he defined assurance perio d of Calendar Year 2021 Pag e 2 of 2 This limited assurance engagement relies on a risk -based selected sample of sustaina bility data and the associated li mitations tha t this entails. This independent statemen t should not be relied upon to detect all errors, omissions or misstatements that may exist. Responsibilities This preparation and presentation of the Subject Matter in the Rep ort are the sole re sponsibility of the management of Intel. Apex was not inv olved in the drafting of the Subject Matter or of th e Reporti ng Criteria. Our responsibilit ies were to: • obtain limited assurance about whether the Subject Matter has been prepar ed in accordance with the Reporting Criteria; • form an in dependent conclusion ba sed on the assurance proced ures performed a nd evidence obtain ed; and • report our conclusions to the management of Intel . Assessment Standard s We performed our work in acco rdance with Apex ’ s standard procedures and g uidelines for external Assurance of Susta inability Reports and Intern ational Standard on Assurance Enga gem ents (ISAE) 3000 Revised, Assurance Engagements Other than Audits or Reviews of Historical Financial Infor mation (effective for assur ance reports date d on or a fter De c. 15, 2015), issued by the International Auditing an d Assurance Stan dar ds Board. GHG e missions were verified in accordance with ISO 14064 -3: Second edition 2019 -04: Greenhouse gases -- Part 3: Specifica tion with Guidance for the Verification and V alidation of Greenh ouse G as Statements . A mate riality threshold of ±5 perc ent was set for the assu rance process. Summary of Work Performed As part of our independent assurance , our work included : 1. Assessing the app ropriateness of the Report ing Criteria for the Subject Matter ; 2. Conducting i nterviews with relevant Intel p ersonnel regarding data coll ection and reporting systems ; 3. Reviewing the data collection and consolidation processes used to compile Subject Mat ter , including asses sing assumptions made, and the data scope and reporting boundaries; 4. Re view ing document ary evi dence provid ed by Intel ; 5. Agreeing a selection of the Subject Matter to the corresponding source documentation ; 6. Review ing Intel systems for qu antita tive dat a aggregation and analysis ; and 7. Ass essing the disclosure and presentation of the Subject Matter to ensure consistency with ass ured information . Conclusion On the basis of our methodology and the activities described above : • Nothing has come to our attention to indicate that the Subject Ma tter is not fairly stated in all materi al respects ; and • It is our opinion that Intel has est ablished appropriate system s for the collection, aggregation and analysis of quantitative data within the scope of t his as surance . A summary o f data within the sco pe of assurance for 2021 is attached. Statement of Indepe ndence, Integrity and Competence Apex is an independent profe ssional services company that specializes in Health, Safety, Social and Environmental man agement services including assurance with over 30 years history in providing these ser vi ces . Apex has im plemente d a Code of Ethics across t he business to maintain hig h ethical standards among staff in their d ay-to-day business activities. No member of the assur ance team has a business relationship wit h Intel , its Directors or Managers beyo nd that required of this assignment . We have conducte d this assurance independent ly, and there has been no conflict of inte rest . The assurance team has extensive exp erienc e in conducting assurance ove r environmenta l, so cial, eth ical and health and safet y information, s yst ems and processes, has over 20 ye ars com bined experience in this field and an excellent understanding of Apex’s standard methodology for the assurance of greenhouse gas emissions da ta. Mary E. Armstrong -Friberg , Lead Verifier John Rohd e, Techni cal Reviewer Principal Consultant Senior Program Manager Apex Companies, LLC Apex Companies, LLC Cleveland, Ohio Lakewood , Co lorado April 1 5, 2022 Introduction Our Business Responsible Inclusive Sustainable Enabling Appendix
90 intel.com/responsibility 2021-22 Corporate Responsibility Report Performance Data Summary Report Section 2021 2020 2019 2018 2017 Our Business and Financial Results Net revenue (dollars in billions) $79.0 $77.9 $72.0 $70.8 $62.8 Net income (dollars in billions) $19.9 $20.9 $21.0 $21.1 $9.6 Provision for taxes (dollars in billions) $1.8 $4.2 $3.0 $2.3 $10.8 Research and development spending (dollars in billions) $15.2 $13.6 $13.4 $13.5 $13.0 Capital investments (dollars in billions) $18.7 $14.3 $16.2 $15.2 $11.8 Employees at year end (in thousands) 121.1 110.6 110.8 107.4 102.7 Safety – recordable rate 1 /days away case rate 1 0.93/0.20 0.75/0.16 0.69/0.14 0.72/0.14 0.68/0.12 Environmental Sustainability Greenhouse gas emissions (million metric tons of CO 2 equivalent) 2 3.27 2.88 2.88 2.58 2.46 Renewable electricity purchased (% of global electricity use) 80% 82% 71% 71% 73% Energy use (billion kWh – includes electricity, gas, and diesel) 11.6 10.6 9.6 8.3 7.3 Total water withdrawn (billions of gallons) 3 14.3 13.8 12.6 12.0 11.1 Net positive water (water returned + restored) progress 99% 90% 90% 86% 77% Total waste generated (thousand metric tons)/% to landfill 344/5% 414/5% 387/3% 205/7% 183/9% Supply Chain Responsibility On-site supplier audits (third-party and Intel-led audits) 157 126 207 221 170 Diversity and Inclusion Percentage of women in our global workforce 28% 28% 28% 27% 27% Percentage of women on our Board (%) 4 30% 30% 20% 20% 17% Social Impact Employee and retiree volunteer hours (in millions)/volunteerism rate 0.85/20% 0.91/20% 1.2/39% 1.5/64% 1.2/36% Worldwide charitable giving (dollars in millions) 5 $76.0 $80.4 $75.1 $84.2 $89.6 1 Rate based on 100 employees working full time for one year; data is as of March 2022. 2 Including Scope 1 and Scope 2 market-based method. 3 We define water withdrawals, or water usage, as total incoming fresh water used. 4 Note that if all of the director nominees are elected at our 2022 Annual Stockholder Meeting, 30% of our directors will have self-identified as women. 5 Includes total giving (cash and in-kind) from Intel Corporation and the Intel Foundation. Introduction Our Business Responsible Inclusive Sustainable Enabling Appendix
91 intel.com/responsibility 2021-22 Corporate Responsibility Report SASB and TCFD Framework Alignment Based on feedback gathered during our integrated investor outreach activities, we have aligned our disclosure with two additional frameworks: the Sustainability Accounting Standards Board Standards (SASB) and the Task Force on Climate-related Financial Disclosures (TCFD). Below is a mapping of how our latest disclosure aligns with these frameworks. SASB. SASB has developed voluntary industry-specific disclosure standards for sustainability issues in order to facilitate communication by companies to investors of decision-useful information. Below, we have outlined how our existing disclosure aligns with the recommended metrics for the SASB Technology and Communications Sector – Semiconductor Standard. Topic Accounting Metrics Code Intel Metric or Qualitative Disclosure Disclosure Location 1 Greenhouse Gas Emissions (1) Gross global Scope 1 emissions and (2) amount of total emissions from perfluorinated compounds TC-SC- 110a.1 (1) 2.18 million metric tons CO 2 e (2) 1.12 million metric tons CO 2 e 2021-22 Corporate Responsibility Report, p 69 , p70 CDP Climate Change Survey Greenhouse Gas Emissions Discussion of long-term and short-term strategy or plan to manage Scope 1 emissions, emissions reduction targets, and an analysis of performance against those targets TC-SC- 110a.2 We discuss our strategy and long history of goal setting and reductions. We have also achieved a 19% absolute reduction of Scope 1 and 2 emissions since 2000, even as we expanded our manufacturing capacity significantly. 2021-22 Corporate Responsibility Report, p 69 2021 Intel Annual Report on Form 10-K , p 15 2022 Proxy Statement , p 51 CDP Climate Change Survey Energy Management in Manufacturing (1) Total energy consumed, (2) percentage grid electricity, and (3) percentage renewable TC-SC- 130a.1 (1) 41.9 million gigajoules energy consumed (2) 83% grid electricity (3) 80% renewable energy globally. 2021-22 Corporate Responsibility Report, p 68 , p 69 , and p 70 Water Management (1) Total water withdrawn and (2) total water consumed, percentage of each in regions with High or Extremely High Baseline Water Stress TC-SC- 140a.1 (1) 54.1 million m³ withdrawn (2) 11.6 million m³ consumed. See Appendix for detail on water metrics by location, including information on baseline waster stress by location. 2021-22 Corporate Responsibility Report, p 72 , p 96 , and p 97 2021 Intel Annual Report on Form 10-K , p 16 2022 Proxy Statement , p 52 Waste Management (1) Amount of hazardous waste from manufacturing, (2) percentage recycled TC-SC- 150a.1 (1) 148,000 metric tons (2) 74% recycled. 2021-22 Corporate Responsibility Report, p 74 2021 Intel Annual Report on Form 10-K , p 16 2022 Proxy Statement , p 52 Employee Health & Safety Description of efforts to assess, monitor, and reduce exposure of employees to human health hazards TC-SC- 320a.1 We disclose our strategy for employee health, safety and wellness, including our company-wide certification to ISO 45001. 2021-22 Corporate Responsibility Report, p 35 2021 Intel Annual Report on Form 10-K , p 14 2022 Proxy Statement , p 50 Employee Health & Safety Total amount of monetary losses as a result of legal proceedings associated with employee health and safety violations TC-SC- 320a.2 While we do not disclose this information, we do report on Environmental, Health, and Safety Violations and subsequent corrective actions. 2021-22 Corporate Responsibility Report, p 98 1 The “Intel Metric or Qualitative Disclosure” column references the specific disclosure(s) included in the 2021-22 Corporate Responsibility Report and therefore may vary from the breadth and context of disclosure(s) included in the 2021 Intel Annual Report on Form 10-K and 2022 Proxy Statement, if applicable. Introduction Our Business Responsible Inclusive Sustainable Enabling Appendix
92 intel.com/responsibility 2021-22 Corporate Responsibility Report SASB and TCFD Framework Alignment, continued Topic Accounting Metrics Code Intel Metric or Qualitative Disclosure Disclosure Location 1 Recruiting & Managing a Global & Skilled Workforce Percentage of employees that are: (1) foreign nationals and (2) located offshore TC-SC- 330a.1 We do not disclose the first metric as we do not believe a single percentage of foreign nationals is a useful metric for our business given our global business model, but we do disclose a breakdown of our workforce by region. We disclose additional human capital metrics that we believe are more effective for assessing this aspect of our performance, including diversity and inclusion, employee engagement, training and development, and responsible supply chain metrics. 2021-22 Corporate Responsibility Report, p 20 , p 21 , p 32 , p 38 , and p 49 2021 Intel Annual Report on Form 10-K , p 13 2022 Proxy Statement , p 49 Product Lifecycle Management Percentage of products by revenue that contain IEC 62474 declarable substances TC-SC- 410a.1 While we do disclose information on our strategy and approach to product ecology and supplier requirements for declarable substances, we do not believe a single percentage of revenue is an effective metric for evaluating risk and performance in this area. 2021-22 Corporate Responsibility Report, p 67 Material Declaration Data Sheet (MDDS) database website Product Lifecycle Management Processor energy efficiency at a system-level for: (1) servers, (2) desktops, and (3) laptops TC-SC- 410a.2 We do not disclose single percentages for these product categories, given the wide range of products we produce in each category and the continued release of new products. We believe more decision-useful information is our disclosure regarding our overall strategy for product energy efficiency, supporting goals, industry collaborations, and public policy engagements. 2021-22 Corporate Responsibility Report, p 71 , p 77 , and p 7 8 Materials Sourcing Description of the management of risks associated with the use of critical materials TC-SC- 440a.1 We provide disclosure on our management approach to responsible minerals sourcing. With respect to rare earth elements, Intel has thoroughly reviewed product and supply chain impacts and determined that although certain regional supplies may fluctuate, Intel has sufficient existing supply, alternative sourcing, and/or low risk material availability within our manufacturing and supply chain. Intel has confirmed that access to rare earth mineral supplies represents a low risk to impact production or delivery of goods. 2021-22 Corporate Responsibility Report, p 42 and p 43 SEC Conflict Minerals Filing Intel Statement on Rare Earth IP Protection & Competitive Behavior Total amount of monetary losses as a result of legal proceedings associated with anti- competitive behavior regulations TC-SC- 520a.1 Information on legal proceedings is disclosed in our Annual Report on Form 10-K and in our Quarterly Reports on Form 10-Q, available on our Investor Relations website. 2021 Intel Annual Report on Form 10-K , p 105 Investor Relations website 1 The “Intel Metric or Qualitative Disclosure” column references the specific disclosure(s) included in the 2021-22 Corporate Responsibility Report and therefore may vary from the breadth and context of disclosure(s) included in the 2021 Intel Annual Report on Form 10-K and 2022 Proxy Statement, if applicable. Introduction Our Business Responsible Inclusive Sustainable Enabling Appendix
93 intel.com/responsibility 2021-22 Corporate Responsibility Report SASB and TCFD Framework Alignment, continued TCFD. TCFD has developed a voluntary framework for use by companies to provide information to investors, lenders, insurers, and other stakeholders on climate-related financial risk disclosure. Below, we have outlined how our existing reporting aligns with the recommended disclosure. We will continue to evaluate opportunities to evolve our disclosure moving forward based on discussions with our investors and stakeholders. Disclosure Area TCFD Recommended Disclosure Intel Metric or Qualitative Disclosure Disclosure Location Governance Disclose the organization’s governance around climate-related risks and opportunities. Responsibility for oversight of corporate social responsibility issues, including climate change, has been included in the Corporate Governance and Nominating Committee Charter since 2003. Intel follows an integrated approach to addressing climate change with multiple teams responsible for managing climate-related activities, initiatives, and policies, including manufacturing and operations, government and public affairs, supply chain, and product teams. Strategies, progress toward goals, and regulatory developments are reviewed with senior executives from these teams on a regular basis. 2021-22 Corporate Responsibility Report, p 25 2022 Proxy Statement , p 35 and p 38 CDP Climate Change Survey Strategy Disclosure of the actual and potential impacts of climate- related risks and opportunities on the organization’s businesses, strategy, and financial planning where such information is material. We describe our climate-related risks and opportunities in our Corporate Responsibility Report (in the “Our Business” and “Climate and Energy” sections), the Intel Climate Change Policy Statement, and the risk-factors section of our Annual Report on Form 10-K. We focus on reducing our own direct climate “footprint”—the emissions resulting from our own operations, our supply chain, and the marketing and use of our products. We also focus on increasing our “handprint”—the ways in which Intel® technologies help others reduce their footprints. In addition, we collaborate with others to drive industry-wide improvements and policy change. For two decades, we have set aggressive greenhouse gas (GHG) reduction goals to conserve energy and minimize air emissions. Over that time, our Scope 1 and 2 emissions have decreased by about 19% on an absolute basis. In 2021, subject matter experts from multiple business groups partnered to further drive the integration of climate change considerations into our processes for assessing risks and opportunities and to conduct a climate change scenario analysis. 2021-22 Corporate Responsibility Report, p 68 2021 Intel Annual Report on Form 10-K , p 55 and p 58 Intel Climate Change Policy CDP Climate Change Survey Risk Management Disclose how the organization identifies, assesses, and manages climate-related risks. Our overall approach to risk management is described in our Proxy Statement and our risk factors are described in our Annual Report on Form 10-K. Additional detail on our proactive efforts to reduce our climate change impacts is included in our Corporate Responsibility Report, primarily in the Climate and Energy section as well as our CDP Climate Change Survey. This includes detail regarding our investments in renewable electricity, energy conservation, and product energy efficiency. For example, in 2021, we continued our 100% renewable electricity commitment for our US, Europe, Israel and Malaysia, and 80% globally. We also conserved 159 million kWh of electricity in 2021. We also describe our proactive engagements with policymakers on climate and energy issues in our Corporate Responsibility Report and the Intel Climate Change Policy. We proactively engage with our stakeholders to understand impacts of both potential regulatory requirements and also changing expectations of stakeholders, including our investors, customers, and local communities. 2021-22 Corporate Responsibility Report, p 26 , p 28 , and p 68 2021 Intel Annual Report on Form 10-K , p 15 and p 58 2022 Proxy Statement , p 30 Intel Climate Change Policy CDP Climate Change Survey Metrics and Targets Disclosure of the metrics and targets used to assess and manage relevant climate-related risks and opportunities where such information is material. Our public climate-related metrics, goals and targets, as well as our Scope 1, 2, and 3 emissions data are included in our annual Corporate Responsibility Report and also reported through the CDP Climate Change Survey. 2021-22 Corporate Responsibility Report, p 70 CDP Climate Change Survey Introduction Our Business Responsible Inclusive Sustainable Enabling Appendix
94 intel.com/responsibility 2021-22 Corporate Responsibility Report UN Sustainable Development Goals The UN Sustainable Development Goals (SDGs) are aimed at stimulating action in areas of critical importance for humanity and the planet. We believe that the achievement of the SDGs will be critical to creating a life of dignity and opportunity for all, and we believe technology will play a key role in achieving the SDGs. We use the goals below to inform the ongoing development of our strategies, initiatives, and long-term priorities, including our 2030 strategy and goals. We believe that information communications technology (ICT) can play an enabling role in the implementation of all of the SDGs. Intel, Nethope, and the UN Foundation developed an SDG ICT Playbook that outlines technology trends, opportunities, and innovative case studies that global leaders can reference as they develop their strategies and actions to address the SDGs. Responsible SDG 3: Ensure healthy lives and promote well-being for all at all ages SDG 8: Promote inclusive and sustainable economic growth, employment, and decent work for all SDG 12: Ensure sustainable consumption and production patterns Through our employee health, safety, and wellness goals and our supplier health and safety requirements, we promote good health and well-being. Our efforts are designed to protect vulnerable workers throughout the global supply chain, and include setting clear supplier expectations and investing in assessments, audits, and capability-building programs. We collectively address issues through our leadership in the Responsible Business Alliance, including industry initiatives on key issues such as advancing responsible minerals sourcing, addressing human rights risks such as forced and bonded labor, and improving transparency on the environmental impacts in the global electronics supply chain. Inclusive SDG 4: Ensure inclusive and quality education for all and promote lifelong learning SDG 5: Achieve gender equality and empower women and girls SDG 8: Promote inclusive and sustainable economic growth, employment, and decent work for all SDG 10: Reduce inequality within and among countries To shape the future of technology, we believe we must be representative of that future. Since 2019, we have achieved gender pay equity globally and maintained racial/ethnic pay equity in the US. We also met our commitment to reach more than $1 billion in annual spending with tier 1 and tier 2 certified diverse suppliers, 1 and collaborate with others to encourage more women and underrepresented minorities to enter and succeed in technology careers. We provide our expertise and both financial and in-kind support to help communities, governments, NGOs, and educators achieve their goals. Sustainable SDG 6: Ensure access to water and sanitation for all SDG 7: Ensure access to affordable, reliable, sustainable, and modern energy for all SDG 9: Build resilient infrastructure, promote inclusive and sustainable industrialization, and foster innovation SDG 12: Ensure sustainable consumption and production patterns SDG 13: Take urgent action to combat climate change and its impacts We have made significant investments and set aggressive goals to reduce the environmental footprint of our global manufacturing operations, including goals and policies on climate change and water conservation. We have established new 2030 sustainability goals, and will continue to invest in conservation projects, alternative energy, and product energy efficiency. We collaborate with governments, leading companies, and non - profits on innovative environmental projects, and proactively invest in our technology “handprint” to empower others to use Intel technology to reduce their environmental footprints and support sustainable consumption and production. In 2021, we also made progress toward our 2030 net positive water use goal. Enabling We advance the SDGs above also through the application of our technology and the expertise and passion of our employees. Through the Intel RISE Technology Initiative, we are funding technology projects to drive social and environmental impact in partnership with our customers. We also encourage our employees to share their experience, talents, and passions in communities around the world, and provide volunteer opportunities to help address local and global problems. The Intel Foundation acts as a catalyst for change by amplifying the investments of Intel employees across a broad spectrum of personal philanthropy and volunteerism and by working with NGOs, nonprofits, and governments on innovative programs that support underserved and disenfranchised populations. 1 We recognize certified diverse suppliers as businesses that are at least 51% owned, operated, and controlled by any of the following categories: women; minorities as recognized by the country or region where the business was established; veterans/military service-disabled veterans; persons who are lesbian, gay, bisexual, or transgender; or persons with disabilities. While Intel recognizes these categories, they may vary in accordance with local law. Introduction Our Business Responsible Inclusive Sustainable Enabling Appendix
95 intel.com/responsibility 2021-22 Corporate Responsibility Report Non-GAAP Financial Measures Following are the reconciliations of our most comparable US GAAP measures to our non-GAAP measures presented: Years Ended (In Millions, Except per Share Amounts) Dec. 25, 2021 Dec. 26, 2020 Dec. 28, 2019 Operating Income $19,456 $23,678 $22,035 Acquisition-related adjustments 1,492 1,416 1,324 Restructuring and other charges 2,626 198 393 NAND Memory Business (1,369) (937) 600 Non-GAAP Operating Income $22,205 $24,355 $24,352 Earnings per Share – Diluted $4.86 $4.94 $4.71 Acquisition-related adjustments 0.36 0.33 0.29 Restructuring and other charges 0.65 0.05 0.09 (Gains) losses from divestiture – – (0.16) Ongoing mark-to-market on marketable equity securities 0.03 0.03 (0.06) NAND Memory Business (0.33) (0.22) 0.13 Income tax effect (0.1) (0.03) (0.03) Non-GAAP Earnings per Share – Diluted $5.47 $5.10 $4.97 Years Ended (In Millions) Dec. 25, 2021 Dec. 26, 2020 Dec. 28, 2019 Dec. 29, 2018 Dec. 30, 2017 Net cash provided by operating activities $29,991 $35,384 $33,145 $29,432 $22,110 Additions to property, plant, and equipment (18,733) (14,259) (16,213) (15,181) (11,778) Free cash flow $11,258 $21,125 $16,932 $14,251 $10,332 Net cash used for investing activities ($25,167) ($20,796) ($14,405) ($11,239) ($15,762) Net cash provided by (used for) financing activities ($5,862) ($12,917) ($17,565) ($18,607) ($8,475) Introduction Our Business Responsible Inclusive Sustainable Enabling Appendix
96 intel.com/responsibility 2021-22 Corporate Responsibility Report Intel 2021 Water Inventory by Location and Source The following table details our water use, discharge, consumption, and conservation by source and destination for Intel sites around the world. Our fresh water withdrawals totaled 14.3 billion gallons (54.1 megaliters) in 2021. Approximately 82% of the water used at our sites was sent back to municipal treatment operations, where it was treated so that it could be used for other purposes or to recharge surface or groundwater sources. For additional information, see the Sustainable section of this report. To prepare our global water inventory, we follow established internal procedures for collecting, reviewing, and reporting water data. Internal data collection and reporting practices are outlined within corporate standards and guidance documents developed by Intel. After a corporate-wide inventory was prepared, it was reviewed internally and water conservation data were assured by Apex Companies LLC (see the “ Independent Limited Assurance Statement ” in this Appendix). Reported in Megaliters per Year Location 1 Water Withdrawals by Source (Total water usage) – Megaliters per Year Water Discharged (return) 3 Water Consumption Water Conserved Water Restored (Watershed projects) Net Positive Water Progress (% returned + restored) Water Source Discharge Destination (Of municipality) River Basin Third-Party Water Withdrawals 2 (Purchased water sources) Water Withdrawals (On-site water sources) Total Fresh Water Withdrawals (All sources) Total Water Withdrawals (All sources) Fresh Water from Surface Water Sources Fresh Water from Ground Water Sources Sea Water Sources Reclaimed Water Surface Water Source (Rainwater) Ground Water Source (On-site well) China Chengdu 900 – – – – – 900 900 360 540 – 0 95% Surface Surface Yangtze Dalian 12,162 – – – – – 12,162 12,162 12,111 51 3,069 Surface Sea Pearl Shanghai – Zizhu 4 90 – – 0.4 – 90 90 81 9 0.4 Surface, Ground Surface Yangtze Costa Rica San Jose – 242 – – 0.02 54 296 296 122 1 74 0.2 184 103% Ground Surface San Juan India Bangalore: Sarjapur 5 77 – – – 19 – 96 96 – 96 49 377 394% Surface N/A (Zero discharge) Arkavathi and Cauvery Ireland Leixlip 7,1 74 – – – – – 7,1 74 7,1 74 6,506 668 2,053 0 91% Surface Surface Shannon Israel Haifa 5 25 101 – – – 25 126 50 76 11 0 63% Sea (Primary); Surface & Ground (Secondary) Sea (Primary); Third-Party Reuse (Secondary) Mediterranean Sea (Coastal aquifer) Jerusalem 5 7 29 – – – 7 36 27 9 – Qiryat Gat 5 827 3,310 – – – 827 4,137 2,642 1,495 5,704 Malaysia Kulim 970 – – – – – 970 970 690 280 74 0 61% Surface Surface Kedah Penang 716 – – – 0.1 – 716 716 345 371 23 Pulua Pinang Mexico Guadalajara – 58 – – – – 58 58 44 14 21 0 75% Ground Ground Lerma-Santiago Poland Gdansk – 9 – – – – 9 9 6 3 1 0 74% Ground Sea Wisla ¹ We follow established internal procedures and thresholds to determine which sites are included in the inventory. ² Third-party water withdrawals represent water purchased from the local municipality. ³ Third-party water discharges/returns represent water sent to the local municipality for reuse or surface/groundwater recharge. ⁴ Sites located in area experiencing extremely high water stress, based on WRI’s Aqueduct Water Risk Atlas (2021). 5 Site located in area experiencing high water stress, based on WRI’s Aqueduct Water Risk Atlas (2021). Introduction Our Business Responsible Inclusive Sustainable Enabling Appendix
97 intel.com/responsibility 2021-22 Corporate Responsibility Report Intel 2021 Water Inventory by Location and Source, continued Reported in Megaliters per Year Location 1 Water Withdrawals by Source (Total water usage) – Megaliters per Year Water Discharged (return) 3 Water Consumption Water Conserved Water Restored (Watershed projects) Net Positive Water Progress (% returned + restored) Water Source Discharge Destination (Of municipality) River Basin Third-Party Water Withdrawals 2 (Purchased water sources) Water Withdrawals (On-site water sources) Total Fresh Water Withdrawals (All sources) Total Water Withdrawals (All sources) Fresh Water from Surface Water Sources Fresh Water from Ground Water Sources Sea Water Sources Reclaimed Water Surface Water Source (Rainwater) Ground Water Source (On-site well) United States Arizona: Chandler 5 1,770 – – – – 1,770 1,770 1,071 699 517 8,002 106% Surface Ground; Third Party Colorado/ Salt Arizona: Ocotillo 5 12,875 – 2,937 – – 12,875 15,812 12,978 2,834 11,460 California: Bowers - Santa Clara 215 – – – – – 215 215 144 71 24 Surface Surface to Sea Santa Clara California: Folsom 5 330 – – – – – 330 330 68 262 – California: Mission – Santa Clara 300 – – 51 – – 300 351 225 126 – New Mexico: Rio Rancho 5 – 253 – – – 2,784 3,037 3,037 2,680 357 2,102 Ground Surface Bravo Oregon: Aloha 1,119 – – – – – 1,119 1,119 798 321 – Surface Surface Columbia Oregon: Hawthorn Farm 117 – – – – – 117 117 88 29 53 Oregon: Jones Farm 308 – – – – – 308 308 231 77 0 Oregon: Ronler Acres 9,995 – – – – – 9,995 9,995 8,161 1,834 9,942 Texas: Austin 63 – – – – – 63 63 48 15 0 Surface Surface Colorado Vietnam Ho Chi Minh City 643 – – – – – 643 643 263 380 106 0 41% Surface Surface Mekong To t a l 51,245 3,440 2,988 20 2,838 54,102 60,530 49,739 10,791 35,210 8,563 99% ¹ We follow established internal procedures and thresholds to determine which sites are included in the inventory. ² Third-party water withdrawals represent water purchased from the local municipality. ³ Third-party water discharges/returns represent water sent to the local municipality for reuse or surface/groundwater recharge. ⁴ Sites located in area experiencing extremely high water stress, based on WRI’s Aqueduct Water Risk Atlas (2021). 5 Site located in area experiencing high water stress, based on WRI’s Aqueduct Water Risk Atlas (2021). Introduction Our Business Responsible Inclusive Sustainable Enabling Appendix
98 intel.com/responsibility 2021-22 Corporate Responsibility Report 2021 Environmental, Health, and Safety Violations Each year we share information about regulatory visits to Intel sites across the globe and Notices of Violation (NOVs) received over the course of the year. In 2021, government officials made 152 visits (including audits and inspections) to Intel sites across the globe, including 54 health and safety agency inspections, 28 fire protection agency inspections and 70 environmental agency inspections. Details on NOVs 1 and our subsequent corrective actions are provided in the table below: Location Violation Fine Intel’s Corrective Action Santa Clara, California The fire department conducted an inspection of our Mission Campus. There were a total of four findings related to labeling and management of hazardous waste containers. $0 Inspection report findings were closed promptly. Leixlip, Ireland The EPA conducted a remote compliance assessment and issued a site visit report noting one non-compliance relating to the failure to protect one groundwater monitoring well from damage under the site’s industrial emissions license. $0 The well was repaired and restored. Additional actions were taken to prevent reoccurrence. Aloha, Oregon Two acid waste neutralization tanks experienced high pH alarms. Manual controls were performed while technicians manually closed the caustic injection valve. The acid eventually stabilized the pH below the discharge limit. The wastewater outfall went above the permitted limit for 67 minutes. $0 The event was reported to the local agency. The tank level was brought down, and pH remained stable. The caustic control valve was investigated and found to be functioning properly. Further investigation revealed that the air pressure to the valve was below the recommended operating pressure. The air pressure was then raised and the operations team was able to get the valve to fully seat. San Jose, California The fire department performed an inspection of the San Jose Innovation Campus. During the site walk, the inspector noted four rooms housing uninterruptible power supplies (UPSs) with lead acid batteries that were missing hazard identification signs on the doors and issued two NOV letters, one for each building, requesting corrections. $0 Signage was added to the doors of the rooms. San Jose, California The fire department performed an inspection of the fire sprinkler and alarming systems at the San Jose Innovation Campus. The inspector observed three minor items needing correction related to trouble alarms on fire alarm control panels and documentation of a five-year sprinkler test. $0 Corrections were made and the inspector approved and closed the inspection. Turgeneva, Russia A fire inspection followed a UPS battery event in December 2020. The final report included findings related to furniture located in passage and near a fire hose, smoke, and the width of doors to evacuation staircase. $2,000 Corrective changes were implemented. A certified company completed assessment for the building. Recommendations were dispositioned with the local jurisdiction. Fort Collins, Colorado During an annual fire department inspection of the Ft. Collins campus, the inspector noted one finding related to the master key for the campus. $0 The deficiency was corrected immediately after the inspection. A sustaining method was established to ensure that the master key works in doors on campus. Ronler Acres, Oregon The fire and rescue department performed fire-life safety inspections of the RS5 and RS6 buildings with findings documented in reports. $0 Findings are being tracked to closure by the site fire protection engineer with regular communications to the fire and rescue department. Follow-up walkdowns are performed with fire and rescue department to verify closure of each finding. The site implemented a robust process for capturing, assigning, closing, tracking, communicating, and verifying closure of findings. Aloha, Oregon A decommissioned chemical metering pump was being removed from the acid waste neutralization system. After the drain of the sulfuric acid line was completed, a flush of residual chemical and water was performed that was routed back into the tank. As a result, the wastewater outfall dropped below the permitted limit for approximately three minutes. $100 The local agency was notified within two hours per the site’s wastewater permit. Individuals were coached on non-standard work and preventative measures. Isolation is required for work that may involve loss of control or indication of last stage acid waste neutralization tanks. 1 Our definition of an NOV includes any written notice from an agency stating Intel is not in compliance with a regulation or other legal requirement, including administrative items. Introduction Our Business Responsible Inclusive Sustainable Enabling Appendix
99 intel.com/responsibility 2021-22 Corporate Responsibility Report Top 100 Production and Service Suppliers These companies represent approximately 75% of Intel’s total supply chain spends in 2021. Advanced Semiconductor Engineering EBARA Corporation KellyOCG Samsung Semiconductor, Inc. Advantest America Inc Edwards Ltd Keysight Technologies, Inc. 1,3 SCREEN Semiconductor Solutions Co., Ltd. AEM Singapore Pte. Ltd. Elitegroup Computer Systems Co., LTD. Kintetsu World Express Shin-Etsu Chemical Co., Ltd. AGC, Inc. 1,9 Exyte AG KLA Corporation Shinko Electric Industries Co. LTD. Air Liquide Exyte Technology Kokusai Electric Corporation 1,3 Siemens Industry Software, Inc. Air Products and Chemicals, Inc. Fabrinet Lam Research Corporation 1,2,4 Siemens Industry, Inc. Amkor Technology, Inc. Flex Ltd. Lasertec Corporation 1,3 Siltronic AG 1,11 Applied Materials Inc. 1,2,4 FormFactor, Inc. 1,3 Linde plc SK hynix Inc. ASM International N.V. 1,10 FUJIFILM Electronic Materials 1,11 Linde LienHwa Industrial Gases Co., Ltd. Skanska USA Building Inc. ASML 1,3 GCON, Inc. Marvell Technology, Inc. SUMCO Corporation AT & S Austria Technologie & Systemtechnik AG 1,3 Gemtek Technology Co., Ltd. Merck KGaA Darmstadt, Germany Sundt Construction, Inc. Avantor, Inc. GlobalWafers Co., LTD. Micron Technology, Inc Super Micro Computer, Inc. Azurewave Technologies HCL Technologies Ltd 1,7 Microsoft Corporation Synopsys, Inc. 1,3 Cadence Design Systems, Inc. Hensel Phelps Mitac Holdings Corporation Taiwan Semiconductor Manufacturing Company Ltd Carl Zeiss SMT GmbH 1,3 Hewlett Packard Enterprise Company Mitsubishi Gas Chemical Company Inc. Technoprobe S.p.A. 1,3 CMC Materials, Inc. Hitachi High-Tech Corporation Moses Lake Industries (TAMA Chemicals) Thermo Fisher Scientific Inc. Compass Group PLC Hoffman Construction Murata Machinery, Ltd. 1,3 Tokyo Electron Limited 1,2 Courier Network Inc. Honeywell Electronic Materials NetApp Tokyo Ohka Kogyo Co., LTD 1,3 Cymer IBIDEN Co., LTD. Nikon Corporation 1,7 Trane Technologies plc Daifuku Co., LTD Infosys Limited NNR Global Logistics Ultra Clean Technologies (UCT) DB Schenker Jacobs Engineering Group, Inc. NuFlare Technology, Inc. Unimicron Technology Corporation Deloitte Touche Tohmatsu Limited JE Dunn Construction Pegatron Corporation United Microelectronics Corp Dentsu Group, Inc. JLL 1,12 Powertech Technology Inc. UPPRO Ltd. Deutsche Post DHL Group JSR Corporation Rinchem Company Inc. UST Holdings Ltd. DSV A/S JX Nippon Mining & Metals Corporation 1,3 Samsung Electro-Mechanics Co., Ltd. VMLY&R 1 2021 EPIC Award Winner. 2 Outstanding. 3 Distinguished. 4 Distinction in Supplier Diversity. 5 Distinction in Safety. 6 Distinction in Innovation. 7 Valued results in Cost. 8 Valued results in Quality. 9 Valued results in Availability. 10 Valued results in Technology. 11 Valued results in Sustainability. 12 Valued results in Supplier Diversity. 13 Valued results in Safety. 14 Valued results in Innovation. Introduction Our Business Responsible Inclusive Sustainable Enabling Appendix
100 intel.com/responsibility 2021-22 Corporate Responsibility Report Acronym Index 3TG: Tin, tantalum, tungsten, and gold A ADAS: Advanced driver-assistance system AI: Artificial intelligence AISES: American Indian Science and Engineering Society ANSI: American National Standards Institute APB: Annual Performance Bonus ASIC: Application-specific integrated circuit AV : Autonomous vehicle C CAHRA: Conflict-affected and high-risk area CEC: California Energy Commission CEI: Corporate Equality Index CEO: Chief Executive Officer CGN Committee: Corporate Governance and Nominating Committee CO: Carbon monoxide CO 2 : Carbon dioxide CO 2 e: Carbon dioxide equivalent CPO: Chief People Officer CPU: Central processing unit CRT: Cobalt Response Template C-SCRM: Cyber supply chain risk management CTD: Cumulative trauma disorder D DARPA: Defense Advanced Research Projects Agency DEI: Diversity, equity, and inclusion or Disability Equality Index DRC: Democratic Republic of the Congo E ECOC: Ethics and Compliance Oversight Committee EEO: Equal Employment Opportunity EHS: Environmental, health, and safety EPA: Environmental Protection Agency EPEAT: Electronic Product Environmental Assessment Tool EPIC: Excellence, Partnership, Inclusion, and Continuous Improvement ERG: Employee Resource Group EPRM: European Partnership for Responsible Minerals EPS: Earnings per share ESG: Environmental, social, and governance F FPGA: Field-programmable gate array G GDP: Gross domestic product GHG: Greenhouse gas GPP: Green Power Partnership GPU: Graphics processing unit GRI: Global Reporting Initiative H HAP: Hazardous air pollutant HBCU: Historically Black college or university HR: Human Resources HRIA: Human rights impact assessment I ICT: Information and communications technology IDAN: Intel Disability and Accessibility Network IDM: Integrated device manufacturer IFS: Intel Foundry Services I/O: Input/output IP: Intellectual property IPAC: Intel Political Action Committee IRTI: Intel RISE Technology Initiative ISO: International Organization for Standardization iTSCi: International Tin Supply Chain Initiative L LEED: Leadership in Energy and Environmental Design LGBT+: Lesbian, gay, bisexual, and transgender/transsexual + Introduction Our Business Responsible Inclusive Sustainable Enabling Appendix
101 intel.com/responsibility 2021-22 Corporate Responsibility Report M MaaS: Mobility-as-a-Service MGM: Million Girls Moonshot MRC: Management Review Committee N NGO: Non-governmental organization NIC: Network interface controller NIST: National Institute of Standards and Technology NOV: Notice of violation NOx: Nitrogen oxides NSF: National Science Foundation NUC: Next Unit of Computing O OALC: Out and Ally Leadership Council OCP: Open Compute Project ODM: Original design manufacturer OECD: Organisation for Economic Co-operation and Development OEM: Original equipment manufacturer OSHA: Occupational Safety and Health Administration P PFC: Perfluorocarbon P LT : Pandemic Leadership Team PM: Particulate matter PPA: Public-Private Alliance for Responsible Minerals Trade PRTI: Pandemic Responsible Technology Initiative R R&D: Research and development RBI: Responsible Business Alliance REACH: European Union’s Registration, Evaluation, Authorization, and Restriction of Chemicals RISE: Responsible, inclusive, sustainable, and enabling RLI: Responsible Labor Initiative RMAP: Responsible Minerals Assurance Process RMI: Responsible Minerals Initiative RRA: Risk Readiness Assessment RSS: Responsibility-Sensitive Safety RSU: Restricted stock unit S SAQ: Self-Assessment Questionnaire SASB: Sustainability Accounting Standards Board SBTI: Science-Based Targets Initiative SDA: Sectoral decarbonization approach SDL: Security Development Lifecycle SEC: US Securities and Exchange Commission SoC: System-on-a-Chip SPARC: Supplier Program to Accelerate Responsibility and Commitment SRC: Supplier Report Card STEAM: Science, technology, engineering, arts, and math STEM: Science, technology, engineering, and math T TCFD: Task Force on Climate-Related Financial Disclosure U URM: Underrepresented minority US GAAP: US Generally Accepted Accounting Principles V VAP: Validated Assessment Program VOC: Volatile organic compound W WAI: Women in AI WiSci: Women in Science Introduction Our Business Responsible Inclusive Sustainable Enabling Appendix
www.intel.com News and information about Intel® products and technologies, customer support, careers, worldwide locations, corporate responsibility and sustainability, and more. www.intc.com Stock information, earnings and conference webcasts, annual reports, and corporate governance and historical financial information. © 2022 Intel Corporation. Intel, the Intel logo, and other Intel marks are trademarks of Intel Corporation or its subsidiaries. Other names and brands may be claimed as the property of others.