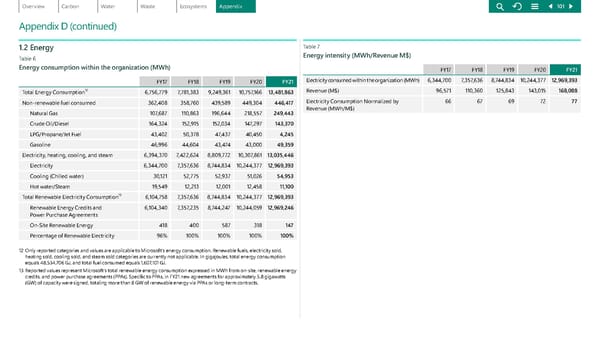
Appendix D (continued) 1.2 Energy Table 6 Energy consumption within the organization (MWh) FY17 FY18 FY19 FY20 FY21 Total Energy Consumption 12 6,756,779 7,781,383 9,249,361 1 0 ,757,1 6 6 13,481,863 Non-renewable fuel consumed 362,408 358,760 439,589 449,304 446,417 Natural Gas 1 07, 6 87 110,863 196,644 218,557 249,443 Crude Oil/Diesel 164,324 152,915 152,034 147,297 143,370 LPG/Propane/Jet Fuel 43,402 50,378 47, 437 40,450 4,245 Gasoline 46,996 44,604 43 , 474 43,000 49,359 Electricity, heating, cooling, and steam 6,394,370 7, 4 2 2 , 6 24 8,809,772 10,307,861 13,035,446 Electricity 6,344,700 7, 357, 636 8 ,74 4 , 83 4 10,244,377 12,969,393 Cooling (Chilled water) 30,121 52,775 52,937 51,026 54,953 Hot water/Steam 19,549 12,213 12,001 12,458 11,100 Total Renewable Electricity Consumption 13 6,104,758 7, 357, 636 8 ,74 4 , 83 4 10,244,377 12,969,393 Renewable Energy Credits and Power Purchase Agreements 6,104,340 7, 357, 2 35 8 ,74 4 , 247 10,244,059 12,969,246 On-Site Renewable Energy 418 400 587 318 147 Percentage of Renewable Electricity 96% 100% 100% 100% 100% 12 Only reported categories and values are applicable to Microsoft's energy consumption. Renewable fuels, electricity sold, heating sold, cooling sold, and steam sold categories are currently not applicable. In gigajoules, total energy consumption equals 48,534,706 GJ, and total fuel consumed equals 1,607,101 GJ. 13 Reported values represent Microsoft's total renewable energy consumption expressed in MWh from on-site, renewable energy credits, and power purchase agreements (PPAs). Specific to PPAs, in FY21 new agreements for approximately 5.8 gigawatts (GW) of capacity were signed, totaling more than 8 GW of renewable energy via PPAs or long-term contracts. Table 7 Energy intensity (MWh/Revenue M$) FY17 FY18 FY19 FY20 FY21 Electricity consumed within the organization (MWh) 6,344,700 7, 357, 636 8 ,74 4 , 83 4 10,244,377 12,969,393 Revenue (M$) 96,571 110,360 125,843 143,015 168,088 Electricity Consumption Normalized by Rev enue (MWh /M$) 66 67 69 72 77 101
 Environmental Sustainability Report | Microsoft Page 100 Page 102