HP Sustainable Impact Report
HP Sustainable Impact Report 2021
Contents Sustainable Impact Footprint Integrity and human rights Supply chain responsibility Operations Products and solutions Appendix Table of contents See the standalone 2021 HP Sustainable Impact Report Executive Summary. 3 Letter from our President and CEO 28 Supply chain responsibility 54 Greenhouse gas emissions 91 Appendix 4 About HP 29 Approach 56 Water 92 About this report 31 Human rights 57 Waste 94 Policies and standards 5 Sustainable Impact 58 Community giving and volunteerism 31 Health and safety 58 HP Foundation programs 95 Independent accountants’ review report 6 Sustainable Impact strategy 32 Responsible minerals sourcing 98 ESG material topics 10 Recognition 60 Disaster recovery and resilience 34 Supplier diversity 60 Employee volunteerism 100 Sustainability Bond progress statement 11 Governance 35 Environmental impact 101 United Nations Global Compact index 11 Stakeholder engagement 61 Data 36 Greenhouse gas emissions 102 United Nations Sustainable Development 12 ESG materiality 38 Water 66 Products and solutions Goals index 38 Waste 67 Circular and net zero carbon economy 103 Sustainability Accounting Standards 14 Footprint 39 Performance monitoring and evaluation Board index 15 Carbon and climate impact 70 Product circularity 104 Task Force on Climate-Related Financial 43 Data 74 Energy efficiency 16 Water Disclosures index 75 Sustainable materials 105 WEF IBC Stakeholder Capitalism 17 Data 45 Operations 81 Forest positive Metrics index 20 Integrity and human rights 46 Our employees 82 Product responsibility 106 GRI index 46 Diversity, equity, and inclusion 82 Product safety 112 Endnotes 21 Ethics and anti-corruption 49 Employee engagement 83 Product security and privacy 21 Ethics 50 Employee development 84 Social impact 22 Anti-corruption 51 Compensation and benefits 85 Education 23 Human rights 51 Health and safety 87 Healthcare 25 Privacy 52 Wellbeing 88 Accessibility 26 Cybersecurity 53 Our facilities 89 Data 27 Public policy 53 Environmental, health, and safety management Cover image: Empowering girls HP partner, Girl Rising, uses the power of storytelling to highlight the connection between girls’ education and climate change. 2 2021 HP Sustainable Impact Report www.hp.com/sustainableimpact
Contents Sustainable Impact Footprint Integrity and human rights Supply chain responsibility Operations Products and solutions Appendix Letter from our President and CEO We are confronting a set of global challenges that are personal systems and print product portfolio to 13%, as Digital Equity testing the very foundation on which our society is built. we aim for 30% by 2025. We are also committed to helping break down the From an ongoing pandemic to our accelerating climate We also are disrupting the US$10 billion fiber-based barriers that exclude many from participating in the crisis to persistent inequality, these challenges impact sustainable packaging market, with our 3D printing– digital economy. Nearly 3 billion people around the all of us. And the way we respond will help shape our enabled HP Molded Fiber Advanced Tooling Solution and world remain offline due to lack of access, affordability, future in profound and lasting ways. acquisition of Choose Packaging, the inventor of the only or usability. The COVID-19 pandemic exposed the depth Companies like ours have a critical role to play in known commercially available zero-plastic paper bottles. of this issue and even exacerbated it, as many schools helping solve these challenges. That’s why, in 2021, and businesses began operating remotely. we announced one of the most comprehensive We are partnering with leading conservation and That’s why, in 2021, we pledged to accelerate digital environmental and social impact agendas in our environmental organizations, including the World equity for 150 million people by the end of the decade— industry—with aggressive goals focused on climate Wildlife Fund, Conservation International, the Arbor Day a goal we aim to meet with the collaboration and action, human rights, and digital equity. And we have Foundation, and the Jane Goodall Institute, to invest support of key priority partners, like Girl Rising, NABU, been taking decisive action to meet them. in forest restoration and responsible management to MIT Solve, and Aspen Digital, through the Digital Equity counteract deforestation for non-HP paper used in HP Accelerator program launched in February 2022. In our 21st annual Sustainable Impact report, we share printers and print services. Since 2020, all HP brand the progress we are making. There are areas where we paper and paper-based packaging for home and office Building a stronger HP are leading but also opportunities for us to do more. printers and supplies, PCs, and displays have been From our earliest days as a company, HP has been Our teams are operating with the deep sense of derived from recycled or certified sources. a place where innovation drives extraordinary urgency needed to make continuous improvements, Finally, we are broadening our impact by engaging our contributions to humanity. Time and again, our people while forging partnerships to maximize our impact. hundreds of production suppliers and thousands of have had the vision to see entirely new possibilities for While no single company, sector, or even country can non-production suppliers in sustainability programs. the role we can play in the world—and the ingenuity to solve the enormous global challenges before us, we In early 2022, we expanded our Amplify Impact channel create technology that inspires ambitious progress. know we can create a better future by working together. partner program to empower more than 10,000 Climate Action partners in over 40 countries to advance their own That vision and ingenuity is reflected in the progress we sustainable impact journeys. are making against our Sustainable Impact goals today. Of all the challenges facing the world, none is greater And the impact on the world—and our business—is clear. than our climate crisis. And so, we set an ambitious Human Rights In fact, our Sustainable Impact initiatives helped the climate goal: By 2040, HP’s entire value chain—Scope 1, Even as we work to deepen our impact, we are focused company win more than US$3.5 billion in new sales in 2, and 3—will reach net-zero greenhouse gas emissions, on expanding the diversity of our workforce. Building a fiscal year 2021—a three-fold increase over the prior year. with a 50% reduction in absolute emissions by the end diverse and inclusive workforce is not only the right thing Simply put, when we innovate with purpose, we create of this decade. We’ve already achieved a 9% absolute to do—it also makes good business sense. Diverse teams the conditions for both business and society to thrive. reduction since 2019—but we know we must move faster. will always out-innovate and out-perform the market. Saludos, So, we’re rethinking our materials, as well as how to keep I am inspired by the progress we are making toward them in circular use, and how to reduce our footprint. We aim to double the number of Black and African becoming the world’s most sustainable and just American HP executives by 2025 and reach 50/50 technology company. And I hope our success spurs We’ve made significant progress in reducing gender equality in leadership by 2030. And while HP other businesses to join us in creating the future we plastic waste and using more recycled plastic. We is among the top technology companies for women in want to see—for our companies, our families, and have reduced single-use plastic packaging by 44% leadership positions—and nearly 45% of our U.S. hires our communities. Enrique Lores compared to 2018. And we have increased the use of in 2021 were racial/ethnic minorities—we are exploring President and CEO postconsumer recycled content plastic across our ways to improve inclusive representation at all levels. 3 2021 HP Sustainable Impact Report www.hp.com/sustainableimpact
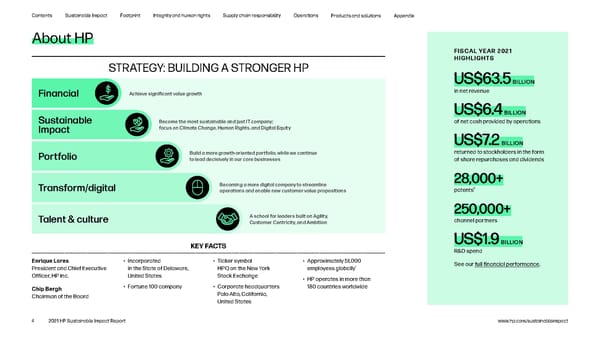
Contents Sustainable Impact Footprint Integrity and human rights Supply chain responsibility Operations Products and solutions Appendix About HP FISCAL YEAR 2021 HIGHLIGHTS STRATEGY: BUILDING A STRONGER HP US$63.5 BILLION Financial Achieve significant value growth in net revenue US$6.4 BILLION Sustainable Become the most sustainable and just IT company; of net cash provided by operations Impact focus on Climate Change, Human Rights, and Digital Equity US$7.2 BILLION Portfolio Build a more growth-oriented portfolio, while we continue returned to stockholders in the form to lead decisively in our core businesses of share repurchases and dividends Becoming a more digital company to streamline 28,000+ Transform/digital operations and enable new customer value propositions patents2 250,000+ Talent & culture A school for leaders built on Agility, channel partners Customer Centricity, and Ambition KEY FACTS US$1.9 BILLION R&D spend Enrique Lores • Incorporated • Ticker symbol • Approximately 51,000 See our full financial performance. 1 President and Chief Executive in the State of Delaware, HPQ on the New York employees globally Officer, HP Inc. United States Stock Exchange • HP operates in more than Chip Bergh • Fortune 100 company • Corporate headquarters 180 countries worldwide Chairman of the Board Palo Alto, California, United States 4 2021 HP Sustainable Impact Report www.hp.com/sustainableimpact
Contents Sustainable Impact Footprint Integrity and human rights Supply chain responsibility Operations Products and solutions Appendix Sustainable Impact 6 Sustainable Impact strategy 11 Stakeholder engagement 10 Recognition 12 ESG materiality 11 Governance 5 2021 HP Sustainable Impact Report www.hp.com/sustainableimpact

This is a modal window.
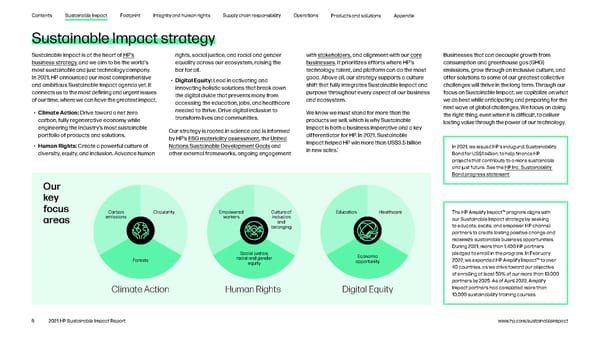
Contents Sustainable Impact Footprint Integrity and human rights Supply chain responsibility Operations Products and solutions Appendix Sustainable Impact strategy Sustainable Impact is at the heart of HP’s rights, social justice, and racial and gender with stakeholders, and alignment with our core Businesses that can decouple growth from business strategy, and we aim to be the world’s equality across our ecosystem, raising the businesses. It prioritizes efforts where HP’s consumption and greenhouse gas (GHG) most sustainable and just technology company. bar for all. technology, talent, and platform can do the most emissions, grow through an inclusive culture, and In 2021, HP announced our most comprehensive • Digital Equity: Lead in activating and good. Above all, our strategy supports a culture offer solutions to some of our greatest collective and ambitious Sustainable Impact agenda yet. It innovating holistic solutions that break down shift that fully integrates Sustainable Impact and challenges will thrive in the long term. Through our connects us to the most defining and urgent issues the digital divide that prevents many from purpose throughout every aspect of our business focus on Sustainable Impact, we capitalize on what of our time, where we can have the greatest impact. accessing the education, jobs, and healthcare and ecosystem. we do best while anticipating and preparing for the needed to thrive. Drive digital inclusion to next wave of global challenges. We focus on doing • Climate Action: Drive toward a net zero We know we must stand for more than the the right thing, even when it is difficult, to deliver carbon, fully regenerative economy while transform lives and communities. products we sell, which is why Sustainable lasting value through the power of our technology. engineering the industry’s most sustainable Our strategy is rooted in science and is informed Impact is both a business imperative and a key portfolio of products and solutions. by HP’s ESG materiality assessment, the United differentiator for HP. In 2021, Sustainable • Human Rights: Create a powerful culture of Nations Sustainable Development Goals and Impact helped HP win more than US$3.5 billion In 2021, we issued HP’s inaugural Sustainability 1 diversity, equity, and inclusion. Advance human other external frameworks, ongoing engagement in new sales. Bond for US$1 billion, to help finance HP projects that contribute to a more sustainable and just future. See the HP Inc. Sustainability Bond progress statement. Our key focus Carbon Circularity Empowered Culture of Education Healthcare The HP Amplify Impact™ program aligns with areas emissions workers inclusion our Sustainable Impact strategy by seeking and to educate, excite, and empower HP channel belonging partners to create lasting positive change and maximize sustainable business opportunities. During 2021, more than 1,400 HP partners Social justice, Economic pledged to enroll in the program. In February Forests racial and gender opportunity 2022, we expanded HP Amplify Impact™ to over equity 40 countries, as we drive toward our objective of enrolling at least 50% of our more than 10,000 partners by 2025. As of April 2022, Amplify Climate Action Human Rights Digital Equity Impact partners had completed more than 10,000 sustainability training courses. 6 2021 HP Sustainable Impact Report www.hp.com/sustainableimpact
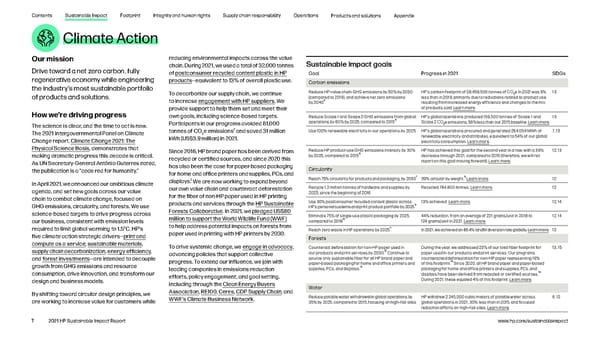
Contents Sustainable Impact Footprint Integrity and human rights Supply chain responsibility Operations Products and solutions Appendix Climate Action Our mission reducing environmental impacts across the value Sustainable Impact goals Drive toward a net zero carbon, fully chain. During 2021, we used a total of 32,000 tonnes of postconsumer recycled content plastic in HP Goal Progress in 2021 SDGs regenerative economy while engineering products—equivalent to 13% of overall plastic use. Carbon emissions the industry’s most sustainable portfolio Reduce HP value chain GHG emissions by 50% by 2030 HP’s carbon footprint of 28,459,500 tonnes of CO e in 2021 was 9% 13 To decarbonize our supply chain, we continue 2 of products and solutions. (compared to 2019), and achieve net zero emissions less than in 2019, primarily due to reductions related to product use to increase engagement with HP suppliers. We by 20404 resulting from increased energy efficiency and changes to the mix provide support to help them set and meet their of products sold. Learn more. How we’re driving progress own goals, including science-based targets. Reduce Scope 1 and Scope 2 GHG emissions from global HP’s global operations produced 159,500 tonnes of Scope 1 and 13 operations by 60% by 2025, compared to 20155 Scope 2 CO e emissions, 59% less than our 2015 baseline. Learn more. The science is clear, and the time to act is now. Participants in our programs avoided 81,000 2 tonnes of CO 2 Use 100% renewable electricity in our operations by 2025 HP’s global operations procured and generated 264,054 MWh of 7, 13 The 2021 Intergovernmental Panel on Climate 2e emissions and saved 31 million kWh (US$3.9 million) in 2021. renewable electricity and attributes, equivalent to 54% of our global Change report, Climate Change 2021: The electricity consumption. Learn more. Physical Science Basis, demonstrates that Since 2016, HP brand paper has been derived from Reduce HP product-use GHG emissions intensity by 30% HP has achieved this goal for the second year in a row, with a 39% 12, 13 making dramatic progress this decade is critical. by 2025, compared to 20156 decrease through 2021, compared to 2015 (therefore, we will not As UN Secretary-General António Guterres noted, recycled or certified sources, and since 2020 this report on this goal moving forward). Learn more. the publication is a ”code red for humanity.” has also been the case for paper-based packaging Circularity for home and office printers and supplies, PCs, and 7 8 3 Reach 75% circularity for products and packaging, by 2030 39% circular by weight. Learn more. 12 In April 2021, we announced our ambitious climate displays. We are now working to expand beyond agenda, and set new goals across our value our own value chain and counteract deforestation Recycle 1.2 million tonnes of hardware and supplies by Recycled 764,800 tonnes. Learn more. 12 for the fiber of non-HP paper used in HP printing 2025, since the beginning of 2016 chain to combat climate change, focused on Use 30% postconsumer recycled content plastic across 13% achieved. Learn more. 12, 14 GHG emissions, circularity, and forests. We use products and services through the HP Sustainable HP’s personal systems and print product portfolio by 20259 science-based targets to drive progress across Forests Collaborative. In 2021, we pledged US$80 Eliminate 75% of single-use plastic packaging by 2025, 44% reduction, from an average of 221 grams/unit in 2018 to 12, 14 million to support the World Wildlife Fund (WWF) compared to 201810 124 grams/unit in 2021. Learn more. our business, consistent with emission levels required to limit global warming to 1.5°C. HP’s to help address potential impacts on forests from Reach zero waste in HP operations by 202511 In 2021, we achieved an 86.4% landfill diversion rate globally. Learn more. 12 five climate action strategic drivers—print and paper used in printing with HP printers by 2030. Forests compute as a service, sustainable materials, To drive systemic change, we engage in advocacy, Counteract deforestation for non-HP paper used in During the year, we addressed 23% of our total fiber footprint for 13, 15 supply chain decarbonization, energy efficiency, 12 advancing policies that support collective our products and print services by 2030. Continue to paper used in our products and print services. Our programs and forest investments—are intended to decouple source only sustainable fiber for all HP brand paper and counteracted deforestation for non-HP paper representing 19% progress. To extend our influence, we join with 14 paper-based packaging for home and office printers and of this footprint. Since 2020, all HP brand paper and paper-based growth from GHG emissions and resource 13 leading companies in emissions-reduction supplies, PCs, and displays. packaging for home and office printers and supplies, PCs, and consumption, drive innovation, and transform our 15 efforts, policy engagement, and goal setting, displays have been derived from recycled or certified sources. design and business models. During 2021, these equaled 4% of this footprint. Learn more. including through the Clean Energy Buyers Water By shifting toward circular design principles, we Association, RE100, Ceres, CDP Supply Chain, and WWF’s Climate Business Network. Reduce potable water withdrawal in global operations by HP withdrew 2,245,000 cubic meters of potable water across 6, 12 are working to increase value for customers while 35% by 2025, compared to 2015, focusing on high-risk sites global operations in 2021, 30% less than in 2015, and focused reduction efforts on high-risk sites. Learn more. 7 2021 HP Sustainable Impact Report www.hp.com/sustainableimpact
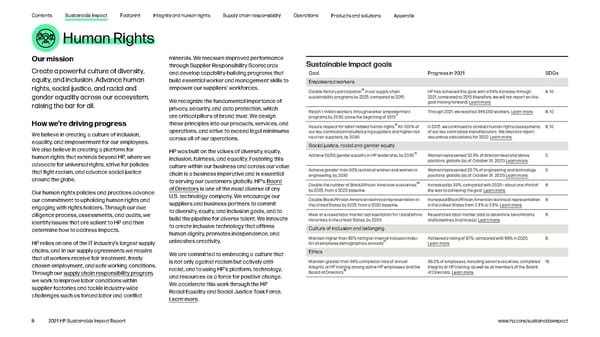
Contents Sustainable Impact Footprint Integrity and human rights Supply chain responsibility Operations Products and solutions Appendix Human Rights Our mission minerals. We measure improved performance Sustainable Impact goals Create a powerful culture of diversity, through Supplier Responsibility Scorecards and develop capability-building programs that Goal Progress in 2021 SDGs equity, and inclusion. Advance human build essential worker and management skills to Empowered workers rights, social justice, and racial and empower our suppliers’ workforces. 16 8, 10 Double factory participation in our supply chain HP has achieved this goal, with a 114% increase through gender equality across our ecosystem, We recognize the fundamental importance of sustainability programs by 2025, compared to 2015 2021, compared to 2015 (therefore, we will not report on this raising the bar for all. goal moving forward). Learn more. privacy, security, and data protection, which Reach 1 million workers through worker empowerment Through 2021, we reached 349,000 workers. Learn more. 8, 10 are critical pillars of brand trust. We design programs by 2030, since the beginning of 201517 How we’re driving progress these principles into our products, services, and 18 8, 10 operations, and strive to exceed legal minimums Assure respect for labor-related human rights for 100% of In 2021, we continued to conduct human rights assessments We believe in creating a culture of inclusion, our key contracted manufacturing suppliers and higher-risk of our key contracted manufacturers. We intend to report across all of our operations. next-tier suppliers, by 2030 assurance calculations for 2022. Learn more. equality, and empowerment for our employees. Social justice, racial and gender equity We also believe in creating a platform for HP was built on the values of diversity, equity, human rights that extends beyond HP, where we Achieve 50/50 gender equality in HP leadership, by 203019 Women represented 32.5% of director-level and above 5 inclusion, fairness, and equality. Fostering this positions globally (as of October 31, 2021). Learn more. advocate for universal rights, strive for policies culture within our business and across our value that fight racism, and advance social justice chain is a business imperative and is essential Achieve greater than 30% technical women and women in Women represented 22.7% of engineering and technology 5 around the globe. engineering, by 2030 positions globally (as of October 31, 2021). Learn more. to serving our customers globally. HP’s Board 20 of Directors is one of the most diverse of any Double the number of Black/African American executives Increased by 33%, compared with 2020—about one-third of 8 Our human rights policies and practices advance by 2025, from a 2020 baseline the way to achieving the goal. Learn more. our commitment to upholding human rights and U.S. technology company. We encourage our Double Black/African American technical representation in Increased Black/African American technical representation 8 engaging with rights holders. Through our due suppliers and business partners to commit the United States by 2025, from a 2020 baseline in the United States from 2.3% to 2.6%. Learn more. diligence process, assessments, and audits, we to diversity, equity, and inclusion goals, and to Meet or exceed labor market representation for racial/ethnic Researched labor market data to determine benchmarks 8 identify issues that are salient to HP and then build the pipeline for diverse talent. We innovate minorities in the United States, by 2030 and baselines (in process). Learn more. determine how to address impacts. to create inclusive technology that affirms Culture of inclusion and belonging human dignity, promotes independence, and Maintain higher than 90% rating on internal inclusion index Achieved a rating of 87%, compared with 89% in 2020. 8 unleashes creativity. 21 HP relies on one of the IT industry’s largest supply for all employee demographics annually Learn more. chains, and in our supply agreements we require We are committed to embracing a culture that Ethics that all workers receive fair treatment, freely is not only against racism but actively anti- Maintain greater than 99% completion rate of annual 99.2% of employees, including senior executives, completed 16 chosen employment, and safe working conditions. Integrity at HP training among active HP employees and the Integrity at HP training, as well as all members of the Board racist, and to using HP’s platform, technology, Board of Directors22 of Directors. Learn more. Through our supply chain responsibility program, and resources as a force for positive change. we work to improve labor conditions within We accelerate this work through the HP supplier factories and tackle industry-wide Racial Equality and Social Justice Task Force. challenges such as forced labor and conflict Learn more. 8 2021 HP Sustainable Impact Report www.hp.com/sustainableimpact
Contents Sustainable Impact Footprint Integrity and human rights Supply chain responsibility Operations Products and solutions Appendix Digital Equity Our mission we aspire to help pave the way toward a more Sustainable Impact goals Lead in activating and innovating holistic equitable world where women and girls, people with disabilities and aging populations, historically Goal Progress in 2021 SDGs solutions that break down the digital excluded and marginalized communities, and Digital Equity divide that prevents many from accessing educators and healthcare practitioners have 23 access to the technology and resources they Accelerate digital equity for 150 million people by 2030, Accelerated digital equity for 4.3 million people. Learn more. 4, 5, 8 the education, jobs, and healthcare since the beginning of 2021 needed to thrive. Drive digital inclusion need to ensure their voices are heard. Enroll 1.5 million HP LIFE users between 2016 and 2030 Enrolled 533,000 since 2016. Learn more. 4, 5, 8 to transform lives and communities. We plan to achieve this through impactful Learning outcomes programs, strategic investments, and partnerships. Enable better learning outcomes24 for 100 million people 74.3 million students and adult learners have benefited 4, 5, 8 How we’re driving progress For example, we are supporting nonprofit NABU’s by 2025, since the beginning of 2015 from HP’s education programs and solutions that advance work to improve childhood literacy in marginalized quality learning and digital literacy, and enable better Nearly half of the world’s population remains learning outcomes, since the beginning of 2015 (including communities through books in children’s native 24 million in 2021). Learn more. unconnected to the internet and locked out of languages. We continue enhancing the HP Community opportunity, including vital access to education, Foundation’s free HP LIFE program to make healthcare, and economic opportunity. Contribute US$100 million in HP Foundation and employee Reached US$73.4 million in HP Foundation and employee 11, 17 entrepreneurial skill building more accessible to all. community giving25 community giving. Learn more. by 2025 (cumulative since the beginning In 2021, HP set a goal to accelerate digital equity of 2016) Along with our strategic partners, our employees Contribute 1.5 million employee volunteering hours by 2025 Reached 692,000 employee volunteering hours. 11, 17 for 150 million people by 2030. Through the Digital contribute their time, resources, and skills to (cumulative since the beginning of 2016) Learn more. Equity Accelerator (launched in early 2022), provide important support to local communities. HP’S RESPONSE TO COVID-19 The COVID-19 pandemic has challenged businesses large and small, local experts and public health leaders, and regularly review and update them donating PCs, printers, and displays. In support of our goal to accelerate and national governments, families, and individuals in ways few of us could to reflect the best, most current information available. digital equity, we provided technology and other support to underserved have imagined. students and families through Parents Supporting Parents. Learn more As conditions allow, we are moving into our next phase of return to office about HP’s community giving and volunteerism. The wellbeing of our employees and their families has remained a top planning and are beginning to fully reopen HP offices on a site-by-site priority. With many of our employees working from home, we have basis in line with local health and safety regulations. US$389,000 167,000+ initiatives that promote physical and mental health and work/life balance, including through HP Spirit and Well Beyond. At our sites, we’ve put in In 2021, HP and the HP Foundation continued to support impacted in HP Foundation grants related COVID-19 vaccinations given place global policies and protocols based on guidance from healthcare communities around the world, contributing financial resources and to COVID-19 through HP’s CSR India team 9 2021 HP Sustainable Impact Report www.hp.com/sustainableimpact
Contents Sustainable Impact Footprint Integrity and human rights Supply chain responsibility Operations Products and solutions Appendix Recognition HP is recognized as one of the world’s most sustainable companies. Named for the seventh One of the 2022 World’s Only technology company Honored for commitment year in a row to this list of Most Ethical Companies— globally to receive a triple “A” to and momentum toward the 100 Most Sustainable named to this list for the rating across CDP’s Climate, creating sustainable markets Corporations in the World third year in a row Water, and Forests lists and Supplier Engagement Leaderboard (for the 3rd year in a row) Named #1 on Newsweek’s Listed on the Dow Jones Placed second among 100% score on the list for the third year in a row Sustainability World Index technology companies and Disability Equality Index for the 10th time in a row fourth overall for the sixth year in a row Rated among the top Ranked seventh out of Recognized for efforts Named a Top 50 Employer by companies for corporate 150 ICT companies on to advance diversity and Woman Engineer Magazine social responsibility for digital inclusion in 2021 inclusion for the sixth year the 12th time in a row in a row Ranked second on the 2020 Recognized for ongoing Received SmartWay Awarded Outstanding benchmark of ICT companies commitment to product Excellence Award for the Leadership in Sustainable committed to addressing energy efficiency for the 10th time overall (eighth Finance in 2021 human rights issues within fifth year in a row (third for year in a row) their supply chains Sustained Excellence) Ranked among the top three Placed in the top 10 for Received a 100% score on Named to JUST Capital’s list ICT companies on the clean energy for the fourth the Corporate Equality Index for the fourth year in a row 2020 Corporate Human year in a row for LGBTQ+ Equality for the Rights Benchmark 19th year Received award for efforts to address the challenge of ocean-bound plastics 10 2021 HP Sustainable Impact Report www.hp.com/sustainableimpact
Contents Sustainable Impact Footprint Integrity and human rights Supply chain responsibility Operations Products and solutions Appendix Governance Stakeholder engagement We integrate Sustainable Impact at all levels of of our board have experience in environmental We gain valuable insight through regular Examples of stakeholder engagement in 2021: the company. and social responsibility-related issues and engagement with a range of stakeholders, topics, which we believe strengthens the board’s including employees, investors, suppliers, • Decarbonization: We engage in initiatives Our executive leadership team, led by our CEO, oversight of HP’s policies and programs relating customers, peer companies, public policymakers, focused on increasing support for clean energy retains overall responsibility for Sustainable to these issues and reinforces HP’s commitment industry bodies, nongovernmental organizations and combating climate change, including Impact as part of our business strategy. All to sustainability and social responsibility. (NGOs), sector experts, and others. These RE100, CDP Supply Chain, WWF’s Climate members of the executive leadership team interactions build our collective intelligence, help Business Network, Business Ambition for oversee Sustainable Impact targets relevant to The performance and compensation of our Chief us prioritize critical issues, and provide insights 1.5°C, and Ceres. See Footprint, Supply chain their organizations, and are evaluated annually Impact Officer, our Chief Sustainability Officer, into emerging opportunities and risks. responsibility: Environmental impact, Our against objectives related to Sustainable Impact, and our Chief Diversity Officer are related to facilities, and Circular and net zero carbon including climate change and diversity, equity, and the management of HP Sustainable Impact and Our environmental, social, and governance economy: Energy efficiency. inclusion. Performance against these and other the achievement of related targets and metrics, (ESG) materiality assessment process is deeply • Circular economy: We are working with business objectives is tied to total compensation. both public and internal. Several other HP VPs, informed by stakeholder engagement. In 2021, partner organizations and suppliers to gain the directors, and managers have a component of interviews with a wide range of internal and most value from materials and to keep them The HP Board of Directors’ Nominating, total compensation (salary and bonus) based on external stakeholders and the results of an Governance and Social Responsibility (NGSR) responsibility for, and effective implementation external survey contributed to the analysis. in use, contributing to a circular economy. For Committee oversees the company’s policies and of, corporate initiatives to address climate action, Learn more. example, with the Ellen MacArthur Foundation programs relating to global citizenship and the human rights, and digital equity. Beginning in 2021, Circular Economy 100, we are driving progress impact of HP’s operations; provides guidance every HP employee is encouraged and supported Individual functions across the company drive toward a more circular materials- and energy- and recommendations to the board on legal, to set a Sustainable Impact goal as part of our decentralized approach, engaging in ways efficient future. We engage through the HP regulatory, and compliance matters relating to their individual annual goal-setting process. that are most relevant to their objectives Sustainable Forests Collaborative to protect, political, environmental, global citizenship, and Learn more. and operations. These include partnerships, restore, and improve responsible management public policy trends; and reviews the annual sponsorships, collaboration on industry of forests, and work with WWF’s Forests Sustainable Impact Report. The Committee The Sustainable Impact Steering Committee, initiatives, customer and supplier education, Forward, the Forest Stewardship Council®, receives regular updates on Sustainable Impact composed of representatives from across HP’s supplier capability-building programs, and our suppliers to ensure the fiber we use is strategy, metrics, results, and key risks and business units and global functions, provides supplier audits and assessments, conference responsibly sourced. See Renewable materials. opportunities. The NGSR Committee provides additional oversight and helps manage progress participation, employee surveys, mentoring, • Human rights—supply chain: We engage in guidance, and in some cases approval, on against our goals. and more. Appropriate stakeholders are multi-stakeholder collaborations, including the strategic priorities and investments. As disclosed identified based on factors such as expertise, Responsible Business Alliance, Leadership in our 2022 proxy statement, several members willingness to collaborate, reputation, location, Group for Responsible Recruitment, and Global sphere of influence, and ability to scale and Business Initiative for Business and Human accelerate progress. Rights, to drive progress and elevate supply 11 2021 HP Sustainable Impact Report www.hp.com/sustainableimpact
Contents Sustainable Impact Footprint Integrity and human rights Supply chain responsibility Operations Products and solutions Appendix chain best practices. See Human rights and ESG materiality Supply chain responsibility. • Digital divide: We partner with UN Women and We periodically conduct ESG materiality Based on these inputs, we evaluated and ranked Girl Rising to advance education for women assessments to review relevant ESG topics, Approach topics, then validated the results in a workshop and girls, and we work with MIT Solve and NABU reconfirm our long-standing areas of focus, and with HP executives and experts. Our new 2021 to advance digital literacy in communities clarify and shape our Sustainable Impact In 2021, we engaged the sustainability consultancy ESG materiality matrix summarizes the outcome around the world. See Education. strategy, investments, and disclosures. This Environmental Resources Management (ERM) of this process. process enables us to focus our efforts on the to conduct an ESG materiality assessment. Many other examples of HP’s stakeholder areas where we can have the greatest impact, Through interviews, surveys, and other sources, engagement are included throughout this report. determine gaps in our approach, and identify we collected internal and external input on a Key findings trends and leadership opportunities for our wide range of topics to determine their relative business. ESG materiality assessment informs importance to HP and to external stakeholders, By integrating a broad range of inputs and fresh our goals-setting process, and we have set and to understand the degree of impact we insights, our new ESG materiality assessment 1 aggressive goals related to several of our most can have on each topic area. Prior to this, our reflects the rapidly evolving landscape of ESG ESG-material topics to manage performance and most recent ESG materiality assessment was topics. In some cases, we combined topics or drive long-term progress. conducted in 2019. refined names or definitions to better reflect topic We collected input from a broad range of scope or content, and digital divide emerged as a stakeholders—including HP employees and new topic during the assessment. Throughout this report, we use the definition executives, customers, suppliers, investors, In addition to determining HP’s ESG material of “materiality” from the GRI (Global Reporting NGOs, and peer companies—to reflect a diverse topics, several key themes emerged: Initiative) Standards, which is different from range of views. To better understand HP’s the term as it has been defined by or construed impacts and potential impacts related to each • It is critical to take aggressive near-term action in accordance with the securities laws or any topic, the process incorporated the Future Fit on decarbonization, including by engaging other laws of the United States or any other Benchmark Technology Sector Impact Areas and suppliers to reduce climate impact throughout jurisdiction, or as used in the context of our Sustainable Development Goals Sector Survey. HP’s value chain. financial statements and financial reporting, The assessment also took into account leading • Stakeholders increasingly expect transparent or our reports filed with the U.S. Securities and reporting frameworks such as the GRI Standards reporting on carbon footprint and related Exchange Commission. Topics identified as ESG for sustainability reporting and the Sustainability impacts, risks, and opportunities, as well as material for the purpose of this report should Accounting Standards Board (SASB) Technology robust social impact data and metrics across not be construed as being material for SEC or & Communications Hardware Standard. the value chain. other financial reporting purposes. 12 2021 HP Sustainable Impact Report www.hp.com/sustainableimpact
Contents Sustainable Impact Footprint Integrity and human rights Supply chain responsibility Operations Products and solutions Appendix • HP has the potential to expand social and environmental value HP 2021 ESG materiality matrix creation beyond the value chain, including by advocating for policy related to Climate Action, Human Rights, and Digital Equity. Areas of focus • HP has an opportunity to lead our industry toward a more circular Climate Action economy through closed-loop manufacturing, service-based 3D HIGH Decarbonization Circular printing, and robust reuse, repair, and recycling programs. Human rights: supply chain economy Human Rights • Human rights remain a key focus for customers, policymakers, Digital Equity and investors. Companies are expected to address related risks Climate change Governance resilience and opportunities across their value chains, including through Public policy cross-industry collaboration with suppliers and business partners. engagement Human rights: s operations and Degree of impact HP • The digital divide is growing, and HP has an opportunity to downstream can have on topics collaborate with civil society, governments, and others to eholder Digital accelerate digital equity, particularly in the areas of work, ak Human capital divide High education, and healthcare. t Diversity, equity, Medium ernal s Data and and inclusion Low t ESG materiality matrix x product e Community Packaging security o Corporate Paper and forests t Our 2021 ESG materiality matrix maps topics by relative importance investment and governance involvement Transparency to HP’s business success and to external stakeholders, while also ance Product and t Ethics and and reporting summarizing the company’s impact in each area. Topics above the operational health anti-corruption diagonal are considered ESG material for the purpose of this report. impor and safety Privacy Items below the ESG materiality threshold are not covered in as e Biodiversity Water Product energy efficiency much detail, but remain important to HP. elativ R Our ESG material topics list includes definitions, corresponding Future of work GRI Standards Topics, and boundaries for each topic. W LO Relative importance to HP 13 2021 HP Sustainable Impact Report www.hp.com/sustainableimpact
Contents Sustainable Impact Footprint Integrity and human rights Supply chain responsibility Operations Products and solutions Appendix Footprint 15 Carbon and climate impact 16 Water 17 Data 14 2021 HP Sustainable Impact Report www.hp.com/sustainableimpact

This is a modal window.
Contents Sustainable Impact Footprint Integrity and human rights Supply chain responsibility Operations Products and solutions Appendix The manufacturing, delivery, and use of HP Carbon and climate impact products and solutions requires a substantial amount of natural resources and energy use. Our carbon and water footprints cover our We strive to reduce the climate impact of our to product transportation. This reduction was While GHG emissions from our operations only 1 supply chain, operations, and products and driven in part by the increased energy efficiency represent 1% of our footprint, we work to entire global value chain, from suppliers to our operations and millions of customers worldwide. solutions. HP’s carbon footprint in 2021 equaled of our products as well as the continued impact demonstrate leadership in emissions management, We were the first global IT company to publish 28,459,500 tonnes of carbon dioxide equivalent of COVID-19 on sales of different product lines, reduction, and disclosure. Our global operations a full carbon footprint, and one of the first to (CO2e), 3% less than in 2020. An 11% decrease particularly a shift toward Chromebooks, other produced 159,500 tonnes of Scope 1 and Scope 2 disclose a complete water footprint. We continue in GHG emissions associated with product notebooks, and inkjet printers, which tend to be COe emissions during 2021, a 7% decrease 2 to measure and manage our environmental use more than offset a 3% increase related to lighter and are more energy efficient than desktop compared to 2020. footprint across the value chain, always pursuing product manufacturing and a 13% rise related PCs and LaserJet printers. areas for improvement. Transforming HP to help drive a more efficient, circular, and net zero carbon economy is central 2030 AND 2040 GOALS METHODOLOGICAL UPDATES to our Sustainable Impact strategy. Reduce HP value chain GHG emissions by This report reflects several methodological updates to improve the accuracy of our carbon HP has achieved triple “A” scores for transparency 50% by 2030 (compared to 2019), and achieve footprint calculations and to align with our 2030 GHG emissions-reduction goal. These include: and action on climate, forests, and water for net zero emissions by 20401 several consecutive years, and has also been • Personal systems: Using a new life cycle assessment (LCA) tool, which allows for updated and recognized as a CDP Supplier Engagement PROGRESS IN 2021 refined modeling based on HP-specific parameters, to calculate GHG emissions associated Leader. See Recognition. HP’s carbon footprint of 28,459,500 tonnes of with personal systems. COe in 2021 was 2 • Paper: Using the tonnage of HP brand paper sold during the year to calculate associated GHG emissions, and not including GHG emissions associated with non-HP brand paper used in HP 9% printers. These emissions are now included in Scope 3 category 1 instead of category 11. This aligns with guidance regarding indirect use-phase GHG emissions associated with product use less than in 2019, primarily due to reductions from the GHG Protocol and the Science Based Targets initiative (SBTi). related to product use resulting from increased • Nonproduction suppliers: Adding GHG emissions associated with nonproduction suppliers, energy efficiency and changes to the mix of based on data provided by those suppliers. Learn more. products sold. See additional GHG emissions-reduction goals. Based on our updated methodology, we have restated GHG emissions data for 2019 and 2020, for comparability. These methodological updates impact Scope 3 categories 1, 4, 9, 11, and 12. 15 2021 HP Sustainable Impact Report www.hp.com/sustainableimpact
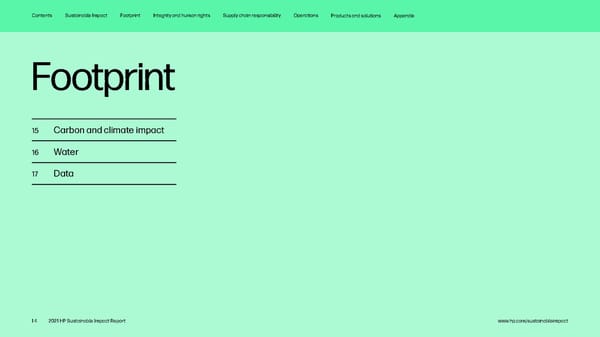
Contents Sustainable Impact Footprint Integrity and human rights Supply chain responsibility Operations Products and solutions Appendix HP carbon footprint, 2021 Water 28,459,500 tonnes CO2e Many parts of the world grapple with the availability and quality of water, and HP calculates, discloses, 18,300,000* and works to reduce water use across our global ƒonproduction suppliers value chain. 10,000 In 2021, our water footprint equalled 146,756,000 1 ** cubic meters, 8% less than in 2020. This Print ,910,000 resulted primarily from a reduction in indirect Personal systems water consumption from electricity generation 13,00,000 associated with HP product use, which more than 8,€00,000 offset water consumption in HP’s supply chain. Print Although water withdrawal in operations only 1,‚00,000 represents 2% of our footprint, we have direct Print Personal systems 00,000 €,00,000 control over those activities. We work to minimize Personal systems water withdrawal within our facilities and €00,000 demonstrate strong practice for others in the 900,000 industry and beyond. 100,000 100,000 139,00 0,100 0*** 100,000 100,000 0 0 Materials Capital Upstream Product Facilities ransportation usiness mployee Product Product uildings nestments See also: extraction goods energy transportation fleet trael commuting energy use end of leased through production serice to others • Description of our methodology in the manufacturing HP Water accounting manual. Supply chain (68%) Operations (1%) Products and solutions (31%) • Full water footprint data for 2019–2021. * Segments do not add up to total due to rounding. • Water-use reduction initiatives across our ** Includes HP brand printer and copier paper sold, which represented 0.5% of our carbon footprint. business: Supply chain, Our facilities, and *** This value is zero due to rounding. Products and solutions. See also: • Full carbon footprint data for 2019–2021. disclosures throughout this report, the HP 2022 • HP CDP Water Security response. • GHG emissions-reduction initiatives across Proxy Statement, and our CDP submissions). • Description of our methodology in the HP our business: Supply chain, Our facilities, and Carbon accounting manual. • HP CDP Climate Change response. Products and solutions. See data table for specific Scope 1, 2, and 3 • Full list of our GHG emissions-reduction goals category GHG emissions reporting. and progress. • Task Force on Climate-Related Financial Disclosures index (includes links to detailed 16 2021 HP Sustainable Impact Report www.hp.com/sustainableimpact
Contents Sustainable Impact Footprint Integrity and human rights Supply chain responsibility Operations Products and solutions Appendix Data Carbon footprint (Scopes 1–3)* 2019 2020 2021 2019 2020 2021 GHG emissions from operations** Refrigerants (hydrofluorocarbons (HFCs))††, ††† 1,100 2,100 1,900 [tonnes CO2e] 215,800 171,000 159,500 Americas 49,600 41,000 39,000 Americas 100 100 0 Europe, Middle East, and Africa 57,900 48,100 47,300 Europe, Middle East, and Africa 1,000 2,000 1,900 Asia Pacific and Japan 108,300 81,900 73,200 Asia Pacific and Japan 0 0 0 *** Perfluorocarbons (PFCs)††† 3,500 2,800 3,700 GHG emissions intensity [tonnes CO e/US$ million of net revenue] 3.7 3.0 2.5 2 GHG emissions by scope [tonnes CO e] Americas 3,500 2,800 3,700 2 Europe, Middle East, and Africa 0 0 0 Scope 1 Asia Pacific and Japan 0 0 0 Scope 1 emissions, by region 61,900 50,600 48,700 Carbon dioxide (CO )††† 57,100 45,700 43,100 Americas 47,100 39,400 38,800 2 Nitrous oxide (N O)††† 200 0 0 Europe, Middle East, and Africa 13,400 10,600 9,200 2 Methane (CH )††† 100 0 0 Asia Pacific and Japan 1,400 600 700 4 Scope 2 (market-based method)†††† Scope 1 emissions, by type Scope 2 emissions, by region 153,900 120,400 110,800 Natural gas 23,800 21,400 22,700 Americas 2,500 1,600 200 Americas 20,500 19,300 20,700 Europe, Middle East, and Africa 44,500 37,500 38,100 Europe, Middle East, and Africa 2,200 1,800 1,700 Asia Pacific and Japan 106,900 81,300 72,500 Asia Pacific and Japan 1,100 300 300 Scope 2 emissions, by type 153,900 120,400 110,800 Diesel/gas/oil/LPG**** 200 300 300 Purchased electricity for operations 152,900 119,600 110,100 Americas 200 200 100 Americas 2,500 1,600 200 Europe, Middle East, and Africa 0 0 0 Europe, Middle East, and Africa 44,500 37,500 38,100 Asia Pacific and Japan 0 100 200 Asia Pacific and Japan 105,900 80,500 71,800 Transportation fleet† 33,300 24,000 20,100 District cooling and heating (purchased) for operations 1,000 800 700 Americas 22,800 17,000 14,300 Americas 0 0 0 Europe, Middle East, and Africa 10,200 6,800 5,600 Europe, Middle East, and Africa 0 0 0 Asia Pacific and Japan 300 200 200 Asia Pacific and Japan 1,000 800 700 17 2021 HP Sustainable Impact Report www.hp.com/sustainableimpact
Contents Sustainable Impact Footprint Integrity and human rights Supply chain responsibility Operations Products and solutions Appendix 2019 2020 2021 2019 2020 2021 Scope 2 (location-based method) Franchises (category 14) N/A N/A N/A Scope 2 emissions, by region 226,400 203,600 198,200 Investments (category 15) De minimis De minimis De minimis Americas 67,100 60,700 55,600 * To calculate Scope 1, Scope 2, and Scope 3 emissions, HP has followed the principles outlined in the Greenhouse Gas Protocol. Europe, Middle East, and Africa 48,300 44,900 44,700 Additional details on calculations and methodology can be found in the HP Carbon accounting manual. Scope 1 GHG emissions include CO, CH , N O, HFCs, and PFCs. No biogenic emissions are present in this category. Scope 2 GHG emissions include CO , CH , and N O. 2 4 2 2 4 2 Asia Pacific and Japan 111,000 98,000 97,900 No biogenic emissions are present in this category. Scope 3 GHG emissions: • Materials extraction through manufacturing (category 1), Transportation (categories 4 and 9), Product use (category 11), and Product Scope 2 emissions, by type 226,400 203,600 198,200 end of service (category 12) include CO , CH , N O, HFCs, PFCs, SF , and NF , and represented approximately 99% of our Scope 3 2 4 2 6 3 emissions in 2021. Biogenic emissions are present and captured in the paper emissions factor of HP paper manufactured (category 1). Purchased electricity for operations 225,400 202,800 197,500 • Capital goods (category 2) includes CO , CH , N Oand HFCs, and represented 0.35% of our Scope 3 emissions in 2021. 2 4 2 • Upstream energy production (category 3), Waste generated in operations (category 5), and Business travel (category 6) includes CO , Americas 67,100 60,700 55,600 CH andN O, and represented 0.35% of our Scope 3 emissions in 2021. 2 4 2 Europe, Middle East, and Africa 48,300 44,900 44,700 • Employee commuting (category 7), Buildings leased to others (category 13), and Investments (category 15) include CO2, and Asia Pacific and Japan 110,000 97,200 97,200 represented 0.35% of our Scope 3 emissions in 2021. • Upstream leased assets (category 8), processing of sold products (category 10), and franchises (category 14) are not applicable to HP. ** District cooling and heating (purchased steam) for operations 1,000 800 700 Total includes HP’s reported values for Scope 1 and Scope 2 market-based method emissions in table. *** Emissions-intensity values were calculated using HP’s annual revenue as characterized in financial reporting and Scope 1 and Scope 2 Americas 0 0 0 GHG emissions. Europe, Middle East, and Africa 0 0 0 **** HP does not estimate or extrapolate diesel use for nonreporting sites. † CO e emissions associated with CH and N O account for less than 1% of total CO e emissions in this category, Asia Pacific and Japan 1,000 800 700 2 4 2 2 †† HP collects all refrigerant consumption data from local facility maintenance teams company-wide, directly accounting for facilities’ ^ refrigerant leakage and use and avoiding the need for extrapolation. We use various tools and sources for global warming potential and Scope 3 [tonnes CO e] 31,170,000 29,020,000 28,300,000 2 ozone depletion values, including the Greenhouse Gas Protocol’s GHG Emissions from Refrigeration and Air Conditioning tool, IPCC Materials extraction through manufacturing (category 1; 18,300,000 17,900,000 18,300,000 Second Assessment Report (1995). ††† The total for 2019 of refrigerants, PFCs, CO , N O, and CH varies by less than 1% from Scope 1 emissions, by region, due to rounding. also see Greenhouse gas emissions on page 36) 2 2 4 †††† Data in this section uses the market-based method. Due to the availability and feasibility of acquiring the data, the company only Capital goods (category 2) 300,000 100,000 100,000 obtained utility-specific emission factors for its sites in Glasgow, Scotland; León and Madrid, Spain; and Palo Alto and San Bernardino, California; Boise, Idaho; Indianapolis, Indiana; Albuquerque, New Mexico; and Socorro, Texas, in the United States. Upstream energy production (category 3)^^ 100,000 100,000 100,000 ^ See Methodological updates on page 15. ^^^ ^^ Transportation (categories 4 and 9; also see Product transportation on page 37) 800,000 800,000 900,000 Scope 2 GHG emissions used to calculate this category were determined using the location-based method. ^^^ This product transportation data is based on LCA-based estimates. It uses a combination of HP-specific and industry data, and includes Waste generated in operations (category 5) De minimis^^^^ De minimis De minimis additional upstream and downstream transportation related to our products. This data may differ from data reported by product Business travel (category 6)‡ 70,000 20,000 De minimis transportation suppliers that HP contracts to deliver our products, as presented on pages 37 and 44. ^^^^De minimis values are less than 0.25% of total Scope 3 emissions. ‡ Employee commuting (category 7) 200,000 200,000 100,000 HP’s global travel agency provides values that take into account the type of aircraft, passenger load, cabin class, and miles traveled for each ticketed trip. This data also includes rail travel carriers and distance traveled. Although these values fall below our quantitative Upstream leased assets (category 8)‡‡ N/A N/A N/A reporting threshold of 0.25% of total Scope 3 emissions and could be reported as de minimis, we choose to report this category due to Processing of sold products (category 10) N/A N/A N/A our ability to directly track this data, our level of influence over these emissions, and stakeholder expectations in this category. ‡‡ All facilities are accounted for in Scope 1 and 2. Leased furniture and equipment are included in Capital goods (category 2). ‡‡‡ ‡‡‡ Product energy use (category 11) 11,300,000 9,800,000 8,700,000 Scope 3 emissions from inkjet and LaserJet printers that HP manufactures for sale and service by other original equipment manufacturers are excluded from our carbon footprint. In 2021, these printers represented less than 5.3% of HP printers manufactured Product end of service (category 12) 100,000 100,000 100,000 in the reporting year, and consequently, their associated emissions represented less than 6.5% of the product life cycle emissions of all Buildings leased to others (category 13) De minimis De minimis De minimis HP-manufactured printers. Scope 1 and 2 emissions from the manufacturing of these printers at HP-operated facilities is captured in the Scope 1 and 2 data reported in this year’s report. 18 2021 HP Sustainable Impact Report www.hp.com/sustainableimpact
Contents Sustainable Impact Footprint Integrity and human rights Supply chain responsibility Operations Products and solutions Appendix Water footprint* 2019 2020 2021 Water consumption in HP supply chain—direct use in operations** [cubic meters] 19,700,000 18,500,000 20,200,000 Water consumption in HP supply chain associated with the generation of electricity 40,000,000 38,400,000 43,000,000 [cubic meters] Water withdrawal in HP operations [cubic meters] 2,930,000 2,597,000 2,556,000 Water withdrawal associated with the generation of electricity used in HP operations 2,300,000 2,100,000 2,100,000 [cubic meters] Water consumption associated with the generation of electricity used by HP 103,600,000 97,600,000 78,900,000 *** products [cubic meters] * Methodological updates to improve the accuracy of our carbon footprint calculations also impacted calculations in the following water footprint categories: water consumption in HP supply chain—direct use in operations, water consumption in HP supply chain associated with the generation of electricity, and water consumption associated with the generation of electricity used by HP products. Please see Methodological updates on page 15 for more detail. Some data for 2019 and 2020 are restated as a result. Additional details on calculations and methodology can be found in the HP Water accounting manual. ** This metric reports the amount of water consumed by HP’s multi-tier supply chain, and not the amount withdrawn by first-tier suppliers as reported on page 38. Because water withdrawn can also be returned, water consumption is inherently lower. *** Indirect water consumption from inkjet and LaserJet printers that HP manufactures for sale and service by other original equipment manufacturers is excluded from our water footprint. In 2021, these printers represented less than 5.3% of HP printers manufactured in the reporting year, and consequently, their associated indirect water consumption during product use represented less than 6.6% of the product life cycle water consumption of all HP-manufactured printers. Water consumption from the manufacturing of these printers at HP-operated facilities is captured in the direct water consumption data reported in this year’s report. 19 2021 HP Sustainable Impact Report www.hp.com/sustainableimpact
Contents Sustainable Impact Footprint Integrity and human rights Supply chain responsibility Operations Products and solutions Appendix Integrity and human rights 21 Ethics and anti-corruption 25 Privacy 23 Human rights 27 Public policy 20 2021 HP Sustainable Impact Report www.hp.com/sustainableimpact
Contents Sustainable Impact Footprint Integrity and human rights Supply chain responsibility Operations Products and solutions Appendix Ethics and anti-corruption We expect everyone at HP to meet the highest aware of their responsibilities in reinforcing HP’s Ethics and compliance governance at HP ethical standards and to treat others with integrity, commitment to ethical behavior. During 2021, all respect, and fairness. A strong commitment to members of HP’s Board of Directors received our values underpins our efforts, reinforced by Integrity at HP content relevant to their positions, in-depth training and communication, and upheld and certified that they had read it. Board of Directors through targeted policies and strong governance. The Board of Directors is responsible for overseeing ethics and compliance at HP. Chip Bergh is the Chairman. Conducting business with integrity is central Regular training, newsletters, and virtual coffee All members are independent directors, excluding Enrique Lores, president and chief executive officer, HP Inc. to HP’s culture. In 2022, our commitment was talks help to reinforce the values and content recognized for the third consecutive year when outlined in Integrity at HP. Employees can also HP was named one of the World’s Most Ethical access Integrity Central, a comprehensive library Board of Directors Audit Committee Ethics and Compliance Committee Companies® by Ethisphere. of ready-to-use material on key ethics topics, with Provides non-executive input and guidance Composed of HP executives and provides oversight toolkits, posters, infographics, training materials, to the Ethics and Compliance Office. and guidance on the design and implementation of HP is committed to complying with all applicable and scenarios. In 2021, the Ethics Office continued our ethics and compliance program. laws and regulations everywhere we operate. We to expand the content available in Integrity also require ethical conduct by our suppliers and Central, growing the library of translated training Ethics and Compliance Office partners and use our scale and influence to drive courses, videos, posters, and infographics. (within Global Legal Affairs) progress across the broader IT industry. See Manages ethical issues across our global operations. Specific responsibilities include oversight of Integrity Human rights and Supply chain responsibility. at HP, coordination of the company’s Compliance Assessment Program, management of anti-corruption ONGOING GOAL and privacy, and the design and management of processes that prevent, mitigate, and remediate all related Ethics business impacts. Maintain greater than 99% completion rate of annual Integrity at HP training among active HP Training and communication employees and the Board of Directors See governance information online, including the in-country 24-hour toll-free phone lines with PROGRESS IN 2021 board’s composition, committees, and charters, translation, text messaging (in the United States), The annual training on Integrity at HP—our as well as our company bylaws and Corporate mail, and in person. We offer anonymous employee code of conduct—covers key policies, Governance Guidelines. reporting options where allowed by law. At any procedures, and high-risk issues that employees time, employees can also reach out to their might face, and incorporates scenarios based 99.2% Reporting concerns manager or another leader under HP’s Open Door on actual investigations. Each year, HP requires of employees, including senior executives, Policy, seek advice from internal ethics and all employees to complete this training, including completed Integrity at HP training, as well as all We make it easy for our employees and third compliance experts, or consult Internal Audit, content on anti-corruption, conflicts of interest, members of the Board of Directors1 parties to ask questions and report ethics Human Resources, local Integrity at HP teams, or accurate business records, and anti-retaliation. concerns about the broad range of ESG issues. Integrity at HP liaisons. HP does not tolerate Additionally, the training includes manager- Reporting avenues are available to 100% of retaliation against anyone who raises a concern specific content to ensure that managers are employees and include an online form, global or question. 21 2021 HP Sustainable Impact Report www.hp.com/sustainableimpact
Contents Sustainable Impact Footprint Integrity and human rights Supply chain responsibility Operations Products and solutions Appendix Items reported to global Integrity When appropriate, representatives from our Risk assessment and audits Third-party management Legal, Controllership, and Human Resources HP conducts regular internal assessments of and due diligence at HP team or other compliance teams (including dedicated Employee Relations corruption-related risks across 100% of our functions in 2021 investigators from Human Resources) conduct HP performs ongoing risk-based due diligence local investigations. Escalated allegations are global operations, including detailed reviews of of third parties that support our business, percentage of total investigated by a dedicated global Integrity the company’s global policies and processes including channel partners, sales intermediaries, Total number of reported items in 2021: 123 investigations team. HP’s investigation process applicable to all business units and global suppliers, and lobbyists. We communicate HP’s continues to evolve, with improved resources functions worldwide. We also use internal data anti-corruption standards and requirements to 2021 and technology to perform investigation-related and Transparency International’s Corruption 100% of these third parties through contractual functions in-house and to respond promptly Perceptions Index (CPI) to identify high-risk terms and conditions as well as our Partner Code Human resources 30% regions and assess risks related to our business. of Conduct and Supplier Code of Conduct. HP to concerns. Additionally, our global case Anti-corruption* 5% management tool enables us to identify emerging The public sector data analytics tools and requires all partners and suppliers, respectively, Misuse of assets 17% trends in ethics violations and to assess where processes we adopted in 2019 have enhanced to comply with our Partner and Supplier Codes additional controls may be needed. HP’s ability to monitor and mitigate potential risk of Conduct. Fraud 15% from its public sector business. These tools are Theft 5% subject to regular review and improvement to HP has implemented and maintains a robust risk- Brand protection/channel 7% Anti-corruption enhance the quantity and quality of available data. based legal and regulatory due diligence program to detect, mitigate, and prevent third-party anti- Conflicts of interest 8% We also periodically retain outside experts to corruption compliance risks and violations. Inaccurate records 11% Corruption disrupts fair competition, and is assess our anti-corruption policies and programs. at odds with HP values. We do not tolerate We benchmark our approach against peer We determine risk levels based primarily on Competition 2% corrupt behavior of any kind, including bribery companies to identify best practices in areas completion of our due diligence questionnaire Total 100% and kickbacks. including operational procedures, employee by the third party (every three years, for existing education, and supplier and partner training partners and suppliers) as well as the country- * Includes allegations of commercial bribery, kickbacks, and Our Anti-Corruption Policy and compliance and monitoring. level CPI. Based on these items, HP decides Global Business Amenities Policy violations, as well as alleged program require our employees, partners, corruption related to foreign public officials. and suppliers to follow all applicable national whether to conduct an additional due diligence laws and regulations, including the U.S. Foreign Complementing these assessments, HP conducts investigation. If we determine that the risk Investigating concerns Corrupt Practices Act and the UK Bribery Act. regular audits focused on potential corruption cannot be mitigated, we apply consequences to Although HP is not certified to an anti-corruption risks in our operations. These audits include end- the relevant third party by removing access to Suspected violations of Integrity at HP damage management system, all of our operational to-end review and testing of compliance policies specific benefits and/or terminating any contract trust in our company. We take all alleged violations sites and subsidiaries are required to follow and processes. with HP. seriously, ensure responses are timely, and take HP’s Anti-Corruption Policy and are subject disciplinary or remedial actions when appropriate, Potential corruption risks are reviewed using HP HP requires third parties to complete due including coaching, written warnings, and, in serious to HP’s compliance program and procedures transactional data and third-party corruption diligence on a predetermined basis. In general, cases, termination. Serious violations may impact (or a comparable subsidiary-level policy and assessments. The Anti-Corruption team may then all channel partners must complete this process an employee’s Total Rewards package (subject to compliance program). take various actions to appropriately minimize or before beginning a contractual relationship with local labor laws and where legally permissible). eliminate identified risk. This can include termination HP and then undergo a renewal process at least of partner contracts or special handling measures. 22 2021 HP Sustainable Impact Report www.hp.com/sustainableimpact
Contents Sustainable Impact Footprint Integrity and human rights Supply chain responsibility Operations Products and solutions Appendix once every three years. Third parties receive Human rights training as part of HP’s due diligence process. Training and communication HP’s stance on human rights is clear and and data protection, accessibility, and unintended purposes or in contexts that create uncompromising. We embrace our responsibility environmental sustainability. adverse human rights impacts. We deliver comprehensive anti-corruption to respect human rights, continually monitoring content to all employees through annual Integrity emerging human rights expectations and Our policy commitment includes respecting We sell PCs and printers to consumers, at HP training, as well as to all members of best practices. human rights in accordance with the United businesses, and governments worldwide. These the Board of Directors. We also communicate Nations Guiding Principles on Business and products and technologies are widely available in year-round with our employees to reinforce our Human Rights (UNGPs) and the Organisation the market from HP and its competitors. To avoid policies, controls, and training. Approach for Economic Co-operation and Development the misuse of our products and solutions, HP is (OECD) Guidelines for Multinational Enterprises. committed to complying with all relevant sanctions, Additionally, targeted employee training is We are committed to ensuring that everyone We commit to respect internationally recognized restrictions, and embargoes imposed by national provided to cover specific anti-corruption within HP and throughout our value chain is human rights as expressed in the: governments or international organizations across risks relevant to business functions, roles, and treated with dignity and respect. We insist that all our worldwide operations. In all of our business, responsibilities. In 2021: workers are treated fairly and have safe working • International Bill of Human Rights, meaning we prioritize the highest standards of corporate conditions and freely chosen employment. the Universal Declaration of Human Rights, the ethics, and we operate in strict accordance with all • Over 13,100 employees (99% of the employees International Covenant on Civil and Political applicable laws and regulations. assigned) who support HP’s public sector Policies and commitments Rights, and the International Covenant on business or work in higher-risk jobs completed Economic, Social and Cultural Rights. When we identify potential human rights risks this training. Of these, 33% were in the In 2021, HP strengthened its Human Rights Policy • International Labour Organization’s Declaration within our value chain, we conduct human rights Americas, 35% in Asia Pacific and Japan, and (available in 24 languages), which advances our on Fundamental Principles and Rights at Work. due diligence. When others make allegations 32% in Europe, the Middle East, and Africa. commitment to upholding human rights, engaging linking our business to adverse human rights with rights holders, and embedding our approach In addition, we continue to support the Ten impacts, we investigate the claims in line with • About 3,390 employees (92% of the relevant throughout our business and value chain. This Principles of the United Nations Global Compact. our Human Rights Policy. Wherever we can employee base) completed training on the policy and our Sustainable Impact strategy exert influence to mitigate alleged human rights requirements for doing business with the recognize that social and environmental issues We also commit to comply with local laws and impacts we do so. U.S. government. are interconnected, and many have human rights regulations. Where laws are silent as to protected dimensions. We work for holistic change across a human rights or are less stringent than our Governance and accountability Due to COVID-19-related travel restrictions during approach, we work diligently to develop solutions the year, these trainings were conducted virtually. broad range of areas. to advance our commitment, supporting progress Our President and Chief Executive Officer, who We have developed specialized policies wherever possible. is also a member of our Board of Directors, Requirements for mitigating anti-corruption approved our Human Rights Policy, and our risk associated with charitable giving are and practices to support our human rights communicated to employees through the HP commitments, including those addressing Technology and human rights Head of Corporate Affairs holds operational Global Charitable Contributions Policy, and risks supply chain responsibility, responsible Technology has the potential to improve the accountability for this policy. The Head of are mitigated through the grantmaking process. minerals sourcing, human resources, diversity, lives of people around the world. However, we Corporate Affairs, Chief Supply Chain Officer, equity, and inclusion, racial equality, privacy recognize that technology can also be used for and Chief People Officer are responsible for 23 2021 HP Sustainable Impact Report www.hp.com/sustainableimpact
Contents Sustainable Impact Footprint Integrity and human rights Supply chain responsibility Operations Products and solutions Appendix human rights across HP. The company operates Human rights due diligence In late 2021, we engaged external human rights The scope of on-site audits and specialized an internal Human Rights Council to further experts to assist us in governance assessment assessments depends on the nature of the promote the integration of our Human Rights Building on our knowledge and capabilities, and and a global human rights risk assessment. The work performed by the entity and the nature of Policy. The Council is chaired by an HP executive in line with the UN Guiding Principles on Business process, which is ongoing, will include reviewing the prioritized risks. For most of our production who has performance incentives to manage and Human Rights, we are responding to new stakeholder concerns across our sector, suppliers, we conduct full audits against our the company’s human rights program. The challenges, assessing risks, and monitoring engaging with potentially affected stakeholders Supplier Code of Conduct. For nonproduction Council is informed by independent external our performance. Progress includes being and civil society organizations, and reviewing suppliers, we may conduct audits only covering human rights experts. Board-level oversight is transparent about issues we face and discover, policies and procedures with reference both those portions of the Supplier Code of Conduct provided by the Nominating, Governance and and how we are resolving them. We practice to proposed human rights laws and to how our that are relevant to their operations. Social Responsibility Committee of HP’s Board human rights due diligence across our business voluntary commitments align to the UN Guiding of Directors. on our salient human rights issues (starting with Principles on Business and Human Rights and the Grievance mechanisms our own operations) including identification, UN Sustainable Development Goals. Training We offer multiple channels for our employees and investigation, prevention, and mitigation of The assessments will help us identify our priority third parties, such as workers in our supply chain, 1 adverse human rights impacts that the business human rights risks across our value chain, assess to ask questions and report concerns. We do not In 2021, 99.2% of employees (including senior executives) completed annual Integrity at HP may cause or contribute to through its own the ability of our policies and procedures to tolerate retaliation against those who engage training, which typically includes some human activities, or which may be directly linked to encompass new expectations and requirements, in our grievance processes, and we expect the rights-related content. For Human Rights Day on our operations, products, or services by our and inform creation of a tailored action plan to same from our business partners. December 10, 2021, we released an employee business relationships. help drive further enhancements to our human awareness video explaining human rights and rights efforts. We plan to share highlights when We collaborate to provide access to effective why they matter, as well as highlighting our legacy Risk assessment our evaluation is finalized. remedy and monitor reported grievances, of respecting human rights at HP. regardless of source, through to resolution. We Our human rights due diligence process is Audits and assessments also track and assess allegations of potentially Disclosures structured to identify and address human rights adverse human rights impacts that are brought risks and impacts across our value chain. Given We use audits and specialized assessments to to our attention outside of the grievance process, In addition to our Sustainable Impact Report, HP’s large global footprint, prioritization is critical help assess performance and identify corrective and take appropriate actions when allegations we also publish the HP Modern Slavery to the program’s effectiveness. We prioritize action where required. Use of audits and are confirmed. Learn more. Transparency Statement. risks based on salience—the severity and assessments is prioritized by level of risk. As a likelihood of adverse impacts on stakeholders we member of the Responsible Business Alliance might affect directly or indirectly. We strive to (RBA), we base our Supplier Code of Conduct continually improve our program by expanding on the RBA Code of Conduct and use the RBA responsible business conduct, ceasing, Validated Audit Process and Audit Protocol. preventing, or remedying the impact, and We only use certified auditors, and most audits reporting on implementation and results. are conducted by third-party auditing firms. 24 2021 HP Sustainable Impact Report www.hp.com/sustainableimpact
Contents Sustainable Impact Footprint Integrity and human rights Supply chain responsibility Operations Products and solutions Appendix Privacy HP recognizes the fundamental importance meet the requirements of changing regulations that provide additional topic- and role-based cybersecurity, legal, and communications— of privacy, security, and data protection to our and evolving circumstances. This includes training opportunities. manages and communicates about the breach, employees, customers, and partners worldwide. implementing enhanced internal policies and including any commercial or legal obligations to This is a critical pillar of brand trust and procedures to address our obligations as a Throughout the year, several regulatory changes notify customers. increasingly a source of competitive advantage data controller and processor, and to ensure influenced adjustments to our privacy program, in an era of accelerated innovation, global data that data subject rights are respected. including requirements from the United States In 2021, we saw a notable increase of data rights proliferation, and fast-changing regulatory and China that increased emphasis on consent requests to HP. We believe this was caused by frameworks. We build privacy, security, and data • Our privacy accountability and compliance and individual data rights. In addition, as we greater user awareness and empowerment in protection into the design and development of our framework outlines our procedures and continue our digital transformation journey, exercising rights as provided by law. See data. products, services, and operations. We strive to organizational controls for assessing and personal data governance is more critical to provide protections that exceed legal minimums managing risks associated with collecting our business. To address these business and across all our operations, and to deploy and handling personal data. It’s based on regulatory changes, we have launched a plan to Global standards and consistent, rigorous policies and procedures to requirements for accountability as defined by further enhance our privacy capabilities in data international data transfers give our customers, employees, and partners global laws and regulations. environments and user experiences. We are also confidence when sharing information with us and • Our Data Protection Officer, together with HP’s shifting our third-party privacy risk assessments The secure movement of data is essential to our using our products and services. Privacy and Data Protection team, provides approach from a questionnaire-based process to business. As legislation continues to evolve, our oversight and leadership for compliance, one based on evidence, through recognized and privacy and government relations teams work See our Privacy website for additional information. working closely with appointed privacy leads in independent privacy certifications. To simplify with governments worldwide to develop robust business teams throughout the company. the demonstration of privacy capabilities across and globally interoperable privacy and data • HP’s Health Insurance Portability and global supply chains, we are embarking on this transfer frameworks. Learn more. Approach Accountability Act (HIPAA) Compliance shift together with other companies. Office oversees compliance with HIPAA laws HP relies on lawful mechanisms for data transfer Our rigorous policies and standards are designed where they are triggered by our commercial to drive accountability across the organization. to keep personal data safe and respect privacy: services engagements. Privacy complaints, HP is recognized by EU data protection authorities • Our Privacy Statement describes our privacy breaches, and requests for our Binding Corporate Rules (BCRs), reflecting practices, as well as the choices users can In 2021, all HP employees were required to our high standards of data protection policies make and the rights they can exercise related complete our privacy principles training, and HP complies with worldwide privacy and data and procedures and enabling global data transfer to personal data. 97% of employees completed the course during breach notification laws and regulations, tracks within our company. the six-week campaign. The training is intended the number of substantiated complaints from HP complies with the Asia-Pacific Economic • We maintain internal policies and standards to reinforce HP’s privacy and data protection third parties and personal data requests made that align with international data protection and principles, and to ensure that employees to HP by individuals, and maintains an internal Cooperation’s Cross-Border Privacy Rules. privacy principles worldwide. These policies understand how to respect and protect incident-reporting process. Once a potential Due to recent court rulings in Europe on the and standards cover the data life cycle and employee and customer privacy. During the breach of personal data is identified, a core Schrems II case that invalidated the EU-U.S. continually strengthen privacy protections to year, we also offered access to online courses team—including representatives from privacy, Privacy Shield data transfer mechanism, HP no 25 2021 HP Sustainable Impact Report www.hp.com/sustainableimpact
Contents Sustainable Impact Footprint Integrity and human rights Supply chain responsibility Operations Products and solutions Appendix Privacy-related complaints, longer relies on the Privacy Shield framework emerging threats, and new practices. We Board, which includes our Chief Security Advisor for data transfers. We are working to strengthen regularly update our policies and standards as well as industry-recognized external experts, breaches, and requests* our committed transparency on this topic to to reflect new processing activities and and hosts HP’s Bug Bounty program. our customers, and to the EU data protection regulatory developments. 2019 2020 2021 authorities who authorize our BCRs, which permit Certification, audits, Substantiated complaints regarding ongoing data transfers outside the EU. We are Cybersecurity Organization and assessments breaches of customer privacy and also in the process of applying for BCRs in the UK losses of customer data at HP following Brexit. Our Cybersecurity Organization, led by HP’s Chief The Cybersecurity Organization regularly Substantiated complaints 14 22 37 Information Security Officer (CISO), maintains conducts audits of HP cybersecurity systems and from outside parties (including governance, processes, resources, and IT performs annual risk assessments of related HP customers) Cybersecurity partner and vendor relationships to help identify systems and processes, including our information Substantiated complaints from 1 2 4 and prevent unwanted access, security threats, security management system (ISMS). It also regulatory or other official bodies Cybersecurity is a key pillar of our digital and cyberattacks. It also provides extensive drives third-party risk assessments into our Data breaches (total)** 28 33 transformation and a high priority for HP, our incident response, vulnerability management, procurement process. Data breaches (reportable)** 1 4 customers, and other stakeholders. Our holistic and business continuity and disaster recovery approach integrates cybersecurity across the programs across HP, to support best-in-class end- Our risk-based ISMS maintained ISO 27001 Data requests made to HP*** value chain, including in the design, development, to-end security throughout HP’s supply chain. certification during 2021, assuring that HP Right to access/know (completed) 137 156 and delivery of our products, services, solutions, meets the international standard for information 1 Right to access/know (rejected) 36 49 and operations. We build resiliency into our Worldwide Security and systems security. We regularly commission business model, and work to avoid cybersecurity Analytics Practice internal and external audits by independent Right to erasure/be forgotten 2,195 4,400 incidents. When issues do occur, we rapidly assessors, and conduct an annual NIST (completed) Our Worldwide Security and Analytics Practice, framework assessment. Right to erasure/be forgotten 961 2,596 identify and resolve them, protecting individuals, (rejected) our customers, and HP. led by HP’s Chief Security Advisor, advances security within HP’s business units and products The Worldwide Security and Analytics Practice * Breaches of customer privacy cover any noncompliance with and collaborates with customers and clients. audits HP’s customer-facing cybersecurity existing legal regulations and voluntary standards regarding Policies and standards The Security Practice leads efforts to educate systems and conducts annual risk assessments the protection of customer privacy related to data for which of related systems and processes to help HP is the data controller. Substantiated complaints are written We maintain consistent, rigorous cybersecurity our employees and clients about cybersecurity, statements addressed to the organization by regulatory or policies, standards, and procedures to give our conducts related risk assessments, establishes establish baselines and drive improvement in similar official bodies that identify breaches of customer cybersecurity postures. privacy, or complaints lodged with the organization that have customers, employees, and partners confidence baselines, and creates cybersecurity roadmaps been recognized as legitimate by the organization. when sharing data with us. The HP Cyber Security for HP and our clients. ** Reportable data breaches are those that are required to be Policy Suite provides a framework for the Incident response reported by law. 2020 was the first year that HP disclosed this The Security Practice also drives alignment with data in this report. The majority of the total data breaches were company, informs overarching governance in this We have formal processes to address caused by human error or technical glitches and not a failure of area, and underpins cybersecurity company-wide. regulatory and compliance requirements such as our product or services security infrastructure. HIPAA, the Payment Card Industry Data Security cybersecurity events associated with our *** These data relate to requests made to HP by individuals globally. We educate employees about our policies and Standard, and various privacy laws. The Security worldwide client base that include customer 2020 was the first year that HP disclosed this data in this report. support and mechanisms to escalate issues as The median number of days taken to respond to right to access/ standards, as well as regulatory requirements, Practice coordinates the HP Security Advisory know requests and right to erasure/be forgotten requests in 2021 was 15. 26 2021 HP Sustainable Impact Report www.hp.com/sustainableimpact
Contents Sustainable Impact Footprint Integrity and human rights Supply chain responsibility Operations Products and solutions Appendix needed. Our online Security Bulletins support threats, and to drive cybersecurity innovation in • Ensuring market access and fostering supply Political engagement HP’s commitment to provide prompt notification our products, devices, services, and solutions. chain resilience. and remediation of any vulnerabilities related We follow security-by-design and privacy-by- • Creating digital trust through robust and We conduct all political engagements in a to our products, services, and solutions. When design principles and build security and resilience interoperable data-governance efforts that transparent, legal, and ethical manner and in incidents occur, the Cybersecurity Organization, into our products and services throughout the preserve open data flows. accordance with Integrity at HP. the Worldwide Security and Analytics Practice, product life cycle, from design, component and our Chief Technologist for Security respond sourcing, and manufacturing to transportation, • Advancing diversity, equity, and inclusion and In 2021, HP and the HP Employee Political Action swiftly, reporting activities to relevant leadership. service, and take-back. Learn more. driving digital equity. Committee (PAC) ceased supporting candidates When a potential cybersecurity event is identified, • Promoting sound sustainability policies that for elected office (and the HP PAC was dissolved). a core team is responsible for management address climate change, enable an achievable HP does not make political contributions within or of the event, including any commercial or legal Public policy circular economy, and support adoption of outside of the United States. obligations to notify our customers. renewable and efficient energy use. During 2021, HP did not experience any Geopolitical, socio-economic, environmental, • Preserving competitive tax structures and We also make public our U.S. lobbying expenditures cybersecurity events that required disclosure and technological trends drive governments creating economic investment incentives. and membership in U.S. trade associations that to the US Securities and Exchange Commission everywhere to consider policy actions that address engage in lobbying activity. HP did not make any • Enhancing innovation through emerging in-kind political donations in 2021. or other regulatory authorities.2 trust, resilience, equity, and climate change. See the Privacy technologies such as additive manufacturing section for analysis of data breaches associated and microfluidics. In 2021, for the fourth year in a row, we earned a with such cybersecurity events. HP public policy engagements are aligned with perfect score and tied for first place overall among our business interests and our core values to • Protecting against counterfeits. S&P 500 companies in the CPA-Zicklin Index of External engagement drive sustainable impact in climate action, human Corporate Political Disclosure and Accountability. rights, and digital equity. We seek opportunities HP is committed to advancing progress in to promote sustainable practices and new cybersecurity across the industry and beyond technologies, such as additive manufacturing by participating in relevant organizations and (3D printing), which contributed to an effective 2019 2020 2021 advisory boards, including IEEE, ISA, ISACA, response to COVID-19. HP corporate political contributions* (ISC)2, ISSA, NIST, SANS, ACFE, and IIA. We host State and local candidates and groups [US$] 111,900 138,900 0 the HP Client Advisory Council, which drives awareness and education, and provides a forum Policy priorities HP employee PAC contributions* for knowledge-sharing with clients worldwide. Federal and state candidates, party committees, and PACs supporting 85,500 95,000 0 Our global Government Affairs and Public Policy diverse candidates [US$] Product security and privacy team leads our engagement with policymakers, HP lobbying expenditures regulators, trade associations, and peer HP continues to conduct and participate companies to advance public policies aligned with Total U.S. federal lobbying expenditures (reported quarterly under the 1,620,000 1,570,000 2,140,000 in cybersecurity research to identify and HP’s interests and values. Our priorities include: Lobbying Disclosure Act) [US$] understand cybersecurity trends, risks, and * In 2021, HP and the HP PAC ceased supporting candidates for elected office (and the HP PAC was dissolved). 27 2021 HP Sustainable Impact Report www.hp.com/sustainableimpact
Contents Sustainable Impact Footprint Integrity and human rights Supply chain responsibility Operations Products and solutions Appendix Supply chain responsibility 29 Approach 34 Supplier diversity 31 Human rights 35 Environmental impact 31 Health and safety 39 Performance monitoring and evaluation 32 Responsible minerals sourcing 43 Data 28 2021 HP Sustainable Impact Report www.hp.com/sustainableimpact
Contents Sustainable Impact Footprint Integrity and human rights Supply chain responsibility Operations Products and solutions Appendix Approach HP relies on one of the IT industry’s largest supply and safe working conditions. To reduce our The strength of our supply chain responsibility For an overview of our management approach chains, made up of hundreds of production footprint, we collaborate with suppliers to program helps us to address customer in this area, including risk assessment, due suppliers and thousands of nonproduction decrease greenhouse gas (GHG) emissions, water expectations. In 2021, almost US$2 billion in diligence, grievance mechanisms, policies and 1 retained, existing and new sales took supply standards, continual improvement, capability suppliers. Ranging from multinational enterprises use, waste, and other environmental impacts. 2 building, external collaboration, and reporting, see to small firms, and operating in countries around chain responsibility into account. the globe, these suppliers provide us with We engage with suppliers in a wide range of ways Supply chain responsibility: Our approach. materials, components, and assembly for our to advance responsible practices. HP’s Supplier products, shipping and delivery to our customers, Code of Conduct stipulates that suppliers as well as a wide variety of other goods must adopt or establish a management system and services. that ensures compliance with applicable laws, Driving Sustainable Impact throughout the supply chain regulations, and customer requirements. The We strive for an ethical, sustainable, and resilient management system must also identify and Advancing social and environmental standards supply chain to protect the people making our mitigate risks related to the Code and be designed and capabilities across our supplier base 2030 GOAL products, safeguard our business and brand, to facilitate continual improvement in the is complex and requires long-term efforts. strengthen customer relationships, and create business’s social and environmental performance. We set goals to sharpen our focus and drive Reach 1 million workers through worker opportunities to innovate. ongoing progress. empowerment programs by 2030, since the 4 Suppliers representing 95% of HP’s total beginning of 2015 We require that all workers in HP’s supply chain production supplier spend have gone through PROGRESS IN 2021 receive fair treatment, freely chosen employment, a social and environmental assessment. Through 2021, we reached Our supply chain is complex, and we work to address a broad range 2025 GOAL 349,000 workers 3 of social, human rights, and environmental topics. Double factory participation in our supply chain sustainability programs by 2025, 2030 GOAL compared to 2015 Supply chain responsibility Assure respect for labor-related human rights5 Improving the lives of the people who make our products PROGRESS IN 2021 and support our business HP has achieved this goal, with a for 100% of our key contracted manufacturing suppliers and higher-risk next-tier suppliers 114% PROGRESS IN 2021 In 2021, we continued to conduct human increase through 2021, compared to 2015 rights assessments of our key contracted Responsible Environmental (therefore, we will not report on this goal manufacturers. We intend to report assurance Human rights Health and safety minerals sourcing Supplier diversity impact moving forward) calculations for 2022 29 2021 HP Sustainable Impact Report www.hp.com/sustainableimpact
Contents Sustainable Impact Footprint Integrity and human rights Supply chain responsibility Operations Products and solutions Appendix Transparency In 2021, we expanded the scope of our capability- SUPPLIER RESPONSIBILITY SCORECARDS building program to include our customer support business, in addition to production We disclose the names and locations of the Our Supplier Responsibility Scorecards are intended to set expectations and drive improved performance suppliers, nonproduction suppliers, and our own production suppliers that represent 95% of our through consistent, comprehensive, and actionable feedback. This tool provides suppliers with a score that manufacturing operations. Examples of the manufacturing spend. Our products are encompasses audit performance; environmental and human rights governance, transparency, goal setting, trainings and opportunities we provide, eight manufactured in countries and territories worldwide. and performance; conflict minerals management; and other social and environmental topics. Results are of which ran during the year, are listed in the summarized across multiple dimensions and contribute to a supplier’s overall procurement score, which table below. In addition to this report, we disclose information impacts the supplier’s relationship with HP and ongoing business. Suppliers discuss their Scorecard with about our supply chain responsibility and human HP as part of regular business performance evaluations, and receive additional points if they demonstrate In October 2020, we launched MOVE, a program to rights performance through our annual SEC sustained improvement. In 2021, average scores for final assembly suppliers increased by three percentage help empower migrant workers in Southeast Asia. Conflict Minerals Report, Modern Slavery points compared to 2020, and average scores for commodity suppliers increased by one percentage point, The initiative provides information on COVID-19 Transparency Statement, Report on Cobalt, and in part due to closer followup and collaboration with suppliers. Supplier Responsibility Scorecards applied to and delivers free training on workers’ rights in four CDP Supply Chain disclosures. We also provide suppliers representing 76% of our production spend. See Data for full results. languages to support workers and managers in tailored supply chain responsibility information to Cambodia, Laos, Myanmar, and Thailand. our customers and channel partners to help them achieve their sustainability and human rights goals. In 2019, we launched a two-year worker wellbeing • Responsible Minerals Initiative more than 16,000 employees at customer program in collaboration with Verité, an • Social Accountability International support-related and other nonproduction international nonprofit that promotes safe, fair, External collaboration suppliers who completed training on the HP and legal working conditions in global supply • U.S. Environmental Protection Agency Supplier Code of Conduct. HP takes a leading role through collaborations (EPA) SmartWay focused on elevating supply chain best • World Wildlife Fund (WWF) Climate Focus areas Examples of trainings and opportunities practices and tackling shared challenges. Key Business Network relationships include: • EHS awareness training Baseline conformance • Foreign migrant worker training • CDP Supply Chain program Capability building with HP standards • RBA Code of Conduct training • Clean Electronics Production Network • Rights and Responsibilities training • Green Freight Asia In collaboration with nongovernmental • Supply chain responsibility workshop (including science- organization (NGO) partners and other external based targets training) • Leadership Group for Responsible Recruitment organizations, we provide programs designed Ongoing engagement • Forced labor webinar • National Minority Supplier Development Council to help suppliers continually improve along their in key areas • Grievance mechanism webinar sustainability journeys. During 2021, we reached • Environmental expectation webinar • Clean Energy Buyers Association • Brazil Supplier Forum 37,000 workers through our capability-building • Responsible Business Alliance (RBA) programs, in areas such as worker wellbeing, Leadership above and rights and responsibilities, and environmental, • Worker wellbeing program • Responsible Labor Initiative health, and safety (EHS) awareness. This included beyond HP’s requirements • MOVE 30 2021 HP Sustainable Impact Report www.hp.com/sustainableimpact
Contents Sustainable Impact Footprint Integrity and human rights Supply chain responsibility Operations Products and solutions Appendix chains. This program aimed to strengthen health We communicate openly with workers and in 2021 addressing findings associated with Health and safety and safety knowledge and equip workers with the management in our supply chain to identify and modern slavery. tools and skills needed to grow professionally understand workers’ questions, concerns, and and personally. In 2021, we completed our final priorities. We train our procurement teams, As an example of our programs in this area, HP aspires to a world where our products assessment, in which we found that this program supplier managers, and other employees to be in 2019 we launched a partnership with Issara and operations use materials and chemicals improved workers’ knowledge about occupational vigilant and report instances of practices that Institute, an NGO that helps tackle issues related that cause no harm. We take a science-based health and safety, worker rights, and life skills. violate our standards. In 2021, we focused on to human trafficking and forced labor, to support approach to assessing the potential human The worker wellbeing program reached building additional communication channels to the monitoring of recruitment processes in health and environmental impacts of substances 10,700 workers. collect more extensive worker feedback that will Myanmar. In 2021, we kept our focus on worker used in making HP products. We engage with inform future work. voice, using Issara’s expertise to help understand our suppliers to strengthen knowledge and best In 2021, we launched a new digital learning and address worker concerns and improve practices in health and safety. platform in collaboration with Quizrr, a platform factory worker-management communication as dedicated to driving positive change through 1 we continued to deal with borders being closed innovative training solutions to advance corporate Combating modern slavery due to COVID-19. We plan to resume our focus on Process chemicals responsibility and capability building in global As part of our commitment to addressing modern responsible recruitment when borders reopen as supply chains. We delivered our Rights and slavery, we start with our own operations and the pandemic eases. In 2021, we continued to focus on implementation Responsibilities training through this platform. suppliers while striving to collaborate more of a comprehensive worker safety strategy broadly in ways that drive positive change. Modern To support and advance supplier due diligence, to address process chemicals. Suppliers are slavery, as defined in guidance under the UK we sponsor Responsible Recruitment 101, a virtual required to follow the manufacturing process Modern Slavery Act, can manifest itself in different training for suppliers in Taiwan and Malaysia chemical use restrictions outlined in HP’s Human rights ways, including through debt bondage, forced organized by the Responsible Labor Initiative. General Specification for the Environment (GSE). 2 The two-session training provides suppliers We continually deepen our understanding of the labor, and human trafficking. with a comprehensive understanding of forced Additionally, our Supplier Code of Conduct social and economic factors that lead to labor labor and modern slavery in relation to their own requires suppliers to employ robust management concerns, and then focus on areas of risk where HP is uncompromising in our expectations of systems to catalog and evaluate process ethical behavior by our employees, partners, and businesses, the Responsible Business Alliance chemicals, eliminate or manage hazardous we can have the most influence. We collaborate suppliers. In our Modern Slavery Transparency (RBA) Code of Conduct, and applicable laws substances, demonstrate that analyses of safer with organizations and government agencies with Statement, we discuss our efforts to address and regulations. alternatives were conducted when a hazardous local expertise to promote long-term, scalable modern slavery during the fiscal year ended chemical is being used, and provide workers with solutions. Our primary focus areas are combating October 31, 2021. HP is a Gold Level Sponsor of Truckers Against forced labor, protecting workers’ rights, and Trafficking (TAT), which helps combat human essential personal protective equipment and advancing worker health and safety, including Where significant risks are identified, we trafficking in the United States by educating and training. We gather data from our suppliers about safe use of process chemicals. work with suppliers and partners to address mobilizing members of the trucking and busing process chemicals and implement corrective challenges and enact risk-mitigation plans. As industries and coordinating with law enforcement action as needed. a part of addressing priority findings, HP has agencies. We are one of the few shippers that confirmed remedy to more than 250 workers participates directly, and we encourage all in our operations and supply chain, including carriers moving HP products in the United States approximately US$0.4 million in repayments to take TAT training. 31 2021 HP Sustainable Impact Report www.hp.com/sustainableimpact
Contents Sustainable Impact Footprint Integrity and human rights Supply chain responsibility Operations Products and solutions Appendix We encourage suppliers to switch to safer Responsible minerals sourcing choices, such as changing from solvent-based to water-based paints. In situations where the use of hazardous chemicals is currently Any connection between the materials used in chain in efforts to eradicate minerals that may smelters that comply with the RMI’s Responsible unavoidable, we help suppliers identify preferable HP products and armed violence or human rights have directly or indirectly supported armed Minerals Assurance Process (RMAP), which alternatives through our alternative materials abuses is unacceptable. To ensure our products groups, and to promote responsible sourcing of requires a third-party sourcing audit. Presence on assessment program. are made responsibly, we have adopted industry- minerals regardless of origin. the RMI conformant list demonstrates a smelter’s leading policies and monitoring practices and are conflict-free status. To drive progress across the industry, we are broadening our vigilance beyond conflict minerals HP supports retention of the U.S. conflict minerals a founding member of the Clean Electronics to a wider range of minerals and geographies. reporting framework as an economic driver for However, our relatively small use of these metals Production Network (CEPN), facilitated by the Through collaborative efforts, we aim to expand smelters to responsibly source minerals in the decreases our influence, so we need all industries NGO Green America. This collaborative multi- the market for responsibly sourced minerals, Democratic Republic of the Congo (DRC) and that use these materials to demand conflict-free stakeholder effort developed a program to including those originating from conflict-affected surrounding countries. In the EU, we support the 3TG. We will continue to work with our suppliers assess the use of process chemicals, strengthen and high-risk areas (CAHRAs). Conflict Minerals Regulation, which appropriately and across industries to drive demand for the culture of worker safety and engagement, focuses on responsible smelter sourcing conflict-free sourcing, regardless of whether the reduce worker exposure to identified priority regardless of country of mineral origin, including minerals originate in the DRC or elsewhere. process chemicals, substitute those chemicals Conflict minerals1 CAHRAs worldwide. with safer alternatives within members’ own We promote conflict-free minerals in our supply manufacturing processes, and ultimately reach Across our complex, global, multi-actor supply We do not support de facto embargoes of chain by: deeper into members’ supply chains. chain, we have the most influence over our direct minerals from the DRC and adjoining countries, or from other conflict-affected regions. We believe • Requiring our production suppliers of goods suppliers. However, in the case of trace and it is more effective to use our leverage (as a containing 3TG (“3TG suppliers”) to require In early 2021, we committed to taking collective precious minerals, we recognize that we must their smelters to undergo third-party sourcing action to protect workers in our global supply work to influence the practices of those much company and within cross-industry collaborations) chain from exposure to hazardous process to address issues and promote positive change. audits and use only smelters that are RMAP deeper in the supply chain. This helps to protect people in those regions while conformant. chemicals as a Founding Signatory of CEPN’s Toward Zero Exposure program, which has Approach maintaining their economic opportunities. We • Encouraging all smelters that purchase and been developed with sustainability and social are actively involved in the Responsible Minerals process mineral ores to undergo third-party responsibility leaders—including HP. Through While conflict minerals are rarely used in Initiative (RMI) and support its efforts to engage sourcing audits. the program, electronics brands and suppliers large volumes in any one IT product or by one with government stakeholders. • Supporting multi-stakeholder collaboration to commit to aligned, structured, long-term company, the tantalum, tin, tungsten, and gold establish secure, conflict-free sources of 3TG practices that will protect workers throughout (3TG) produced from them are found in relatively Eliminating conflict-related risks ores from the DRC. the manufacturing process from exposure to small amounts in virtually all electronic products. from our supply chain hazardous chemicals. Participants also commit to However, we are typically 4–10 supply chain public disclosure of progress starting in 2023. stages removed from the smelters that purchase Promoting best practices by smelters is the most the ores and process them into metals. For direct way to address the risk of conflict minerals this reason, HP works with peers across the IT entering our supply chain. We require our industry to collectively engage the entire supply suppliers to source 3TG for HP products only from 32 2021 HP Sustainable Impact Report www.hp.com/sustainableimpact
Contents Sustainable Impact Footprint Integrity and human rights Supply chain responsibility Operations Products and solutions Appendix Suppliers Performance Status of all supplier-reported Other regions and minerals HP sets clear requirements of 3TG suppliers In 2021, we received acceptable responses to RMI in our Supply Chain Social and Environmental Conflict Minerals Reporting Templates from 3TG facilities* Responsibility Policy (which includes our Conflict Learning from our experience combating conflict Minerals Policy), General Specification for the suppliers representing about 98% of our 3TG minerals in the DRC and surrounding countries, Environment, and Supplier Code of Conduct. procurement spend, including both final assembly 300 we are expanding our efforts. This aligns with and commodity suppliers. These responses growing awareness of mineral-sourcing issues detailed 267 3TG facilities, greater than 98% of 250 beyond the DRC and surrounding countries We assess these suppliers’ responses to the RMI Conflict Minerals Reporting Template, which were compliant or in the process of 200 covered by the U.S. Dodd–Frank Act. The EU which gives companies a common format for becoming compliant with an independent Conflict Minerals Regulation, which covers EU sharing information about 3TG sources with assessment program, and/or that we reasonably 150 imports of 3TG minerals from all regions of the business partners and suppliers across the believe exclusively source conflict minerals from 100 world, requires all large EU 3TG metal importers supply chain. We require corrective action from recycled or scrap sources or from outside of the and smelters to become “responsible importers” suppliers where needed, and provide them with Covered Countries (as of March 2022). 50 consistent with the OECD Due Diligence Guidance training upon request. If any 3TG supplier reports 0 for Responsible Supply Chains of Minerals from sourcing from a smelter that triggers one of 2019 2020 2021 Conflict-Affected and High-Risk Areas. Although our potential risk indicators, we work with the Progress toward DRC HP’s operations are not within the scope of the supplier to establish whether unverified material Conflict-Free, 2021 Unknown 40 1 6 EU regulation, we have voluntarily aligned our is potentially used in HP products. When we policy and approach to support our customers’ identify a risk of this occurring, we require the Progress Believed to source recycled/ 18 2 9 requirements consistent with the regulation. Type of Total toward DRC Percentage scrap or from outside of the supplier to remove the smelter from our supply facility Conflict-Free* Covered Countries The RBA is the parent organization of the RMI. chain. If a supplier is non-responsive, we use our In 2020, we supported revision of the RBA Code procurement leverage to engage the supplier and Tantalum 36 36 100% Compliant or in process** 237 247 252 improve performance. Tin 68 64 94% of Conduct so that it would address sourcing * from any CAHRAs worldwide, not only from the As of March 2022. Tungsten 46 46 100% ** Smelters or refiners listed by RMI as currently RMAP compliant DRC and Covered Countries. Leading up to this, Smelters Gold 117 115 98% (including certification or accreditation by similar independent we also supported RMI’s work to help smelters To identify and disclose the smelters and assessment programs cross-recognized by RMAP, such as the Total 267 261 98% Responsible Jewellery Council’s Chain-of-Custody certification develop processes to identify CAHRAs, as well refiners in our supply chain, between January program or the London Bullion Market Association’s Responsible as RMI’s work to fully align its processes and and December 2021 HP surveyed suppliers Gold Standard) or in the process of becoming RMAP compliant. * Number of total 3TG facilities in HP Conflict Minerals Report standards for assessing smelters’ sourcing that contributed material, components, or 3TG facility list that were either RMAP compliant or in process of practices with the OECD Guidance on sourcing manufacturing for products containing 3TG. Each becoming compliant, and/or that we reasonably believe exclusively U.S. Securities and Exchange Commission from CAHRAs. source conflict minerals from recycled or scrap sources or from smelter or refiner reported was identified in at outside of the Covered Countries (as of March 2022). (SEC) Conflict Minerals Report least one of the RMI Conflict Minerals Reporting In May 2022, we filed our Form SD and Conflict Our minerals due diligence and reporting also Templates we received. Minerals Report with the U.S. SEC, disclosing our includes cobalt, which has been linked to human due diligence efforts and results. See our SEC rights risks. We expect our suppliers to have Conflict Minerals Report. policies addressing cobalt, to report to HP the 33 2021 HP Sustainable Impact Report www.hp.com/sustainableimpact
Contents Sustainable Impact Footprint Integrity and human rights Supply chain responsibility Operations Products and solutions Appendix names of the cobalt refiners they use, and to join Supplier diversity us in encouraging these refiners to complete an RMI audit. Additionally, we encourage suppliers to engage in collaborative industry action Our commitment to diversity, equity, and inclusion LGBTQ+ individuals, and aboriginal or indigenous Minority Supplier Development Council, the through RMI. See our Report on Cobalt, and our is a top priority at HP and applies equally to individuals—to compete for our business. In 2021 Women’s Business Enterprise National Council, responsible minerals sourcing expectations our workforce and to our relationships with in the United States, we spent US$276 million with and industry groups such as tech:SCALE. for suppliers in HP’s General Specification for suppliers. Through our purchasing decisions and small businesses, US$79 million with minority- the Environment. activities, we foster greater opportunity, equality, owned businesses, and US$91 million with We launched the HP Racial Equality and Social and representation. Building a more diverse 1 Justice Task Force in June 2020. Through policies, women-owned businesses (see data). During the supply chain reflects our values while driving year, our supplier diversity program in the United programs, and executive sponsorships, we will Multi-stakeholder initiatives greater innovation, fortifying our business, and States had an overall economic impact of more help Black/African American-owned suppliers strengthening local economies. than US$650 million (see graphic below). develop relationships with HP that can strengthen Sourcing minerals responsibly requires globally their businesses and build economic power. To coordinated efforts across sectors and We encourage small businesses and diverse In 2021, we continued to develop our supplier drive economic empowerment, our goal is for 10% industries. We collaborate widely with businesses, companies—that is those owned by women, diversity program in the United States. To of HP supplier diversity spend in the United States NGOs, government agencies, and our production minorities, veterans, service-disabled veterans, accelerate our efforts, we work with the National to be with Black/African American suppliers in suppliers to advance the use of responsibly sourced minerals. Economic impact summary of HP supplier diversity program, 2021* Through RMI, we help develop and share due diligence standards, tools, trainings, and white papers to build the capabilities of the IT industry US$650 million+ overall economic impact** and beyond. We also support broader policy efforts through participation in RMI and its Due Diligence Practices, Smelter Engagement, and Sensing and Prioritization Teams. US$362 US$130 2,000+ US$200 Additionally, we collaborate through external Jobs supported through forums and initiatives, including the European MILLION MILLION+ MILLION+ Partnership for Responsible Minerals, Material Spending with small Incomes earned by employees HP’s spending with diverse Federal, state, and local Insights, and Public-Private Alliance for suppliers*** Responsible Minerals Trade. and diverse suppliers in the jobs supported by HP’s personal and corporate taxes supplier diversity program generated purchases * Data is for the 12 months ending September 30 of the year noted. Figures are based on HP purchases in the United States and Puerto Rico from U.S.-based businesses. ** Goods and services produced by HP’s diverse suppliers and their supply chains. *** Including professional services, scientific services, technical services, computer and electronic manufacturing, real estate, and numerous other industries. 34 2021 HP Sustainable Impact Report www.hp.com/sustainableimpact
Contents Sustainable Impact Footprint Integrity and human rights Supply chain responsibility Operations Products and solutions Appendix calendar year 2022, up ten-fold from 2020. We To advance progress deeper in our supply chain, Environmental impact achieved 4.5% in 2021. we have added a clause in new and renewed contracts for suppliers that provide services to In 2021, HP announced an expanded early HP in the United States, setting the expectation Our production and nonproduction suppliers suppliers, to disclose key qualitative and payment program in partnership with C2FO, that they should spend a minimum of 10% of any are essential partners as we work to drive net quantitative information about environmental which provides broad access to funding for the work subcontracted and/or purchased on behalf zero carbon and improved resource efficiency management and impacts through HP’s company’s diverse suppliers. Studies from the of HP with diverse businesses. To strengthen the throughout the value chain. For more than a CDP Supply Chain membership. Requested Federal Reserve and others have found that program’s racial equality focus, top suppliers decade, we have worked closely with our suppliers information includes GHG emissions and goals, diverse businesses face greater difficulty in subcontracting work in the United States must to improve their environmental programs and total and renewable energy use, water withdrawal, accessing credit, creating short-term cash flow spend at least 5% with certified Black/African report progress transparently. Our Supplier climate and water risks, and governance. challenges. We are working to bridge this gap American businesses. In 2021, our allocatable Responsibility Scorecards are central to our by offering inexpensive access to capital for indirect spend2 efforts to set expectations, evaluate performance, We periodically raise our expectations relating with diverse suppliers through this to supplier environmental management criteria, diverse partners that have been denied equal program was more than US$350 million. and drive ongoing improvement. access historically. such as science-based GHG emissions-reduction Supporting diversity in the We request 98% of our production suppliers, targets, third-party verification of GHG emissions, by spend, as well as strategic nonproduction publication of a GRI-based sustainability report, Supplier expectations financial sector HP’s Bank Model—the tool by which HP ranks and We ask that our suppliers partner with HP by prioritizes potential bank partners—incorporates prioritizing diversity, equity, and inclusion within an annual diversity survey that looks at bank HP CUSTOMER SUPPORT SUPPLIER PLEDGE their own operations. To improve the diversity of diversity overall as well as the diversity of teams HP is continually expanding the scope of our • Setting science-based GHG emissions reduction our suppliers’ workforces, we require top service that service HP. supply chain responsibility program, integrating targets, including at least a 50% reduction in suppliers in the United States with account teams it deeper and more broadly throughout our supplier absolute Scope 1 and 2 emissions by 2030 of 10 or more to implement diversity initiatives to In 2021, HP issued its inaugural Sustainability base. In 2021, we launched the Customer Support recruit, attract, and hire diverse employees, with Bond by partnering with Black/African American-, • Training employees on the HP RBA Supplier a goal that at least 10% of HP supplier account Latino-, women-, veteran-, and disabled veteran- (CS) Supplier Pledge to boost sustainability Code of Conduct team members be Black/African American by the owned banks, which have received approximately standards among the nearly 700 suppliers that HP CS engages with. The Pledge also sets additional supplier end of calendar year 2022. We also have targeted 5% of total underwriting fees. We engaged a expectations, such as: programs in the United States with marketing and Black/African American- and women-owned firm Developed to support progress toward our legal suppliers and partners. to execute the more than 10% of share 2030 climate and circular economy goals, the • Applying circular economy principles throughout repurchases carried out during 2021, and have Pledge includes several existing components their business, including by using programs such as continued working with a minority-owned firm as of our supplier program: HP Planet Partners and HP Device Recovery Service one of a small group of commercial paper • Submitting environmental transparency reporting • Developing and sharing ambitions that align with (short-term borrowing) dealers. to CDP Climate Change annually HP’s diversity, equity, and inclusion goals We aim to enrol our 50 largest CS-related suppliers. 35 2021 HP Sustainable Impact Report www.hp.com/sustainableimpact
Contents Sustainable Impact Footprint Integrity and human rights Supply chain responsibility Operations Products and solutions Appendix and transparent reporting of key environmental Greenhouse gas emissions Supplier GHG emissions performance information through CDP. tonnes CO2e We continue to deepen engagement with suppliers In 2008, HP was the first major IT company to representing GHG emissions “hot spots” in our publish aggregated supply chain GHG emissions 2018 2019 2020 2021 supply chain—such as LCD panels, printed circuit data. We continue working to drive progress in this Production supplier Scope 1 and Scope 2 emissions* 2,900,000 3,000,000 2,700,000 board assemblies, and memory and storage— area, including through our goals (see right). Our Product transportation 1,300,000 1,250,000 1,510,000 1,620,000 identified through life cycle assessments (LCAs) goal to reduce supply chain GHG emissions and directly collected data. In 2021, this included intensity is one of HP’s three value chain goals Nonproduction supplier Scope 1 and Scope 2 emissions* 210,000 190,000 140,000 procurement-driven workshops with 27 suppliers, validated by the Science Based Targets initiative * 2020 is the most recent year data is available. representing about 60% of HP’s production (SBTi). These goals were developed in collaboration spend. Focus areas included setting science- with WWF experts, demonstrating our rigorous based targets and establishing roadmaps for goal-setting process. 2025 GOAL 2025 GOAL increasing renewable energy use. To understand and manage our impacts, we Reduce first-tier production supplier and product Help suppliers cut 2 million tonnes of carbon transportation-related GHG emissions intensity dioxide equivalent (CO e) emissions between 2 calculate supply chain GHG emissions and water For the sixth consecutive year, HP was named by 10% by 2025, compared to 20151 2010 and 20252 withdrawal in two ways: by CDP as a Supplier Engagement Leader for our actions and strategies to reduce emissions PROGRESS THROUGH 2020 PROGRESS THROUGH 2020 • In this section of the report, we include data and manage climate risks in our supply chain. GHG emissions intensity decreased Suppliers avoided reported by our first-tier production suppliers, product transportation suppliers, and nonproduction suppliers. This data reflects the volume of HP’s business with each organization. 4% 1.46 MILLION Through engagement with suppliers, we can Although GHG emissions intensity decreased by through 2020, compared to 2015 TONNES better understand and influence improvements 4% between 2015 and 2020 when calculated as a 3 in performance year over year. of CO2e emissions three-year rolling average, yearly GHG emissions • The supply chain-related data included in our intensity values (not calculated as a rolling Production suppliers carbon and water footprints is derived from average) decreased by 9% during that timeframe. product LCA-based estimates. This analysis is To help reach our goal, we focus our suppliers’ Approach We also worked with other organizations during intended to provide as complete an attention on improving energy management and Through our Supplier Responsibility Scorecards, 2021 to accelerate cross-sector improvements: understanding as possible of impacts across efficiency, using renewable energy, and setting we set requirements for our production suppliers, • HP collaborated with the We Mean Business the multiple levels of our supply chain, from science-based targets. including related to energy use and GHG Coalition, CDP, and industry peers to promote materials extraction through manufacturing emissions performance and disclosure. In 2021, the uptake of SBTi methodology among IT and product use, as well as retail and storage. we continued engaging with suppliers to drive supply chain companies (both production and These calculations use a combination of positive change, for example by providing training nonproduction suppliers) based in the Greater HP-specific and industry methods and data. outlining our environmental expectations. China region. 36 2021 HP Sustainable Impact Report www.hp.com/sustainableimpact
Contents Sustainable Impact Footprint Integrity and human rights Supply chain responsibility Operations Products and solutions Appendix • We joined the 2021 CDP Science-Based More broadly, through CDP, our production We engaged 98% of our first-tier production We require our product transportation suppliers Targets Campaign and co-signed a letter to a suppliers reported savings of 20 million tonnes of suppliers, by spend, to help reduce their to use the Global Logistics Emissions Council large number of companies—including many COe and US$465 million from reduction initiatives environmental impact. Overall, 95% (by spend) Framework to provide standardized calculations 2 in our supply chain—urging them to set SBTi- 5 reported having GHG emissions-reduction- and data that account for variation in different implemented in 2020. This demonstrates the validated GHG emissions-reduction goals. By scale of ongoing GHG emissions-reduction related goals, and 31% reported science-based locations. To drive progress across the industry the end of 2021, nine of those suppliers had a activities throughout our production supply chain, targets (13% validated by the SBTi and 18% and beyond, we are working with the Clean Cargo new target in place, including four with a net regardless of whether driven by HP’s engagement. evaluated by HP). We also encourage suppliers Working Group, the Smart Freight Centre, the zero commitment. to use renewable energy. Seventy-seven percent International Council on Clean Transportation, • To support local demand for renewable energy reported doing so in 2021, by spend, with 71% and the U.S. Environmental Protection Agency in countries where some of our suppliers are reporting renewable energy use goals, up from (EPA) SmartWay program. based, we worked with the U.S. Department HP uses 100% renewable electricity to power 70% the prior year. the final assembly of over 95% of our PC and We continue to use SmartWay partners as a first of State through the Clean Energy Demand display products worldwide6 Product transportation choice for 100% of our products shipped by truck Initiative to produce letters of intent with 7 in the United States and Canada. The program those countries, which were presented at the Approach aims to help improve road transportation COP26 conference. To improve efficiency, cut costs, and reduce efficiency and reduce GHG and other emissions. • Along with seven of our suppliers, we Performance negative environmental impacts, we work to In 2021, HP won the U.S. EPA SmartWay Excellence participated in roundtable discussions In 2020, the most recent year for which data is optimize our logistics network by consolidating Award for the eighth year in a row, demonstrating hosted by WWF Climate Business Hub, with available, the suppliers that make HP products shipments, identifying new routes, and shipping leadership in freight supply chain energy and representatives from the Chinese government generated 2.7 million tonnes of Scope 1 and directly to customers or local distribution environmental performance for the “Large and renewable energy developers, to promote Scope 2 CO e emissions attributable to HP, 8% centers. To drive progress, in 2021 we held GHG Shipper” category in the United States. During policies that will enable greater renewable 2 emissions-reduction workshops with about the year, we joined the Sustainable Freight electricity sourcing in Jiangsu Province. less than in 2019. 20 suppliers representing more than 90% of Buyers Alliance to decarbonize freight and create This reflects the impact of supplier energy- our CO e emissions in this area. Sustainability demand for low and zero emissions across all Our Energy Efficiency Program in China and 2 modes of transport. Southeast Asia, implemented in collaboration with conservation measures and GHG emissions- topics are also discussed during our quarterly NGOs such as BSR, Natural Resources Defense reduction projects, increased renewable executive-level meetings with these same Reducing packaging size and weight also has Council (NRDC), the World Resources Institute, energy use, and investment in power purchase suppliers, to promote a focus on environmental the potential to decrease GHG emissions and WWF, helps suppliers to build capabilities, agreements. Facility closures caused by topics and encourage them to set related associated with product transportation. See identify ways to improve energy efficiency, and COVID-19 also reduced emissions. The intensity of performance goals. Packaging innovation. explore the use of renewable energy. GHG emissions per HP annual revenue decreased HP is participating in several pilot programs to in 2020 by 9% compared to 2015. explore opportunities to reduce GHG emissions Performance Since 2010, we estimate that participants in this from logistics, for example Maersk’s project with Product transportation resulted in 1.62 million and other programs have avoided 1.46 million industry leaders to scale zero carbon solutions tonnes of CO e emissions in 2021, up 7% from tonnes of CO 4 2 2e emissions and saved a cumulative for ocean transport, such as the use of carbon the prior year. This was due primarily to product 992 million kWh (US$119 million) of electricity, neutral e-methanol or sustainable bio-methanol. volume increases as well as improved data for including 81,000 tonnes of CO e emissions and 2 emissions related to road (including rail). 31 million kWh (US$3.9 million) in 2021. 37 2021 HP Sustainable Impact Report www.hp.com/sustainableimpact
Contents Sustainable Impact Footprint Integrity and human rights Supply chain responsibility Operations Products and solutions Appendix Nonproduction suppliers To identify supplier sites located in water- to year-over-year variations in data. By the end Performance Approach stressed areas, we use water risk assessment of 2020, 94% of our suppliers, by spend, had set During 2020, the most recent year for which data tools such as the World Resources Institute’s water management goals. is available, our suppliers generated 126,000 We purchase a wide range of goods and services Aqueduct Water Risk Atlas tool. We also identify related to the operations of HP, such as staffing, sites that manufacture relatively water-intense See HP’s 2021 water footprint. tonnes of nonhazardous waste associated with business consulting, marketing, and travel. product types, and use this information to assess HP, a 14% decrease from 2019. This was primarily We prioritize collaboration with nonproduction overall water stress risks and opportunities. due to reduced waste generation at a significant suppliers based on geographical risk and industry, We ask our suppliers to report water risk, use, Waste supplier through waste prevention, reuse, and and provide training to help improve reporting and management information through the CDP recycling efforts. Suppliers generated 46,000 and reduce GHG emissions. Supply Chain program. This drives suppliers’ Approach tonnes of hazardous waste associated with HP awareness of water security issues and allows us in 2020, down 13% compared to the prior year. Performance to assess suppliers’ current water management We work with production suppliers to encourage This was due largely to significant reductions by In 2020, the most recent year for which data strategies in the context of local environments waste measurement and reporting, reduce waste three suppliers. By the end of 2020, 76% of our is available, our nonproduction suppliers and communities. volumes, and drive progress toward a circular production suppliers, by spend, had set waste- reported 140,000 tonnes of Scope 1 and economy. HP requests our suppliers report on related goals, up from 72% the prior year. Scope 2 CO e emissions attributable to HP. See Through the use of best practice frameworks, waste using the RBA Environmental Survey. 2 we also work with suppliers to improve water detail in Footprint. During that year, 56% of HP reporting and, when appropriate, to enhance nonproduction strategic suppliers produced water management practices. environmental reports. SUPPLY CHAIN TRANSPARENCY To further drive improvements, we include water Much of our production supplier base is in China, so we have a particular focus in that area. The Corporate Water stewardship criteria in our Supplier Responsibility Information Transparency Index, developed by the Institute of Public & Environmental Affairs (IPE) and NRDC, Scorecard. Suppliers are scored for transparently evaluates the environmental practices of global brands’ supply chains in China. In 2021, HP ranked #7 among reporting quantitative water withdrawal as well global IT companies and #31 overall, of more than 600 brands assessed. On the Supply Chain Climate Action Approach as for having a public company-wide policy or Transparency Index, developed by IPE and CDP, HP ranked #15 of about 680 brands. Many of our suppliers operate in regions where governance structure for water at the board of water stress is a growing threat. We work director or top executive level. During 2021, we continued encouraging our suppliers to submit inventories of substances released through with production suppliers to improve water IPE’s public pollutant release and transfer register system, and cross-checked supplier sites representing 95% management in their operations, including Performance of our spend against IPE’s public database of environmental violations. through the Supplier Code of Conduct, which In 2020, the most recent year for which data We also collaborated with first-tier manufacturing suppliers in China to determine whether sub-tier suppliers contains provisions on water management, is available, production suppliers withdrew 36 complied with local environmental laws. This review of 730 sub-tier suppliers identified 27 reported violations in pollution prevention and resource use reduction, million cubic meters of water associated with HP, 2021. Of these, 18 had been corrected as of November 2021, and we continue working with the relevant first-tier and environmental permits and reporting. 3% less than in 2019. We believe that stronger suppliers and IPE to address and resolve the remaining issues. Business with several sub-tier suppliers has supplier water-accounting practices contributed been suspended due to unaddressed environmental violations. 38 2021 HP Sustainable Impact Report www.hp.com/sustainableimpact
Contents Sustainable Impact Footprint Integrity and human rights Supply chain responsibility Operations Products and solutions Appendix Performance monitoring and evaluation We engage with suppliers in multiple ways to HP Supplier Code of Conduct in the areas of conduct these activities. During the year, 88% of the RBA Factory Lead Certification Program, understand performance, identify and address labor, health and safety, environment, ethics, production supplier audits were third-party certified suppliers with scores from 160 to 180 are eligible issues, and drive ongoing progress: and management systems. See Supply chain RBA Validated Assessment Program (VAP) audits. for a Silver certification, and those with scores responsibility: Our approach for detail about above 180 for a Gold certification (including 36% • The supplier Self-Assessment the audit process. We also work with our We see a wide range of maturity levels in our of supplier facilities audited in 2021). Questionnaire (SAQ). This includes detailed final assembly suppliers to confirm they are audits, which are scored on a scale of 0–200. In questions around social and environmental conducting risk assessments of companies management and practices. As well as in their own supply chains that represent assisting HP to evaluate risk, identify areas for approximately 80% of their spend and assuring Sustainability audits, 2021* improvement, and determine a firm’s inclusion 25% of sites determined to be high risk, based in our audit program, self-assessment helps on the RBA Code of Conduct. Follow-up audits suppliers become more familiar with HP’s Initial audits (initial (addressing Full re-audits expectations of conformance to our Supplier • Supplier sustainability assessments. We evaluations of nonconformances (comprehensive conduct targeted assessments to supplement conformance) identified in any reassessments) Code of Conduct. During 2021, 171 production corrective action plans) suppliers completed SAQs. our comprehensive audits, focusing on specific risk areas including vulnerable workers (such Product supply chain • Coaching, specialized training, data as student, dispatch, and foreign migrant Production suppliers 19 46 61 collection, and ongoing dialogue. Using these workers) and health and safety (including fire Product transportation suppliers 2 0 0 mechanisms, we aim to help suppliers develop safety and emergency preparedness). In 2021, robust management systems to address root we piloted a new priority screening assessment Product reuse and recycling vendors 10 0 15 causes of key risks and challenges; for more at 12 facilities that will aid faster detection of Nonproduction suppliers detail, see Capability building. high-priority human rights risks throughout our Suppliers supporting HP manufacturing (on HP premises) 30 0 0 • Key performance indicator (KPI) monitoring supply chain, so we can more efficiently drive Suppliers supporting HP offices (on HP premises) 3 0 0 program. We collect data from high-risk targeted improvement. supplier sites weekly on key issues such Service suppliers (on third-party premises) 0 0 0 as working hours, day of rest, and student HP operations workers, and collaborate to drive ongoing Performance HP manufacturing sites 2 0 1 improvement. See results. HP offices 0 0 0 • Supplier audits. Our supplier audit process is In 2021, we completed 189 audits of production suppliers, product reuse and recycling vendors, * an essential component of our risk assessment Audits of production suppliers and suppliers supporting HP manufacturing followed the RBA Code of Conduct either 6.0 or 7.0 (released and nonproduction suppliers, as well as 24 other during 2021) audit protocols. We contract with Environmental Resources Management (ERM) to audit product reuse and recycling vendors framework and a key mechanism for identifying assessments of production suppliers. Travel and for conformance with the following policies and vendor standards: Export of Electronic Waste to Developing Countries Policy, HP Supplier opportunities for sustained improvement factory restrictions, as well as office closures Code of Conduct, and Reuse and Recycling Standards. See Product repair, reuse, and recycling for detail. Audits of nonproduction suppliers with our suppliers. Supplier audits measure supporting HP offices, off-site third-party nonproduction suppliers, and HP offices were focused on labor, ethics, and management systems. conformance with all provisions of the related to COVID-19, decreased our ability to 39 2021 HP Sustainable Impact Report www.hp.com/sustainableimpact
Contents Sustainable Impact Footprint Integrity and human rights Supply chain responsibility Operations Products and solutions Appendix Production supplier Distribution of nonconformances other 103 audits during 2021 were of commodity Other findings supplier sites. Of these, 63% scored over 160, sustainability assessments, 2021 and findings by section of HP 27% scored between 100 and 160, and 10% scored For audits conducted in 2021, suppliers were Supplier Code of Conduct, 2021* under 100. in full conformance (no major nonconformances percentage of total We periodically increase our expectations of identified) for the following provisions: risk of child Health and safety assessments 4 suppliers, so suppliers must continually improve labor; freedom of association; privacy; protection Onboarding assessments 3 to maintain a consistent audit score. For example, of identity and nonretaliation; fair business, 1% Vulnerable worker group (student and foreign worker) 4 11% Ethics in 2021 we adopted version 7.0 of the RBA Code advertising, and competition; intellectual property; assessments Management systems 42% Labor of Conduct, which includes requirements related disclosure of information; no improper advantage; KPI validation assessments 1 13% to worker voice and training, pregnant and and business integrity. Eighty initial audits and Environmental Priority screening assessments 12 nursing women, process chemicals, and water full re-audits of production suppliers conducted management. During that year, we also added in 2021 identified 528 major nonconformances, 2 new environmental requirements to our Supplier equivalent to 6.6 per audit on average. Six Responsibility Scorecard. provisions (see table on page 41) out of 45 total Distribution of scores of initial represented 67% of all major nonconformances * 33% identified. We focus on these and other areas that audits and full re-audits Health and safety Immediate priority findings have the greatest potential for improvement. 1 HP requires suppliers to provide a detailed Immediate priority findings are the most serious * 100% 200 Includes immediate priority findings, non-immediate priority type of supplier nonconformance, and require corrective action plan addressing all identified nonconformances, and major nonconformances identified. Data nonconformances within 30 days of receipt of is from initial audits and full re-audits of production suppliers immediate action. In 2021, we identified 14 80% 150 conducted in 2021. Due to our two-year audit cycle and changes immediate priority findings, equivalent to 0.18 the site audit report (except immediate priority to HP’s supplier base, data typically does not represent the same findings, which are addressed expeditiously), and supplier sites as the previous year. findings on average for each initial audit and s 60% e has processes in place to monitor progress and t i or full re-audit of production suppliers conducted. d u 100 sc subsequent closure of nonconformances. For l a There were two issues related to the charging l e u 40% ag Over time, we have seen supplier audit scores details, see the RBA VAP Operations Manual and f f er of recruitment fees, one related to health and % o v increase. From 2019 to 2021, the percentage of Supply chain responsibility: Our approach. 50 A safety, one related to forced overtime, one related 20% production supplier initial audits and full re-audits to falsified overtime records, two related to fire that scored above 160 increased from 45% to detection, and seven related to fire exits. We 0% 0 50%. The average score during that period rose required the issues to be immediately addressed, 2019 2020 2021 from 140 to 149. Twenty-three audits during 2021 and are working with the suppliers to complete were of final assembly supplier sites. Of these, 14 remediation and implement corrective actions to >160 100–160 <100 Average score (61%) scored over 160, eight (35%) scored between adjust their management systems. 100 and 160, and one (4%) scored under 100. The * Data is from initial audits and full re-audits of production suppliers. 40 2021 HP Sustainable Impact Report www.hp.com/sustainableimpact
Contents Sustainable Impact Footprint Integrity and human rights Supply chain responsibility Operations Products and solutions Appendix Issues with lowest rates of conformance of sites audited, 2019 and 2021* Issue Rate of conformance Rate of conformance HP’s approach 2019** 2021** Working hours 22% 24% Excessive working hours remains the most pressing labor challenge in our supply chain, especially around times of peak production and labor shortages. Workers often voluntarily work long hours to earn more money, and suppliers may lack effective management systems in this area. The rate of conformance increased in 2021 compared to 2019, even while dealing with residual COVID-19 impacts, including movement control orders and other restrictions. Although the RBA declared certain exemptions to working hours requirements of its Code of Conduct due to the COVID-19 pandemic, we audited suppliers during 2021 based on the regular requirements. *** Among suppliers in our KPI program (73 at the end of 2021, representing approximately 100,600 workers), 95% met our requirements related to working hours in 2021, compared to 93% in 2020. This increase demonstrated the ability of KPI program members to effectively manage this issue in the context of changing production demands during continuing challenges. Emergency 52% 49% Nonconformances include items such as blocked exit doors, missing or poorly lit exit signs, lack of fire exit instructions, and missing or defective emergency equipment. Most can be quickly remedied, while preparedness some take longer, such as replacing all fire exit doors. We supplement our audits with specific health and safety assessments. Wages and benefits 62% 55% In countries without a set minimum wage, the industry prevailing wage applies. The most common issue in wages and benefits is suppliers not paying appropriate social insurance. Examples of corrective actions related to wages and benefits include maintaining documentation of pay stubs and employer contributions to worker insurance schemes, and worker communication. Occupational safety 51% 65% Nonconformances related primarily to current safety permits and first aid response reporting. Suppliers must have tracking mechanisms and keep documentation of remediation and compensation provided to workers involved in an incident. A supplier with a nonconformance must also prove that training has been conducted, or will be conducted within 180 days. Dormitory and 74% 70% Workers must be provided ready access to clean toilet facilities, potable water, and sanitary food preparation, storage, and eating facilities; dormitories provided by the supplier or a labor agent must be clean canteen and safe. Corrective actions in this area are typically straightforward, such as ensuring exit signs are properly illuminated, maintaining fire extinguishers, and having food samples available for quality and safety testing. Hazardous 72% 74% Suppliers must properly label and store all hazardous substances in their facilities. Corrective actions may include development of inventory management systems, maintaining a list of approved chemicals, substances use of auditor-verified vendors, and education on legal restrictions related to material use. During 2021, we continued to work directly with suppliers that had nonconformances in this area to help them fully understand our requirements and resolve the issues. We also committed to the Toward Zero Exposure program in collaboration with the Clean Electronics Production Network, which takes collective action to protect workers in our global supply chain from exposure to hazardous process chemicals. See Process chemicals. * Data is from initial audits and full re-audits of production suppliers conducted in 2019 and 2021. Due to our two-year audit cycle and changes to HP’s supplier base, data typically does not represent the same supplier sites as the previous cycle. ** Percentage of sites with no immediate priority findings, non-immediate priority nonconformances, or major nonconformances identified. *** The HP KPI program measures the performance of HP production lines at participating supplier facilities, and not the overall performance of those facilities. In contrast, initial audits and full re-audits assess the overall performance of supplier facilities where other brands in addition to HP may also manufacture products. 41 2021 HP Sustainable Impact Report www.hp.com/sustainableimpact
Contents Sustainable Impact Footprint Integrity and human rights Supply chain responsibility Operations Products and solutions Appendix Rates of conformance of sites audited, 2019 and 2021* HP Supplier Code of Conduct section/provision Rate of conformance Rate of conformance HP Supplier Code of Conduct section/provision Rate of conformance Rate of conformance of sites audited, 2019** of sites audited, 2021** of sites audited, 2019** of sites audited, 2021** Labor 84% 84% Storm water management 91% 93% Freely chosen employment management systems 80% 84% Energy consumption and GHG emissions 94% 94% Risk of forced labor 91% 83% Ethics 98% 99% Young worker protection management systems 94% 98% Business integrity 98% 100% Risk of child labor 100% 100% No improper advantage 97% 100% Working hours 22% 24% Disclosure of information 94% 100% Wages and benefits 62% 55% Intellectual property 100% 100% Humane treatment 98% 99% Fair business, advertising, and competition 98% 100% Nondiscrimination management systems 92% 96% Protection of identity and nonretaliation 98% 100% Risk of discriminatory practices 100% 99% Responsible sourcing of minerals 98% 95% Freedom of association 98% 100% Privacy 98% 100% Health and safety 78% 80% Management systems 93% 94% Occupational safety 51% 65% Company commitment 98% 98% Emergency preparedness 52% 49% Management accountability and responsibility 92% 96% Occupational injury and illness 78% 86% Legal and customer requirements 86% 95% Industrial hygiene 88% 85% Risk assessment and risk management 94% 94% Physically demanding work 92% 94% Performance objectives with implementation plan and measures 91% 95% Machine safeguarding 97% 89% Training 95% 98% Dormitory and canteen 74% 70% Communication 97% 98% Health and safety communication 91% 99% Worker feedback and participation 97% 96% Environmental 89% 89% Audits and assessments 92% 95% Environmental permits and reporting 95% 93% Corrective action process 97% 95% Pollution prevention and resource reduction 92% 91% Documentation and records 97% 96% Hazardous substances 72% 74% Supplier responsibility 75% 79% Wastewater and solid waste 95% 98% * Data is from initial audits and full re-audits of production suppliers conducted in 2019 and 2021. Due to our two-year audit cycle and Air emissions 80% 83% changes to HP’s supplier base, data typically does not represent the same supplier sites as the previous cycle. ** Percentage of sites with no immediate priority findings, non-immediate priority nonconformances, or major nonconformances identified. Data refers to the RBA Code of Conduct 6.0 or 7.0 (released during 2021). 42 2021 HP Sustainable Impact Report www.hp.com/sustainableimpact
Contents Sustainable Impact Footprint Integrity and human rights Supply chain responsibility Operations Products and solutions Appendix Data Supply chain responsibility* 2019 2020 2021 suppliers. Data in this table for 2021 is specific to production suppliers, except the following included in sustainability audits and other assessments: two initial audits of product transportation suppliers and 33 initial audits of nonproduction suppliers. Data is not included Suppliers publishing sustainability reports using the GRI framework 91% 91% 91% in this table for product reuse and recycling vendors. See page 74 for information about our programs and performance in that area. ** [% of production supplier spend] With the exception of train-the-trainer programs, HP only accounts for workers directly reached by our capability-building programs. Number of workers reached each year depends on the programs executed: some programs address issues broadly across suppliers Capability building and workers; other programs focus more narrowly on individual supplier sites or specific vulnerable worker groups. Prior to 2020, data included production supplier workers only. In 2020, we expanded the scope of our program to also include nonproduction supplier Number of capability-building programs 7 5 8 workers and workers at HP-controlled manufacturing facilities, and in 2021 we further expanded the scope to also include our customer support operations. Workers reached through capability-building programs** 11,000 46,000 37,000 *** Based on production-line workers at final assembly and select commodity sites participating in the HP KPI program. We continue to expand the list of suppliers in the KPI program based on business risk, country risk, and identified nonconformances. Workers’ rights † See page 40 for detail. Suppliers’ employees working 60 hours per week or less on average*** 95% 93% 95% †† These totals are the number of workers as of the date of the site visit according to production supplier initial audit and full re-audit reports. ††† Scores reflect performance against criteria that are updated periodically. Suppliers’ employees receiving at least one day of rest each seven-day workweek*** 99% 97% 97% Suppliers in China with student workers representing 20% or less of total employees*** 99% 100% 100% 2020 2021 Immediate priority audit findings (immediate action required) related to the ILO 0 3 4 US$ % of qualified US$ % of qualified Declaration on Fundamental Principles and Rights at Work: freedom of association; HP’s spend with U.S. diverse suppliers* millions spend millions spend forced, bonded, or indentured labor; child labor; or discrimination† Small businesses 348 26.3% 276 22.3% Immediate priority audit findings (immediate action required) related to occupational 6 7 10 ** safety, emergency preparedness, or industrial hygiene† Minority-owned businesses 77 5.8% 79 6.4% ** †† Women-owned businesses 95 7.2% 91 7.4% Workers at sites audited [total] 198,300 229,400 316,700 Sustainability audits and other assessments [total] Veteran-owned businesses, service-disabled veteran-owned 7 0.5% 21 1.7 % businesses, HUBZone businesses, and others*** Initial audits 103 22 54 * Data is for the 12 months ending September 30 of the year noted. Figures are for purchases in the United States and Puerto Rico from Follow-up audits 41 37 46 U.S.-based businesses. ** Full re-audits 43 44 61 Suppliers are categorized as minority-owned or women-owned, not both. These categories include all sizes of businesses. *** These categories include all sizes of businesses. Assessments 60 3 24 Supplier Responsibility Scorecard average score—Commodity suppliers††† 86% 89% 89% Supplier Responsibility Scorecard average score—Final assembly suppliers††† 83% 82% 85% Rates of conformance of sites audited, 2019 and 2021 (see page 42) * Data in this table for 2019 is specific to production suppliers, except the following included in sustainability audits and other assessments: 64 initial audits of nonproduction suppliers and 17 initial audits of product transportation suppliers. Data in this table for 2020 is specific to production suppliers, except the following included in sustainability audits and other assessments: 13 initial audits of nonproduction 43 2021 HP Sustainable Impact Report www.hp.com/sustainableimpact
Contents Sustainable Impact Footprint Integrity and human rights Supply chain responsibility Operations Products and solutions Appendix # Environmental impact # 2018 2019 2020 2021 In some cases, data from prior years is updated to reflect improved data—for example, revised supplier information. * Intensity is calculated as the portion of first-tier production and product transportation suppliers’ reported GHG emissions attributable First-tier production supplier and product transportation-related GHG 76.4 74.8 73.7 to HP divided by HP’s annual revenue. This method normalizes performance based on business productivity. Intensity is reported as a , three-year rolling average to decrease the impact of variance year over year and highlight longer-term trends. Production supplier GHG emissions intensity*** [tonnes CO e/US$ million of HP net revenue] 2 emissions include Scope 1 and Scope 2. The year 2020 is the most recent for which data is available. ** GHG emissions We believe that variation in this data reflects both changes in actual performance and inconsistency in reporting practices. *** Emissions are calculated based on suppliers’ reported emissions and their dollar volume of HP’s business compared to their total *** Production supplier GHG emissions [tonnes CO2e] revenue. The majority of these companies report on a calendar-year basis. Data reported here reflects extrapolation to 100% of first-tier production suppliers. Data collected for 2020 represented 96% of HP production spend. The World Resources Institute ** Scope 1 and Scope 2 emissions 2,900,000 3,000,000 2,700,000 defines Scope 1, 2, and 3 GHG emissions in its Greenhouse Gas Protocol. This data differs from the product LCA-based estimates for , materials extraction through manufacturing presented on page 18, which are based on a different calculation methodology and use a Scope 3 emissions** **** 13,200,000 18,000,000 17,500,000 combination of HP-specific and industry data. The year 2020 is the most recent for which data is available. **** Production suppliers with GHG emissions-reduction-related goals 94% 94% 95% Suppliers may not report all Scope 3 categories. The number of categories reported by suppliers and the completeness of reporting [% of spend] varies year to year. † The figures for product transportation GHG emissions are based on data reported by product transportation suppliers that HP Product transportation GHG emissions† [tonnes CO2e] 1,300,000 1,250,000 1,510,000 1,620,000 contracted to deliver products. They may differ from the product LCA-based estimates presented on page 18, which are based Road (includes rail) 410,000 190,000†† 160,000†† 260,000 on a different calculation methodology, use a combination of HP-specific and industry data, and include additional upstream and downstream transportation related to the company’s products. †† Ocean 180,000 90,000 100,000 90,000 2019 and 2020 data for the “Road (includes rail)” segment were restated to reflect more accurate data from a single product transportation supplier. Air 710,000 970,000 1,250,000 1,270,000 ††† Total energy includes purchased energy (electricity, etc.) and generated energy (fuel use, etc.). Energy use data is calculated based on suppliers’ reported energy use and their dollar volume of HP’s business compared to their total revenue. Data reported here reflects Nonproduction supplier Scope 1 and Scope 2 GHG emissions extrapolation to 100% of first-tier production suppliers. Data collected for 2020 represented 95% of HP production spend. (see Footprint) ^ This metric reports the amount of water withdrawn by suppliers, not the amount consumed by our multi-tier supply chain as reported Energy use in our water footprint on page 19. Because water withdrawn can also be returned, this footprint is inherently larger. Refers to first-tier suppliers for manufacturing, materials, and components. Withdrawal is estimated based on suppliers’ reported water withdrawal and ††† their dollar volume of HP business compared to their total revenue. The majority of these companies report on a calendar-year basis. Production supplier energy use [MWh] 5,900,000 6,500,000 6,000,000 The year 2020 is the most recent for which data is available. Data reported here reflects extrapolation to 100% of first-tier production Production supplier renewable energy use [% of total energy use] 23% 25% 26% suppliers. Data collected for 2020 represented 92% of HP production spend. ^^ Waste data is estimated based on suppliers’ waste data and their dollar volume of HP business compared to their total revenue. ** Production suppliers that reported using renewable energy 78% 78% 77% The majority of these companies report on a calendar-year basis. The year 2020 is the most recent for which data is available. [% of spend] Data reported here reflects extrapolation to 100% of first-tier production suppliers. Data collected for 2020 represented 89% of HP production spend for nonhazardous waste and 84% for hazardous waste. Water , ** ^ Production supplier water withdrawal for use [cubic meters] 35,000,000 37,000,000 36,000,000 Production suppliers with water-related goals [% of spend] 93% 92% 94% Waste , ** ^^ Production supplier nonhazardous waste generation [tonnes] 144,000 146,000 126,000 , ** ^^ Production supplier hazardous waste generation [tonnes] 56,000 53,000 46,000 Production suppliers with waste-related goals [% of spend] 72% 72% 76% 44 2021 HP Sustainable Impact Report www.hp.com/sustainableimpact
Contents Sustainable Impact Footprint Integrity and human rights Supply chain responsibility Operations Products and solutions Appendix Operations 46 Our employees 58 Community giving and volunteerism 53 Our facilities 61 Data 45 2021 HP Sustainable Impact Report www.hp.com/sustainableimpact
Contents Sustainable Impact Footprint Integrity and human rights Supply chain responsibility Operations Products and solutions Appendix Our employees 1 Approximately 51,000 employees worldwide Innovation at HP comes from the diverse power HP’s innovation, contributing unique perspectives, backgrounds, knowledge, and HP demographics* perspectives and a growth mindset to create experiences of our employees. Our vision is a breakthrough technologies and transformative workplace that is globally connected and drives 2019 2020 2021 solutions. We are committed to fostering a a responsive culture of belonging that fosters Board of Directors diverse, equitable, and inclusive workplace that courageous conversations and welcomes ideas attracts, retains, and advances exceptional from any source. We strive to create an inclusive Women 42% 45% 46% talent. Through ongoing employee development, environment where people can be their authentic Racial/ethnic minorities 58% 45% 46% comprehensive compensation and benefits, and selves at work and reach their full potential. Women in leadership a focus on health, safety, and employee wellbeing, Executives reporting directly to the CEO 23% 25% 25% we strive to support our employees in all aspects Our goal is to be universally ranked as an of their lives so they can do their best work—while employer of choice for underrepresented groups Director level and above 31% 32% 33% learning, growing, and feeling engaged. in the technology industry by 2030, and we are Technical roles determining how to best measure progress. In Women in IT and engineering 22% 22% 23% 2021, 44.9% of our U.S. hires were racial/ethnic Diversity, equity, and minorities, and we continue to work on removing U.S. racial/ethnic minorities in IT and engineering 28% 31% 33% inclusion barriers for employees from underrepresented Revenue-generating roles groups by working to remove bias, and by creating Women in sales roles (all levels) 28% 29% 28% world-class programs and training, growth, and At HP, diversity, equity, and inclusion (DEI) is a development opportunities. Our integrated U.S. racial/ethnic minorities in sales roles (all levels) 19% 20% 21% business imperative. Our employees are driven * strategy, embedded deeply into our culture of Board of Directors data for 2021 is as of the conclusion of the 2022 annual meeting of stockholders on April 19, 2022. Board of Directors by it, customers call for it, investors expect inclusion and belonging, enables us to attract, data for 2020 is as of the conclusion of the 2021 annual meeting of stockholders on April 13, 2021. Board of Directors data for 2019 is as of it, and our reputation is impacted by it. Our November 1, 2019. Other data is as of October 31 of the year noted. Employee data refers to regular full-time and part-time employees. commitment extends beyond our employees to retain, promote, and grow top talent. our relationships with suppliers, partners, and DEI is a source of strategic business value. communities worldwide. DEI has been part of our Research by McKinsey has consistently shown DNA since the beginning, and it is critical to our a correlation between companies with diverse future. Our DEI strategy focuses on where we can executive teams and the likelihood of financial make the greatest impact across our culture, our outperformance—and this relationship has only people, and our communities. 2 strengthened over time. See detailed employee demographics data and HP’s 2021 EEO-1 Report. 46 2021 HP Sustainable Impact Report www.hp.com/sustainableimpact
Contents Sustainable Impact Footprint Integrity and human rights Supply chain responsibility Operations Products and solutions Appendix HP RACIAL EQUALITY AND SOCIAL JUSTICE TASK FORCE 2030 GOALS Maintain higher than 90% rating on internal inclusion index for all employee demographics In 2020, we formed HP’s Racial Equality and Social Justice Task Force, which works to identify and execute on, Achieve 50/50 gender equality in HP leadership3 4 annually and hold us accountable on, the biggest opportunities we have as a company to drive sustainable impact in racial equality by working across three main areas: PROGRESS IN 2021 PROGRESS IN 2021 Women represented Achieved a rating of • People: We will accelerate the strategies, practices, and policies around our pipeline, retention, and promotion of Black/African American talent. 32.5% 87% • Industry: We will leverage our industry leadership and spending power to influence our ecosystem, of director-level and above positions globally compared with 89% in 2020 including our partners, vendors, and suppliers. (as of October 31, 2021) • Local and national: We will advocate for equitable treatment of Black/African American people through Double the number of Black/African American public policy, civic action, and clear corporate positions on local and national issues. Achieve greater than 30% technical women executives5 by 2025, from a 2020 baseline and women in engineering by 2030 The Task Force is dedicated to achieving its goals by providing the foundation, framework, vision, and guidance PROGRESS IN 2021 for nearly 300 volunteers to help solve some of our communities’ most difficult issues on race. View progress PROGRESS IN 2021 Increased by on our stated objectives on the Task Force website. The work and outcomes of the Task Force have been Women represented accelerated by our leaders, who have committed to annual objectives aligned to hiring more diverse talent, 33% specifically Black/African American talent. 22.7% compared with 2020, about one-third of the Beyond the Task Force, volunteers are driving progress in their local communities by focusing on local equality of engineering and technology positions way to achieving the goal and social justice issues through initiatives such as the Ernie Thorne Scholarship of St. Anselm College in globally (as of October 31, 2021) Manchester, New Hampshire. Double Black/African American technical Meet or exceed labor market representation representation in the United States by 2025 for racial/ethnic minorities in the United States (2020 baseline) by 2030 Culture Board of Directors. Through this program, each PROGRESS IN 2021 board member is paired with a member of our PROGRESS IN 2021 Increased Black/African American technical Our commitment to DEI starts at the top, with a executive leadership team to gain in-depth Researched labor market data to determine representation in the United States from 2.3% to highly knowledgeable, skilled, and diverse Board knowledge of HP’s business, programs, and best benchmarks and baselines (in process) of Directors. HP’s Board of Directors is one of the practices to positively impact our culture, people, 2.6% most diverse of any U.S. technology company, and communities. comprising 46% racial/ethnic minorities and Non-Discrimination Policy, and Open Door Policy. 46% women. Our DEI policies and practices are the foundation for a positive and innovative culture of belonging. HP’s Chief Diversity Officer oversees the partnerships to increase our diverse talent pipeline. Our Board of Directors/Executive Leadership The HP Global Best Work Environment Policy company’s global DEI strategy, Racial Equality Working closely with executives and business reverse mentorship program helps us capitalize supports our efforts and includes the Global and Social Justice Task Force, Business Impact leaders, the DEI team focuses on aligning DEI to on the advantages of a strong and diverse Harassment-Free Work Environment Policy, Global Networks (BINs), targeted equity programs, and business goals, representing workplace needs, 47 2021 HP Sustainable Impact Report www.hp.com/sustainableimpact
Contents Sustainable Impact Footprint Integrity and human rights Supply chain responsibility Operations Products and solutions Appendix supporting marketplace opportunities, and driving As of the end of 2021, HP had 10 Distinguished 2021 McKinsey Black, Asian, and Hispanic/Latin global accountability for progress and outcomes. Employee survey results* Technologists/Strategists who are women. American Connected Leader Academies, which Diversity and inclusion hone executive and management leadership To ensure leadership embeds a strong focus on As of 2021, 89% of participants in HP Catalyst capabilities through expert-led virtual and small DEI, each member of our executive leadership 2019 2020 2021 (our 12-month emerging leaders’ program) were group discussions. team has individual performance goals under women, with an overall retention rate of 76%. 38% the Management by Objectives program tied to I feel HP values diversity 92% 95% 94% of participants since 2017 were subsequently During 2021, 61% of our U.S. hires overall were DEI. Our executive leadership team members are I can be myself at work 85% 88% 87% promoted or accepted a new role internally. from underrepresented groups, including women, evaluated on their actions to advance DEI. * See Employee development. This program is racial/ethnic minorities, people with disabilities, Data refers to the percentage of HP 2019, 2020, and 2021 Voice Insight Action (VIA) employee survey respondents who strongly complemented by women’s leadership initiatives and military veterans. In 2016, HP committed to HP’s BINs illustrate our DEI strategy in practice. agreed or agreed with each statement. such as Disha, a six-month program in India; the hiring 150 veterans or military spouses over the 6 We have 130 BINs in 37 countries, up from 118 in Talent Development Program and Women in course of five years. Through 2021, HP hired 283 2020. Our BINs are open to all employees and Leadership Lab in Mexico; the annual women’s veterans. Our culture of diversity and community represent: Black/African American, Disabilities, leadership conference in the United States; and allows us to retain, develop, and promote the Hispanic/Latin American, LGBTQ+, Multicultural, In February 2020, our CEO Enrique Lores took WOLFpack, an eight-month women’s development best talent. Multigenerational, Veterans, and Women. In the CEO Action for Diversity & Inclusion™ program in Costa Rica. addition to leading community outreach programs, pledge on behalf of HP to advance diversity Recognizing that traditional hiring practices can BINs promote diversity in pipeline development, and inclusion in the workplace. He also joined To address the systemic barriers that exist screen out qualified and talented applicants local hiring, talent programs, and mentoring. They the governing committee of CEO Action for to diverse representation in leadership and with autism, in 2019 we launched our Spectrum also implement campaigns such as Black History Racial Equity, a new fellowship that provides the the importance of sponsorship in career Success program partnership with Vocational Month, International Women’s Week, ALLIES@HP, opportunity for signatories to advance racial development, we have increased our investment Rehabilitation and PROVAIL, focusing on equity through public policy. PRIDE Month, and workshops for LGBTQ+ allies. in the development of Black/African American recruitment, hiring, and retention. Of the 23 leaders. For example, we expanded our Catalyst program candidates through 2021, nine were Belong, Innovate, and Grow development program in 2021 to include an offered internships. Watch video. People additional cohort focused on Black/African Our Belong, Innovate, and Grow strategy continues American employees in the United States. As part of our efforts to attract and retain people to drive our culture, embedding DEI across all As we continue to operationalize and integrate with disabilities, participants in our China HOPE parts of our businesses and functions, including DEI in all parts of HP, our people will more closely Our partnership with the Information Technology (HP Opportunity and Equality) and Japan’s Internal recruitment, talent and learning culture, mentoring, reflect our communities globally. Senior Management Forum (ITSMF) continues to Service Center programs spend half of their time training, and events. In our annual employee We are committed to continuing to improve train and develop Black/African American and at HP learning business skills. Through the end of engagement survey, employee feeling that HP representation of women at HP, with a focus on diverse IT leaders through ITSMF’s Management 2021, all HOPE participants had become full-time values diversity was highly rated, at 94%. Our management. HP is among the top technology Academy. Through 2021, we sponsored a 100% hires. In India, we work with colleges to identify Inclusion Index reported that 87% of employees companies for women in leadership positions, increase in HP employees in this program, candidates for our Eklavya program, which experience an inclusive work environment at HP. with women in 32.5% of the company’s director- and 50% of graduates have been promoted to offers interns on-the-job training and coaches 7 management at HP or moved into new or expanded employees in interacting and communicating with level and above positions, up from 32% in 2020. roles. Thirty-three HP leaders are attending the people with disabilities. In Brazil, our disAbilities 48 2021 HP Sustainable Impact Report www.hp.com/sustainableimpact
Contents Sustainable Impact Footprint Integrity and human rights Supply chain responsibility Operations Products and solutions Appendix Impact Network focuses on education and We partner with historically Black colleges awareness at the site and in the community, and universities (HBCUs) to increase the Employee engagement Employee survey results* including connecting with a local nonprofit to representation of Black/African American Listening and communication drive our Sustainable Impact provide screen readers to the visually impaired. engineers in the high-tech workforce. The annual engagement approach across three focus areas: percentage of employees HP HBCU Business Challenge, in partnership with In our communities the National HBCU Business Deans Roundtable, • Develop our people: Support digital literacy tasks students with tackling critical business and personal growth, and recruit, retain, and 100% We also strive to advance DEI in the communities problems while gaining valuable industry develop key talent. where we live and work. We continue to engage experience. The 2021 event focused on immersive with leading industry organizations and technologies, and students were asked to • Strengthen our culture: Building on our values, 90% conferences that promote women and minority, use virtual reality technology to create a new drive a customer-first culture, promote key veteran, and LGBTQ+ representation in technology. service or solution. Sixteen schools participated, leadership behaviors, and provide a great 80% This includes the National HBCU Business Deans including the winning team from South Carolina onboarding experience. Roundtable, National Society of Black Engineers, State University. 2019 2020 2021 Society of Hispanic Professional Engineers, • Shape the employee experience: Deliver a National Association of Multicultural Engineering In 2021, HP launched the HBCU Technology people-centered, consistent, HP Way-aligned HP is socially and environmentally responsible employee experience that supports our * Program Advocates Inc., Society of Women Conference and partnered with Microsoft on a Data refers to the percentage of employee survey respondents mobility, digital transformation, and customer- who strongly agreed or agreed with the statement (2019 VIA and Engineers, and European Women in Tech. Bot-a-thon as part of the Future of Work Academy. focused initiatives. 2020–2021 Quick Clicks). More than 1,200 students and staff from 70 We support the Human Rights Campaign’s HBCUs joined the virtual conference and over We regularly collect feedback from employees to Business Coalition for the Equality Act, related 150 students from 29 HBCUs participated in the better understand and improve their experiences 2021 VOICE INSIGHT ACTION to LGBTQ+ workplace rights, as well as the UN Bot-a-thon, which was focused on developing and identify opportunities to continually strengthen Human Rights Office Standards of Conduct automation use-cases to improve the student our culture. In 2021, 95% of employees participated SURVEY OF HP EMPLOYEES for Business. experience at their own institutions. in our annual VIA employee engagement survey. Highlights: HP works to inspire more women and people from We prioritize DEI within our supply chain, and HP has maintained employee engagement • 85% are excited about the future minorities to consider STEM (science, technology, encourage our suppliers and business partners to throughout the pandemic. Overall, 81% of of HP (up five percentage points engineering, and math) education and careers. do the same. See Supplier diversity for more detail. participants had a favorable view of the employee from 2020). For example, we continue our collaboration experience in 2021, compared to 82% in 2020. HP • 84% believe that HP actively supports with UN Women and our partnerships with continues to be certified as a Great Place to Work, their learning and development (up organizations such as Girl Rising, Girls Who Code, with our rating remaining constant in 2021 blackcomputeHER, Black Girls Code, and the compared to the prior year. See also Recognition. one percentage point). YWCA’s Curated Pathways to Innovation. • 87% receive feedback throughout the year that supports performance improvement (up two percentage points). 49 2021 HP Sustainable Impact Report www.hp.com/sustainableimpact
Contents Sustainable Impact Footprint Integrity and human rights Supply chain responsibility Operations Products and solutions Appendix Employee development In 2021, approximately 99% of employees Leadership development from senior sponsors. HP also sponsored leaders participated in learning and development, and and talent to participate in external development programs, on average, spent an estimated 34 hours8 such as the ITSMF and the McKinsey Black Human capital development underpins our efforts participating in these activities during the year. We have a rich leadership curriculum, designed Leadership Academy. to transform and grow HP. Our employees’ talent, for managers at all organizational levels. diversity, and drive fuel HP, and we prioritize The 2021 VIA survey highlighted that 84% of Leadership programs provide self-directed Technology and digital skills investment in career growth. We are passionate employees feel that HP actively supports their learning, coaching, and experiential workshops about supporting an inclusive culture and learning and development. It also showed that enabling shared learning and networking. We invest in technical and digital skill capabilities practicing a growth mindset to unlock business 79% of employees believe their career goals The New Manager Journey, a 12-month virtual across HP to fuel our future productivity, product innovation and opportunities. Our ongoing can be met at HP. During the year, 35% of job program, is delivered to all newly appointed development, and technology innovation success depends on enabling our diverse vacancies were filled internally. people managers. We have also created the strategies, in support of our company’s workforce of skilled employees and maintaining Senior Leader Meeting Connect program to transformation strategy robust leadership pipelines. We believe that We equip managers to support and coach develop global business leadership insights and a strong professional development program their teams, and in 2021, we launched a new support learning from external best practices. In 2021, we continued our focus on HP’s digital provides employees with the opportunity to build talent development approach to help all people In addition, we continue to improve our diversity literacy campaign, Speak Digital, to increase world-leading expertise, while enabling HP to managers create personalized development hiring practices. employees’ knowledge of digital technologies meet emerging customer needs. plans for each team member. These plans and emerging trends in customer experience and focus on skill advancement, new experiential Our executive leadership team places particular innovation. This included delivering the HP Digital Personalized development and opportunities, and readiness for future roles. focus on developing the executive leadership Explorer series, which aims to deepen insights career pathways pipeline through targeted talent strategies, about how to apply digital skills in process and HP’s Power Your Possible platform helps including external assessments of leadership product design. We also launched programs We encourage continuous learning to help employees identify learning that will support their candidates, executive coaching, job rotations, designed to increase knowledge of data analytics support career development. Employees career plans, while the HP Degree Assistance and experiential leadership development and robotic process automation. have access to a wide range of development Program provides funding to more than 500 assignments. opportunities, including virtual, social, self- employees worldwide each year, investing in HP has more than 18,000 technical employees directed, mentoring, coaching, face-to-face their careers through higher education. To We also invest in emerging and underrepresented who work across a wide range of digital, (when safely permissible) and external programs. complement our development portfolios, we also leadership talent through formal programs, information, and physical sciences. We support We offer a variety of collaborative learning provide opportunities to attend conferences mentoring, and sponsorship. Our programs their continuous development, including through experiences, connection to a network of subject and seminars, and acquire professional focus on team development, new business HP’s Affinity Groups and Virtual Communities matter experts, and a social learning platform memberships, accreditation, and certifications. models, and opportunities to deepen inclusion (AGVC) platform, which connects technologists that enables employees to integrate development and growth mindset practices. In 2021, 259 according to technical capabilities and common into their daily routines. leaders participated in the HP Fast Forward and interests. Across over 30 communities and a Catalyst programs. These 12-month experiences range of topics, the AGVC platform provides strengthen leadership capabilities through classroom and virtual learning, practical projects, monthly peer mentoring, coaching, and guidance and opportunities to solve business challenges. 50 2021 HP Sustainable Impact Report www.hp.com/sustainableimpact
Contents Sustainable Impact Footprint Integrity and human rights Supply chain responsibility Operations Products and solutions Appendix We also deliver career growth guidance through Compensation and benefits Pay equity Executive compensation the Technical Career Path and Engineering We believe people should be paid equitably for The HR and Compensation Committee Program Management Career Path, which include HP offers a comprehensive Total Rewards what they do and how they do it, regardless discharges the HP Board of Directors’ mentoring and leadership opportunities. package that is both performance based and of their gender, race, or other personal responsibilities related to the compensation In the digital era, we have retained and expanded market competitive. Total Rewards includes characteristics. To deliver on that commitment, of our executives and directors and provides the HP concept of the “next bench”—close salaries, bonuses, incentive programs, and we benchmark and set pay ranges based on general oversight of our compensation structure, collaboration with neighboring colleagues—to a range of benefits designed to meet our relevant market data, and consider factors including our equity compensation plans and engage with and respect ideas from colleagues employees’ diverse needs while enhancing their such as an employee’s role, experience, and benefits programs. See page 26 of the HP 2022 across the business. Find out more in The Evolving wellbeing and that of their families. performance. We also regularly review our Proxy Statement for detail. Way (page 88). We have also developed a model compensation practices, in terms of both our for creating technical communities across HP Valuing and rewarding employees drives higher overall workforce and our individual employees, In accordance with U.S. Securities and Exchange that will help us meet the demands of cyber- engagement and better performance and helps to make sure our pay is fair and equitable. Commission (SEC) rules, we recently reported physical systems. Learn more. us attract and retain top talent. Compensation our CEO pay ratio for FY21. Our CEO’s annual total and benefits are reviewed periodically for For the past five years, HP has reviewed compensation for FY21 was US$20,733,806. Our Performance management market competitiveness. employees’ compensation with the support median employee’s annual total compensation of independent third-party experts to ensure was US$67,667, resulting in a CEO pay ratio of and feedback Our global wellness program is designed to consistent pay practices. 306:1. For more detail, see page 71 of the HP 2022 HP has a strong feedback-based culture and enhance physical health, financial wellness, and Proxy Statement. approach to performance management, with life balance for all of our employees around the HP expanded its annual pay equity assessment 99% of eligible employees receiving annual world. Other benefit programs vary by country to in fiscal year 2021—evaluating the nine countries multidimensional and objective-based reflect local market practice and employee needs. with our largest employee populations, which Health and safety performance evaluations. Employees participate Depending on location, these may include: represent 72% of our global workforce. The in regular feedback and development planning independent analysis determined there were no We strive to keep our employees safe and healthy • Retirement and savings plans systemic issues. Any areas of potential concern, so they can do their best work. Our environmental, conversations with their managers, and the 2021 • Healthcare benefits considering what we would expect employees to health, and safety (EHS) leadership team uses VIA survey highlighted that 87% of employees be paid when evaluating their skills, qualifications, our global injury and illness reporting system believe they receive feedback throughout the year • Insurance protections (e.g., life and disability) and experience, were reviewed and addressed as to assess worldwide and regional trends as that enables them to improve their performance. 9 part of our off-cycle compensation process. • Time-off programs (vacation, holidays, a part of quarterly reviews. We have internal 10 parental leaves, injury/illness, etc.) targets to keep lost workday case rates below • Discount programs 0.5 and recordable incidence rates under 1.0 (see definitions of these rates), and our managers • Flexible work arrangements assess progress against those targets annually. • Stock purchase plan Supervisors of employees injured at work • Other benefits are required to complete injury and illness 51 2021 HP Sustainable Impact Report www.hp.com/sustainableimpact
Contents Sustainable Impact Footprint Integrity and human rights Supply chain responsibility Operations Products and solutions Appendix investigations for all injury incidents and work Throughout the pandemic, a top priority of wellbeing. These included sessions that focused Financial wellness with EHS points of contact to assess serious or HP’s has been the health, safety, and wellbeing on understanding biometric markers and the • Nearly 3,000 employees in the United States complex cases. of employees and their families. Our cross- impact of sugar on our diet, and ongoing virtual participated in our $ave Beyond financial functional COVID-19 program management office office hours with our medical director and other wellness month activities. During August 2021, In 2021, we achieved a global lost workday case meets regularly to review the latest data from HP doctors providing validated COVID-19 information. rate of 0.06 and a recordable incidence rate of business and site leaders, identify and address employees attended weekly question and 11 Our Well Beyond wellbeing program continued answer sessions with investment experts from 0.13, compared to 2020 average rates (the most emerging risks, and formulate HP’s response to recent data available) of 0.1 and 0.4, respectively, actions taken by governments and public policy to encourage healthy behaviors through regular Fidelity more than 1,300 times. in the U.S. Computer and Peripheral Equipment organizations. We’ve put in place global policies communications, voluntary progress tracking Manufacturing industry (NAICS Code 33411). and protocols based on guidance from healthcare through the Virgin Pulse app, fun challenges, and Life balance experts and public health leaders, and regularly incentives. Depending on location, U.S. employees • We built on our 2020 “Take Time for You” Our manufacturing facilities continue to review and update them to reflect the best, most and spouses/domestic partners can each receive represent our most significant health and current information available. incentives of up to US$550 a year for activities campaign to integrate mental health into all safety risks, due to higher potential exposure such as completing a wellness assessment and aspects of our wellbeing programming. We to chemicals and machinery-related hazards. See more information about our EHS tracking healthy activities. As of October 2021, also hosted a webinar during Mental Health Reducing and effectively managing risks at management system. 78% of eligible employees in the United States, Awareness Month and launched a mental these facilities remains a focus, and injury and 59% worldwide, had enrolled in the Well health-focused e-newsletter to spotlight our rates continue to be low. We have implemented See Data. Beyond program. resources in this area. programs to address common risks such as • Recognizing employees’ continued caregiving ergonomic issues, slips, and falls. We also Wellbeing Physical health challenges, we offered webinars on resiliency address the safety of employees when they are and parenting, along with small group coaching working beyond our facilities, such as customer The physical health, financial wellbeing, and life • As part of our Global Wellness Challenge (GWC) for more individualized support. service agents visiting customer sites, for whom balance of our employees is vital to HP’s success. held in April and May, 61% of our employees, we develop training and related testing on issues In 2021, we continued to deliver programs that including 79% of our U.S. workforce, enrolled such as vehicle and back safety. To support focused on the needs of our workforce during in the Virgin Pulse platform, through which we employees working remotely since the COVID-19 the unprecedented challenges presented by the provide access to digital coaching and a wide pandemic, we have provided ergonomic training COVID-19 pandemic. range of health and wellbeing content. sessions, remote reviews for ergonomically • During the GWC, we recorded 6.7 billion appropriate offices, equipment stipends, and Through our wellbeing vendors and in conjunction employee steps through our Well Beyond other assistance. with HP Spirit, we offered an array of programs, platform, equivalent to nearly 10,200 daily steps activities, and virtual gatherings, as well as per participant. enhanced benefits and resources to support 52 2021 HP Sustainable Impact Report www.hp.com/sustainableimpact
Contents Sustainable Impact Footprint Integrity and human rights Supply chain responsibility Operations Products and solutions Appendix Our facilities At our 150 sites in 59 countries around the Every year, we perform risk assessments at all of All new build-outs target the LEED v4 Gold injury occurs, we identify the root cause and world, we are taking action to reduce our GHG our chemical-intensive and manufacturing sites. Standard and/or a local equivalent (such as implement solutions to address it. Employees emissions, energy and water withdrawal, In 2021, we conducted on-site audits wherever BREEAM). In support of these objectives, HP has receive guidance to identify and report hazards, and waste generation. While GHG emissions possible. Where the pandemic prevented in- developed the HP Green and Smart Construction and channels exist for them to report hazards associated with HP’s operations represent just person visits, we conducted remote audits or Playbook for project managers, which provides outside of their immediate control, for action by 1% of our overall carbon footprint, this is the postponed them until 2022. Management reviews guidance on key principles such as energy facility teams. We ensure our employees feel area where we have the greatest control and the findings of all audits, and any deficiencies are use, indoor air quality, water withdrawal, and able to remove themselves from situations they influence, and therefore the greatest ability to identified and action plans are developed. waste recycling. We also factor environmental believe are unsafe. make immediate impact. During 2021, we reduced considerations into decisions to lease new sites, our Scope 1 and Scope 2 GHG emissions 7% When feasible, we pursue environmental asking prospective landlords, through the HP To continually develop our global EHS compared to 2020. By modeling sustainable management and green building certifications Energy and Sustainability Survey, about features management system, we engage with and seek operations, we also demonstrate our values in at HP-owned and leased facilities worldwide. such as LEED certification, renewable energy, input from safety professionals, management action, and highlight industry-leading practices as As of the end of 2021, 22 facilities, including electric vehicle (EV) charging stations, and teams, and partners across HP. All locations must an example to employees, customers, suppliers, all HP manufacturing sites, were certified to water efficiency. proactively implement company-wide health and visitors, and others. International Organization for Standardization safety standards. These specify that any new (ISO) 14001:2015 (the most recent version), with Sites use our HP EcoChampions Playbook to equipment and chemicals, along with any 17 as part of our global ISO 14001 certificate. support training and engagement on sustainable changes to the work environment, are reviewed Environmental, health, and Thirteen facilities, including 57% of HP operations. The Playbook includes modules with for safety and environmental issues, and any safety management manufacturing sites, were certified to ISO 45001: step-by-step guidelines in areas such as energy issues addressed accordingly. 2018 for occupational health and safety. and water efficiency and waste reduction. HP owns and leases facilities around the world. As of October 31, 2021: To drive improvement in health and safety, Our EHS Policy (now also available in Chinese our EHS management system aligns with the ABOUT OUR OPERATIONAL DATA and Korean) and EHS management system • Fifteen sites globally had achieved Leadership American National Standards Institute (ANSI) (which apply to all HP employees and contractors in Energy and Environmental Design (LEED®) Z10 standard and the ISO 14001 standard. We All environmental data reported in this section and all operational sites) help us to manage our certifications for buildings, including 12 at the hire and train safety professionals to implement refers to HP operations through October 31, 2021. environmental impact, improve worker safety, Gold or above level.1 procedures for reviewing new and ongoing At that time, we owned or leased 150 sites in verify progress toward our goals and adherence workplace health and safety hazards, and 59 countries. From invoices and other documents, • Three sites had achieved BREEAM certifications HP directly tracked data for 2021 representing to internal standards, and document compliance for building, including one at the Excellent level.2 incorporate newly identified hazards periodically with all applicable laws and regulations. We into our EHS management system. 95% of total electricity use, 90% of total natural investigate all allegations that our facilities are • Two locations had achieved SITES certification gas use, 92% of total water withdrawal, 90% failing to comply with applicable laws and take for sustainable landscape. Supervisors are required to ensure that all HP of nonhazardous waste, and 100% of total corrective action when needed. • One site had achieved TRUE certification for work-related health and safety incidents are hazardous waste. waste diversion. investigated and issues addressed. When an 53 2021 HP Sustainable Impact Report www.hp.com/sustainableimpact
Contents Sustainable Impact Footprint Integrity and human rights Supply chain responsibility Operations Products and solutions Appendix All HP facilities have assigned technical EHS • Earth Month: More than 1,600 employees Scope 1 and Scope 2 GHG emissions personnel, and our global EHS team provides pledged to take climate action by reducing 2025 GOAL guidance and oversight. Joint management food waste, adopting a plant-rich diet, and from operations worker health and safety committees exist in using energy-efficient appliances. Employees Reduce Scope 1 and Scope 2 GHG emissions tonnes CO e some locations, and we regularly discuss relevant attended a plant-rich diet webinar and cooking from global operations by 60% by 2025, 2 compared to 20154 policies, processes, and regulatory compliance lesson, as well as a climate action webinar in 7 *e u 250,000 n with employees. collaboration with Project Drawdown. e PROGRESS IN 2021 6 v e t r HP’s global operations produced 159,500 tonnes 200,000 5 e In 2021, more than 1,690 employees and agency of Scope 1 and Scope 2 CO e emissions f n 3 2 n o contractors took part in 107 instructor-led 4 o i 150,000 l Greenhouse gas emissions l courses, and over 42,000 web-based EHS training i 3 $ m 100,000 S courses were completed. Our training includes Most of our GHG emissions from operations are U information about general workplace issues, as 2 e/2 related to the energy used to power our facilities. 59% 50,000 O well as targeted information for specific roles. 1 s C To save money, drive progress toward our goals, e less than our 2015 baseline n 0 0 n and reduce our climate impacts, we: to Promoting a culture of 2019 2020 2021 environmental responsibility • Aggressively reduce energy consumption Americas through optimization and efficiency projects. due to partial site re-occupancy and increased Europe, MIddle East, and Africa Our employees worldwide make a vital contribution • Increase on-site generation of renewable activity at manufacturing locations. However, Asia Pacific and Japan to improving our environmental performance, we still achieved a 7% year-over-year reduction GHG emissions intensity (tonnes CO e/US$ million of net revenue)* power. in absolute GHG emissions due to reduced fleet 2 and employee engagement initiatives enable * HP’s global workforce to directly support our • Procure off-site renewable power, including usage and increased purchases of renewable Historical emissions-intensity values were calculated using HP’s renewable energy credits (RECs), utility supplier electricity and attributes. Prior to the partial site annual revenue as characterized in financial reporting and Scope Sustainable Impact goals and vision. For example, 1 and Scope 2 GHG emissions. during 2021: green power options, and power purchase re-occupancy, we maintained our broadened agreements (PPAs). temperature set points, reduced lighting • October EcoChallenge with Ecochallenge.org: schedules, and manually shut off equipment Energy efficiency More than 1,000 HP employees from 85 teams Our global operations produced 159,500 tonnes where it was not required. Later in the year, we Energy use is a significant operating expense and 44 countries took part in this three-week of Scope 1 and Scope 2 CO2e emissions during also implemented multiple capital-funded energy- for HP and the main driver of our climate impact personal sustainability challenge, with four HP 2021. This 7% decrease compared to 2020 drives conservation projects. Learn more. from operations. Our operations consumed sites earning top-10 spots. progress toward our goal of reaching carbon 697,058 MWh of energy in 2021. Excluding energy neutrality in HP operations by 2025. See our full carbon footprint for 2019–2021, HP from our transportation fleet (which HP did not Carbon accounting manual, and HP CDP Climate report prior to 2021), energy use in operations GHG emissions intensity equaled 2.5 tonnes of Change response. COe per million U.S. dollars of net revenue in increased by 3% compared with 2020, due to 2 partial site re-occupancy and increased activity 2021, a 17% reduction from 2020. HP operations consumed more energy in 2021 than in 2020 at our manufacturing sites. Global electricity use 54 2021 HP Sustainable Impact Report www.hp.com/sustainableimpact
Contents Sustainable Impact Footprint Integrity and human rights Supply chain responsibility Operations Products and solutions Appendix increased by 2% during that period. Excluding Later in 2021, we implemented several capital- Renewable energy Auto fleet, business travel, energy use from our transportation fleet, energy funded energy-conservation projects, which By 2025, we aim to use 100% renewable electricity and commuting intensity decreased 8% in 2021 compared included chiller plant optimization, LED lighting to power our global operations. In 2021, we procured with 2020. upgrades, uninterruptible power supply (UPS) Our goal is to reduce GHG emissions from upgrades, air conditioning (HVAC) system and generated 264,054 MWh of renewable HP-owned or leased auto fleet vehicles by 25% Prior to the partial site re-occupancy, our replacements, site retro-commissioning, and electricity globally (83.4% wind, 5.0% solar, 9.5% by 2025, compared to 2015. During 2021, our non-critical buildings were closed due to installation of upgraded controllers for a large hydro, and 2.1% unknown). Renewables accounted company fleet accounted for 20,100 tonnes of COVID-19, and access restrictions prevented site compressed air system. We also confirmed for 54% of our global electricity consumption, COe emissions, down 16% compared to 2020 us from implementing capital-funded energy- compared to 51% in 2020. Sources of renewable 2 that sites were compliant with the HP occupied and 39% less than in 2015. By 2030, our goal is to conservation projects. During that closure, our temperature set points upon reoccupation. electricity in 2021 included RECs, GOs (guarantees achieve a 100% EV company fleet. We started our facility teams ensured these buildings were set of origin), and I-RECs (international RECs) (87.3%), first EV fleet pilots in the Netherlands in October for unoccupancy by maintaining our broadened Learn more about how we are reducing GHG direct purchases (11.2%), and renewable energy 2020 and Belgium in January 2021, and introduced temperature set points, reducing our lighting emissions across our value chain in Supply generated on-site and on-site PPAs (1.5%).5 a hybrid as our default fleet vehicle in the United schedules, and manually shutting off equipment chain responsibility: Environmental impact and Through these purchases, we once again States. By the end of 2021, 2% of our fleet was EVs when not needed. Products and solutions. achieved our objective to use 100% renewable and 12% was hybrid vehicles. electricity in the United States and helped to advance the global market for renewables. To decrease emissions associated with business travel, we provide employees with low-impact Energy use from operations 2025 GOAL Building on previous renewable energy initiatives, travel choices through collaboration with travel MWh such as the solar-covered roof at our Palo Alto providers, planning tools, and transportation Use 100% renewable electricity in our headquarters, in 2021 we signed a large on-site alternatives. In 2021, we joined the Eco-Skies 2019 2020 2021 operations by 2025 solar PPA for our Barcelona, Spain, facility. This Alliance program to support the use of Stationary combustion 132,315 119,387 126,484 will provide approximately 2,174 MWh per year, sustainable aviation fuel. (natural gas and diesel) PROGRESS IN 2021 equivalent to 12.2% of the site’s annual electricity Electricity* 526,835 482,119 492,712 HP’s global operations procured and generated use. HP also signed an on-site solar PPA during We have committed to installing EV infrastructure Transportation fleet** 74,826 264,054 MWh of renewable electricity and 2021 to provide parking canopies at a site at all feasible sites worldwide by 2030. In 2021, attributes, equivalent to in Singapore. we offered EV infrastructure at 45% of 86 target District cooling and heating 4,224 3,395 3,036 sites, including 18 new charging stations installed (purchased) during the year. Wherever feasible, we require Energy intensity (MWh/US$ 11.3 10.7 11.0 new building constructions and leases to include million of net revenue)*** 54% EV infrastructure. * Includes purchased electricity and electricity generated on-site. of our global electricity consumption #18 ** This data was first reported for 2021. Includes gasoline See data related to business travel and and diesel. on the Green Power Partnership Top 30 employee commuting. *** Historical energy-intensity values were calculated using HP’s Tech & Telecom list (as of April 2022) annual revenue as characterized in financial reporting and direct and indirect energy use. 55 2021 HP Sustainable Impact Report www.hp.com/sustainableimpact
Contents Sustainable Impact Footprint Integrity and human rights Supply chain responsibility Operations Products and solutions Appendix a chronically leaking main pipe at our Barcelona, Water Spain, site in 2020. Water withdrawal intensity per Water withdrawal* Water withdrawal by source, 2021* million U.S. dollars of net revenue decreased by cubic meters percentage of total Water withdrawal associated with our operations 12% between 2020 and 2021. makes up 2% of our total water footprint. This is 4,000,000 80 2021 roughly evenly split between direct withdrawal as To decrease and recycle water used at our e Municipal water 87.3% u n described in this section (mainly for use in facilities, we employ capital practices, sustainable e v Wastewater from another organization** 12.1% 3,000,000 60 e buildings, cooling, landscaping, and production of landscaping, infrastructure upgrades, leak t r e high-purity water for manufacturing) and indirect monitoring and detection, and greywater reuse. At f n Well water*** 0.5% n o o withdrawal associated with generation of the i * some locations, we also reduce our dependency l Direct use of surface water is insignificant and not included in 2,000,000 40 l i data reported. Rainwater is about 0.03% of total. electricity we use in our facilities. on potable water by utilizing alternative sources, $ m S ** U NEWater: ultra-purified wastewater used in manufacturing including rainwater and reclaimed water. / s operations in Singapore. In 2021, we withdrew 2,556,000 cubic meters of 1,000,000 20 r te *** This category includes groundwater. water overall, 2% less than in 2020. This decrease We use the World Resources Institute Aqueduct e c m i was primarily due to the discovery and repair of b Water Risk Atlas tool to assess the risk of sites u 0 0 c • Singapore: Implementing a project at a facility and prioritize reductions in water-stressed 2019 2020 2021 locations. Using this tool, we assessed 171 HP to recycle water for use in cooling towers, facilities as part of our risk modeling for 2021. reducing demand on treated water supplied 2025 GOAL Fifty of the facilities assessed (29% of the total) Americas by the municipality, saves about 64,800 cubic Europe, Middle East, and Africa meters annually. Reduce potable water withdrawal in global fall within the high-risk category for water stress. Asia Pacific and Japan operations by 35% by 2025, compared to 2015, Those locations withdrew 245,000 cubic meters Water withdrawal intensity See detailed water data for 2019–2021, the HP focusing on high-risk sites of water during 2021, 9% of our global total and (cubic meters/US$ million of net revenue) down 17% from the prior year. Water accounting manual, and our CDP Water PROGRESS IN 2021 * Historical withdrawal-intensity values were calculated using Security submission. HP’s annual revenue as characterized in financial reporting and HP withdrew 2,245,000 cubic meters of potable HP recycled or reused 310,000 cubic meters of water withdrawal. water across global operations in 2021, water6 globally during 2021 for landscaping, indoor Wastewater plumbing fixtures, and as process water. This was Wastewater is not a significant environmental risk equivalent to 11% of total water withdrawal. The Water-saving projects completed during company also captured and used 1,000 cubic 2021 included: at HP’s operations. Our imaging and printing 30% meters of rainwater for cooling towers during product manufacturing facilities generate the year. • Barcelona, Spain, and Kiryat Gat and Caesarea, process effluents that are pre-treated, strictly less than in 2015, and focused reduction Israel: Identifying and remediating significant monitored, and discharged under government- efforts on high-risk sites (see water-saving leaks at facilities, discovered due to our issued permits. We implement procedures to projects completed during 2021, at right) expansion of leak detection in 2020, saves prevent unauthorized discharges of chemicals to approximately 63,000 cubic meters of water on our facility wastewater systems and ensure that an annualized basis. 56 2021 HP Sustainable Impact Report www.hp.com/sustainableimpact
Contents Sustainable Impact Footprint Integrity and human rights Supply chain responsibility Operations Products and solutions Appendix these sites do not discharge untreated Original HP Ink Cartridges used by customers and Composition of nonhazardous waste wastewater directly to surface water or 2025 GOAL in our offices can be recycled and are considered to groundwater. nonhazardous in many of our major markets. and used electronic equipment Reach zero waste in HP operations by 20258 We generated 7,060 tonnes of hazardous waste recovered from HP operations, 2021* Waste PROGRESS IN 2021 in 2021. percentage of total In 2021, we achieved an See detailed waste data for 2019–2021. 22% Although our facilities do not generate large 9% Paer amounts of waste, we employ a global policy of See HP’s latest disclosure to the U.S. Environmental Waste Protection Agency Toxics Release Inventory. to energy “reduce, reuse, and recycle” that supports our 86.4% company-wide shift toward a circular economy. HP is conducting environmental investigations 11% HP generated 13,900 tonnes of nonhazardous landfill diversion rate globally 14% % Pallets and/or remediation at several current or former Landfill 7 d waste in 2021, as well as 500 tonnes of operating sites. Some historic manufacturing le used electronic equipment recovered from yc activities of HP and predecessor companies used ec HP operations. sites with the largest waste volumes. Following r r chemicals now known to have contaminated soil ed o audits, HP teams at our Corvallis, Oregon, and and groundwater. We are also involved in the es In 2021, we achieved an 86.4% landfill diversion Kiryat Gat, Israel, sites have begun implementing 11% 23% cleanup of sites affected by the improper Other Packaging rate globally, and we use disposal only as a last recommendations—such as expanding disposal and recycling of HP’s waste by third materials resort. The COVID-19 pandemic has adversely composting, eliminating disposables such as 4% 6% parties. HP proactively works to implement a Used electronic Metals impacted waste management processes, which cups and utensils, and improving waste sorting— eiment lowered our global diversion rate from 91.8% that are expected to reduce waste to landfill by variety of remediation activities in cooperation recoered from with regulatory agencies. P oerations in 2019. We reuse electronic equipment when 182 tonnes annually. possible or recycle it responsibly through the * HP sites report nonhazardous waste volumes and disposition same programs we offer customers. See Product The main hazardous waste we generate is based on information provided by our waste disposal vendors. repair, reuse, and recycling. liquid from ink-manufacturing facilities. These For sites unable to directly track nonhazardous waste, we estimate volumes and disposition using intensity factors based manufacturing sites prioritize waste management on similar operations. In 2021, to help us achieve site-specific Zero options with low environmental impacts and Waste certification, we began conducting in-depth only use disposal as a last resort. Although ink audits of our waste streams, beginning with manufacturing is a source of hazardous waste, 57 2021 HP Sustainable Impact Report www.hp.com/sustainableimpact
Contents Sustainable Impact Footprint Integrity and human rights Supply chain responsibility Operations Products and solutions Appendix Community giving and volunteerism We work to accelerate digital equity, connect communities to greater economic and social Focus areas* 2025 GOAL opportunity, and bring technology-related learning experiences to underrepresented TECHNOLOGY-ENABLED ENVIRONMENTAL INCLUSION AND Contribute US$100 million in HP Foundation 2 and underserved communities worldwide. By EDUCATION AND STEWARDSHIP, RESILIENCE, EMPOWERMENT FOR and employee community giving by 2025 leveraging our technology, scope, and scale, SKILLS-BUILDING AND DISASTER RECOVERY UNDERREPRESENTED AND (cumulative since the beginning of 2016) together with strategic local and international MARGINALIZED PEOPLE PROGRESS THROUGH 2021 partnerships, we create positive impact in Reached the communities where we live, work, and do business. Corporate contributions, the 1 HP Foundation, and employee giving and volunteerism are central to our approach. See US$73.4 HP’s Global Charitable Contributions Policy. MILLION In 2021, HP continued to provide relief and support in HP Foundation and employee for those affected by COVID-19, while our * SDG 3, Good health and well-being, was a significant focus in 2021 as well, due to the COVID-19 pandemic. community giving employees participated in numerous virtual volunteering opportunities to help those in need. How we supported our communities in 2021 HP donated US$3.08 million in products during the year (see box on next page), and the HP CORPORATE GIVING HP FOUNDATION CASH EMPLOYEE GIVING EMPLOYEE HP Foundation programs Foundation continued uplifting communities CONTRIBUTIONS VOLUNTEERISM through the HP LIFE (Learning Initiative for HP LIFE: Learning and employment Entrepreneurs) program to reach students around US$13.52 million US$6.96 million US$2.65 million 136,000 hours opportunities for aspiring the world who have had their educations in cash contributions contributed by 9,200 entrepreneurs interrupted. See also HP’s response to COVID-19 and products employees and Education. To help accelerate digital equity and build skills for the future, the HP Foundation provides core business and IT skills training free of charge for start-ups, students, and small businesses through HP LIFE. The program offers global access to more than 30 free courses in eight languages, available online, offline, and in person, when it’s safe to do so. 58 2021 HP Sustainable Impact Report www.hp.com/sustainableimpact
Contents Sustainable Impact Footprint Integrity and human rights Supply chain responsibility Operations Products and solutions Appendix at the Fundação CASA juvenile detention center. 1,200 high schools and 200 universities. Students PRODUCT DONATIONS TO HELP BRIDGE THE EDUCATION DIVIDE AND HP volunteers worked at the girls’ unit, aiming to enrolled in JA entrepreneurship competitions SUPPORT COVID-19 RESPONSE improve the girls’ emotional wellbeing and equip have access to online mentoring sessions with them with life skills to make better choices upon HP volunteers, receiving feedback and support on In 2021, HP donated US$3.08 million in laptops, printers, displays, and paper to support return to their communities. The team delivered business plans and pilot projects. education, small and mid-sized businesses, and healthcare entities in underprivileged the HP LIFE courses Social Entrepreneurship, and underserved communities around the world. For example, in support of our goal to Success Mindset, 3D Printing, Design Thinking, BeChangeMaker: Empowering social accelerate digital equity, we provided technology, HP Instant Ink subscriptions, learning Strategic Planning, Growth Engine for Your entrepreneurs globally packets, and other support to underserved students and families in New York, in Business, and Starting a Small Business, as well In partnership with WorldSkills International, HP partnership with nonprofit Parents Supporting Parents. as classes on emotional intelligence, diversity LIFE hosts an annual BeChangeMaker business and inclusion, and sustainability, to 168 girls via pitch competition. Teams use HP LIFE courses to interactive virtual sessions. Learn more. generate social venture ideas related to the UN Sustainable Development Goals, create a viable In 2021, 163,000 new users enrolled in HP LIFE, Supporting learners globally Expanding access to learning in Mexico business model, and pitch their concept to HP 5% more than in 2020. We also launched five In 2021, we launched two new HP LIFE centers employees who serve as mentors and judges. In new mobile-friendly courses. All HP LIFE courses HP LIFE and the power of volunteering in Brazil in Mexico, building on our collaboration with the 2021, HP and WorldSkills hosted: are compliant with Web Content Accessibility In 2021, 36 employee volunteers from HP’s São UN Women’s Second Chance Education and Guidelines 2.1. Paulo and Porto Alegre sites in Brazil collaborated Vocational Learning program, the BHP Foundation, • BeChangeMaker Global for the fifth year, with the Instituto Mundo Aflora to run programs and Intel. The centers provide digital classrooms with the top six teams chosen from nearly We partner with world-class organizations with access to free online entrepreneurial learning 400 applications representing more than to expand the impact of HP LIFE. courses for women. Although impacted by 60 countries. The winning team—VaxiGlobal— See HP LIFE success stories. COVID-19, this partnership aims to empower up pitched an idea to modernize the vaccination 2030 GOAL to 6,000 women from launch in 2019 through June process and documentation to fight COVID-19 2022, having reached more than 1,300 by the end in Africa. Enroll 1.5 million HP LIFE users between of 2021. • BeChangeMaker Africa for the second year, HP is committed to accelerating digital equity 2016 and 2030 selecting the top six entrants from nearly 500 for 150 million people by 2030, since 2021. Learn PROGRESS THROUGH 2021 Bringing HP LIFE to 10 countries with Junior teams representing over 40 countries. Team how our products, solutions and services, global Achievement (JA) Worldwide AfriCity, from South Africa, took first place, with partnerships and networks, and programs are Enrolled an idea to work with unemployed youth and accelerating digital equity. In 2021, HP expanded our partnership with JA Worldwide to Greece, Italy, Indonesia, the postgrad students in Africa to collect market Netherlands, Russia, Spain, and Turkey, building data and identify macro city trends to support 533,000 on the existing activities in Bulgaria, Hungary, innovation and economic development in key since 2016 and Romania. JA Romania enrolled more than African cities. 15,000 new users in HP LIFE in 2021, working with 59 2021 HP Sustainable Impact Report www.hp.com/sustainableimpact
Contents Sustainable Impact Footprint Integrity and human rights Supply chain responsibility Operations Products and solutions Appendix Imagine Grants Employee volunteerism 40 Days of Doing Good Through the HP Foundation Imagine Grants, HP In 2021, almost 3,700 employees in 51 countries leaders and country managers allocate cash HP taps into the talents, passions, and participated in HP’s annual 40 Days of Doing Good grants to local nonprofits. In 2021, we fulfilled entrepreneurial spirit of employees to make a campaign. Employees volunteered 26,150 hours, US$1.24 million in Imagine Grants worldwide, to difference in our communities. In 2021, 9,200 supporting 171 projects. In support of advancing enable purchase of technology or technology- employees contributed about 136,000 hours to digital equity, the HP Foundation complemented related education. local volunteer efforts in 58 countries, with a value these efforts with grants totaling US$494,000 to 3 support the work of education- and technology- of US$8.58 million. HP employees are granted four hours paid volunteer time per month. related learning charities nominated by our Disaster recovery employees. For example, 54 HP employees from and resilience Malaysia and other locations in Asia volunteered to support educators who were using technology HP, our employees, and the HP Foundation 2025 GOAL to teach remotely during the COVID-19 pandemic. together provide financial support for Contribute 1.5 million employee volunteering Our volunteers delivered digital skills training communities affected by natural disasters and hours by 2025 (cumulative since the beginning workshops that were attended by 169 teachers. emergencies. In 2021, we supported response of 2016) Learn more. efforts for the Texas winter storm, the earthquake PROGRESS THROUGH 2021 See Data for detailed figures. in Haiti, wildfires across Greece, Tunisia, Turkey and the western United States, flooding in Belgium, Reached Germany, and the Netherlands, and Hurricane Ida in the United States. We also provided COVID-19 relief to Brazil and India and relief to Israel and 692,000 Palestine after bombings in the region. employee volunteering hours We worked with strategic partners, including the American Red Cross, Direct Relief, the Information Technology Disaster Resource Center, and the International Federation of Red Cross and Red Crescent Societies to provide relief to speed recovery and reconnect vital networks. 60 2021 HP Sustainable Impact Report www.hp.com/sustainableimpact
Contents Sustainable Impact Footprint Integrity and human rights Supply chain responsibility Operations Products and solutions Appendix Data Our employees* 2019 2020 2021 2019 2020 2021 World workforce (regular full time and part time) by age group, 2021 30 and under 31–50 51 and over *** Women employees [% of total] U.S. executives, by ethnicity [% of total] By job level Worldwide 36.6% 36.9% 37.3% White 69.8% 65.6% 67.0% Executives* 0.0% 39.1% 60.9% ** Women managers [% of total] All minorities 19.5% 23.4% 24.2% Directors 0.1% 54.7% 45.2% Worldwide 28.7% 29.7% 32.5% Black/African American 2.8% 4.2% 4.1% Managers** 1.4% 71.7% 26.8% Global new hires, by gender [% of total] Hispanic/Latin American 7.0% 6.3% 7.2% Professionals 15.0% 66.9% 18.1% Women 40.2% 35.8% 39.5% Asian 8.8% 11.5% 11.9% Other 40.8% 46.0% 13.2% Men 57.1% 63.3% 56.5% Native American 0.0% 0.5% 0.5% Total 19.0% 62.5% 18.6% Not disclosed/available 2.7% 0.9% 4.1% Hawaiian/Pacific Islander 0.0% 0.0% 0.0% By function Global new hires in technical roles, by gender [% of total] Two or more races 0.9% 1.0% 0.5% Engineering 15.1% 64.9% 20.1% Women 32.3% 27.6% 28.2% Not disclosed/available 4.7% 5.2% 8.7% Sales 10.2% 68.5% 21.3% **** Men 65.6% 71.7% 67.5% U.S. new hires, by ethnicity [% of total] Sales operations 29.4% 62.2% 8.4% Not disclosed/available 2.1% 0.6% 4.3% White 56.6% 59.3% 51.1% Services 19.7% 59.2% 21.1% U.S. employees, by ethnicity [% of total] All minorities 39.4% 37.1% 44.8% Supply chain and operations 29.6% 56.2% 14.2% White 64.7% 63.1% 62.1% Black/African American 4.5% 5.6% 9.2% Other 18.0% 62.7% 19.3% All minorities 27.2% 28.9% 30.8% Hispanic/Latin American 12.8% 7.8% 10.8% Total 19.0% 62.5% 18.6% Black/African American 3.8% 4.0% 4.5% Asian 16.6% 19.4% 19.5% * Based on business unit, this includes up to four levels from the CEO. Hispanic/Latin American 8.7% 9.3% 9.6% Native American 0.8% 0.8% 0.3% ** This refers to people managers below director level. Asian 12.1% 12.9% 13.6% Hawaiian/Pacific Islander 0.3% 0.0% 0.3% Native American 0.5% 0.5% 0.5% Two or more races 4.4% 3.6% 4.7% Employees (regular full time and part time) by region and gender, 2021* Men Women Undeclared/ Total Unknown Hawaiian/Pacific Islander 0.2% 0.1% 0.2% Not disclosed/available 3.9% 3.6% 4.1% Worldwide 31,732 19,069 334 51,135 Two or more races 1.9% 2.1% 2.4% Americas 11,462 6,124 101 17,687 Not disclosed/available 8.1% 8.0% 7.1% Asia Pacific and Japan 13,068 8,280 44 21,392 * Employee data refers to regular full-time and part-time employees. Data is as of October 31 of the year reported. Employees self-identify gender and race. Europe, Middle East, and Africa 7,202 4,665 189 12,056 ** Includes all management categories (supervisors, managers, directors, and executives). * This table does not include 2,817 employees of certain majority-owned, consolidated subsidiaries, for which data was not available. *** As a percentage of U.S. personnel with the title of Executive, formerly called Vice President. **** This data was restated for 2019 and 2020, to improve accuracy. 61 2021 HP Sustainable Impact Report www.hp.com/sustainableimpact
Contents Sustainable Impact Footprint Integrity and human rights Supply chain responsibility Operations Products and solutions Appendix World workforce (regular full time and part time) by gender, 2021 Men Women Unknown Employees by employment type (regular full Women % Men % Undeclared % Total time and part time) and gender, 2021* By job level Full time Executives* 71.6% 28.1% 0.3% Executives** 84 28.2% 213 71.5% 1 0.3% 298 Directors 66.0% 33.8% 0.2% Directors 330 33.7% 646 66.1% 2 0.2% 978 Managers** 70.5% 29.3% 0.2% Managers*** 1,316 29.3% 3,174 70.6% 7 0.2% 4,497 Professionals 62.6% 36.8% 0.7% Professionals 12,811 36.3% 22,207 63.0% 233 0.7% 35,251 Other 55.5% 43.5% 0.9% Other 4,231 43.4% 5,426 55.7% 90 0.9% 9,747 Total 62.1% 37.3% 0.7% Subtotal 18,772 37.0% 31,666 62.4% 333 0.7% 50,771 By function Part time Engineering 77.5% 22.3% 0.2% Executives** 0 0.0% 1 100% 0 0.0% 1 Sales 71.2% 28.0% 0.8% Directors 1 100% 0 0.0% 0 0.0% 1 Sales operations 42.5% 56.3% 1.2% Managers*** 6 66.7% 3 33.3% 0 0.0% 9 Services 67.3% 31.3% 1.4% Professionals 266 81.3% 60 18.3% 1 0.3% 327 Supply chain and operations 51.5% 48.3% 0.2% Other 24 92.3% 2 7.7% 0 0.0% 26 Other 49.8% 49.7% 0.5% Subtotal 297 81.6% 66 18.1% 1 0.3% 364 Total 62.1% 37.3% 0.7% Total 19,069 37.3% 31,732 62.1% 334 0.7% 51,135 * Based on business unit, this includes up to four levels from the CEO. ** * This refers to people managers below director level. This table does not include 2,817 employees of certain majority-owned, consolidated subsidiaries, for which data was not available. ** Based on business unit, this includes up to four levels from the CEO. *** This refers to people managers below director level. See HP’s 2021 EEO-1 Report. Voluntary turnover rate 2021 Men 6.6% Women 5.8% Overall 6.1% Involuntary turnover rate 2021 Men 2.9% Women 2.1% Overall 2.6% 62 2021 HP Sustainable Impact Report www.hp.com/sustainableimpact
Contents Sustainable Impact Footprint Integrity and human rights Supply chain responsibility Operations Products and solutions Appendix Health and safety 2019 2020 2021 Health and safety 2019 2020 2021 Lost workday case rate* Lost time injury severity rate*** Global 0.08 0.06 0.06 Global 2.00 2.10 2.26 Americas 0.15 0.09 0.11 Americas 5.15 5.08 5.82 Europe, Middle East, and Africa 0.06 0.11 0.06 Europe, Middle East, and Africa 0.42 1.55 0.78 Asia Pacific and Japan 0.04 0.00 0.13 Asia Pacific and Japan 0.25 0.12 0.35 Leading causes of lost workdays [% of total] * Lost workday case rate is the number of work-related injuries that result in time away from work per 100 employees and contractors that HP manages working a full year. Rates are calculated globally using OSHA definitions for recordability and OSHA calculation Slips, trips, and falls 16% 9% 23% methodologies. The figures are based on employees working an average of 2,000 hours during a full year. The U.S. average in 2020 for the Automobile accidents 16% 25% 11% Computer and Peripheral Equipment Manufacturing industry (NAICS #33411) was 0.07. Data is for the calendar year. ** Recordable incidence rate is the number of work-related injury cases requiring more than first aid per 100 employees and contractors Struck by/against/cut by 20% 18% 17% that HP manages. Rates are calculated globally using OSHA definitions for recordability and OSHA calculation methodologies. The figures are based on employees working an average of 2,000 hours during a full year. The U.S. average in 2020 for the Computer and Ergonomics—materials handling 22% 20% 17% Peripheral Equipment Manufacturing industry (NAICS #33411) was 0.10. Data is for the calendar year. *** Lost time injury severity rate is the number of days lost due to injury per 100 employees and contractors that HP manages. Rates are Overexertion—not materials handling 0% 18% 3% calculated globally using OSHA definitions for recordability and OSHA calculation methodologies. The figures are based on employees Other 24% 10% 29% working an average of 2,000 hours during a full year. Data is for the calendar year. Recordable incidence rate** Global 0.21 0.10 0.13 Americas 0.33 0.19 0.20 Europe, Middle East, and Africa 0.34 0.14 0.13 Asia Pacific and Japan 0.04 0.01 0.08 Leading causes of recordable incidents (with and without lost time) [% of total] Struck by/against/cut by 30% 22% 24% Slips, trips, and falls 19% 16% 14% Automobile accidents 13% 22% 6% Ergonomics—materials handling 21% 11% 17% Ergonomics—office environment 4% 4% 4% Other 13% 25% 35% 63 2021 HP Sustainable Impact Report www.hp.com/sustainableimpact
Contents Sustainable Impact Footprint Integrity and human rights Supply chain responsibility Operations Products and solutions Appendix Our facilities (also see Carbon footprint)* 2019 2020 2021 2019 2020 2021 ** Water withdrawal, by source†† Energy use [MWh] 663,374 604,901 697,058 [cubic meters] 2,930,000 2,597,000 2,556,000 *** Municipal water 2,599,000 2,307,000 2,232,000 Energy intensity [MWh/US$ million of net revenue] 11.3 10.7 11.0 ** ††† Direct energy use in operations (corresponds to Scope 1 emissions) [MWh] 133,851 120,911 202,750 Wastewater from another organization (NEWater) 301,000 269,000 310,000 Natural gas 131,551 117,945 125,111 Rainwater 1,000 1,000 1,000 Americas 113,385 106,738 114,019 Well water 29,000 20,000 13,000 ^ [cubic meters] 0 0 0 Europe, Middle East, and Africa 12,342 9,760 9,632 Reused treated sewage treatment plant water ^^ Asia Pacific and Japan 5,824 1,447 1,460 Water withdrawal intensity [cubic meters/US$ million of net revenue] 49.8 45.9 40.3 ^^^ Renewable (generated on-site) 1,536 1,525 1,440 Recycled or reused water [% of total water withdrawal] 10.2% 10.4% 12.1% **** ^^^^ Diesel/gas/oil/LPG 763 1,441 1,372 Nonhazardous waste, by region [tonnes] 13,000 14,200 13,900 Transportation fleet—gasoline 52,022 Americas 7,000 7,100 6,700 Transportation fleet—diesel 22,804 Europe, Middle East, and Africa 3,900 4,800 4,600 Indirect energy use (corresponds to Scope 2 emissions) [MWh] 529,524 483,990 494,308 Asia Pacific and Japan 2,100 2,300 2,600 Electricity (purchased) 525,299 480,595 491,272 Nonhazardous waste, by type [tonnes] 13,000 14,200 13,900 Americas 217,727 192,520 195,891 Recycled 11,300 10,700 10,500 Europe, Middle East, and Africa 101,580 103,945 108,322 Landfilled 1,100 2,200 2,000 Asia Pacific and Japan 205,992 184,130 187,059 Waste to energy 600 1,300 1,400 Voluntary purchases of renewable energy† 231,561 239,571 261,196 Used electronic equipment recovered from HP operations‡ [tonnes] 400 400 500 Voluntary purchases of no/low-carbon energy 0 0 0 Nonhazardous waste and used electronic equipment recovered from HP operations landfill diversion rate [% of total produced] Supplier-specific renewable energy 7,301 2,566 1,417 Global 91.8% 85.2% 86.4% District cooling and heating (purchased) 4,224 3,395 3,036 Americas 91.2% 90.6% 91.5% Americas 0 0 0 Europe, Middle East, and Africa 89.9% 71.5% 74.9% Europe, Middle East, and Africa 0 0 0 Asia Pacific and Japan 96.9% 95.8% 90.8% Asia Pacific and Japan 4,224 3,395 3,036 ‡‡ Hazardous waste [tonnes] 4,660 6,060 7,060 Water withdrawal, by region [cubic meters] 2,930,000 2,597,000 2,556,000 Americas 1,100 1,180 1,400 Americas 1,306,000 1,126,000 1,132,000 Europe, Middle East, and Africa 1,570 2,010 1,730 Europe, Middle East, and Africa 277,000 252,000 163,000 Asia Pacific and Japan 1,990 2,870 3,930 Asia Pacific and Japan 1,347,000 1,219,000 1,262,000 64 2021 HP Sustainable Impact Report www.hp.com/sustainableimpact
Contents Sustainable Impact Footprint Integrity and human rights Supply chain responsibility Operations Products and solutions Appendix 2019 2020 2021 Community giving and volunteerism Ozone depletion potential of estimated emissions‡‡‡ 2019 2020 2021 [kg of CFC-11 equivalent] 19 4 4 Social investment* Americas 18 1 0 [US$ million] 14.60 34.87 29.06 Europe, Middle East, and Africa 1 3 4 Company cash contributions 2.89 3.71 10.44 Asia Pacific and Japan 0 0 0 HP Foundation cash contributions 4.40 9.88 6.96 Number of violations of legal obligations/regulations‡‡‡‡ 1 1 0 Products** 1.88 13.86 3.08 Fines/penalties related to the above [US$] 0 0 0 Services*** 5.43 7.42 8.58 * Social investment [% of net earnings] 0.46% 1.23% 0.45% See About our operational data. ** Fuel consumption from HP’s transportation fleet was not included in the Direct energy use in operations figures prior to 2021. U.S. employee contributions to Cash Matching Program [US$ million] 2.13 2.65 2.65 *** Historical energy-intensity values were calculated using HP’s annual revenue as characterized in financial reporting and energy use. **** HP Foundation contributions to Cash Matching Program [US$ million] 1.96 3.66 2.73 Diesel is mostly used at HP for testing generators. In limited cases, diesel is also used for long-term on-site energy generation. † Renewable energy and renewable energy credits, excluding renewable energy provided by default in the power grid. Employee volunteer hours 145,000 127,000 136,000 †† “Water withdrawal” includes municipal water, wastewater from another organization, rainwater, and well water. Direct use of surface water is insignificant and not included in data reported. Water withdrawal does not include reused treated sewage treatment plant water. * Social investments include all corporate giving made to nonprofit organizations from HP plus the valuation of employee volunteer hours. ††† NEWater is ultra-purified wastewater used in manufacturing operations in Singapore. Data excludes contributions to the HP Foundation and employee donations but includes HP’s matching contributions and contributions ^ from the HP Foundation to other organizations. This water is used for landscaping and toilets. ^^ ** Historical water withdrawal-intensity values were calculated using HP’s annual revenue as characterized in financial reporting and water Product donations are valued at the internet list price. This is the price a customer would have paid to purchase the equipment through withdrawal. the HP direct sales channel on the internet at the time the grant was processed. ^^^ *** This includes NEWater (ultra-purified wastewater used in manufacturing operations in Singapore) as well as recycled or reused water “Services” equals the valuation of HP employee volunteer hours. Valuation rates are based on CECP standards. reported by sites globally. Grey water is included, rainwater is not. ^^^^ To provide additional transparency, this report presents used electronic equipment recovered from HP operations as a separate category. HP education programs and solutions 2019 2020 2021 ‡ We reuse electronic equipment when possible or recycle it responsibly through the same programs we offer customers. Students and adult learners benefiting from HP’s education programs and solutions 7,777,000 20,785,000 24,038,000 See Product repair, reuse, and recycling. ‡‡ Includes all waste not sent to a municipal solid waste or recycling facility. This conservative approach classifies all waste managed by HP LIFE users enrolled* 49,000 155,000 163,000 our hazardous waste vendor as hazardous, unless we can definitively determine it to be nonhazardous. ‡‡‡ * HP collects all refrigerant consumption data from local facilities maintenance teams company-wide, directly accounting for facilities’ HP LIFE users are also included in the overall students and adult learners data above. refrigerant leakage and use and avoiding the need for extrapolation. We use various tools and sources for global warming potential and ozone-depletion values, including the Greenhouse Gas Protocol’s GHG Emissions from Refrigeration and Air Conditioning Equipment tool, IPCC Second Assessment Report (1995). ‡‡‡‡ This data represents safety or environmental violations from a federal or state agency. 65 2021 HP Sustainable Impact Report www.hp.com/sustainableimpact
Contents Sustainable Impact Footprint Integrity and human rights Supply chain responsibility Operations Products and solutions Appendix Products and solutions 67 Circular and net zero carbon 84 Social impact economy 89 Data 82 Product responsibility 66 2021 HP Sustainable Impact Report www.hp.com/sustainableimpact
Contents Sustainable Impact Footprint Integrity and human rights Supply chain responsibility Operations Products and solutions Appendix Circular and net zero carbon economy Through innovative products and services, We apply rigorous circular design principles to Design for Circularity we are providing our customers an increasingly PROGRESS IN 2021 drive progress toward a circular and net zero Design plays a critical role in determining a circular experience. Our vision is to become carbon economy through our portfolio of personal product’s environmental impacts. We apply a fully circular company powered by service systems, home and office printing solutions, rigorous design principles to improve the models and circular design in our products, which 39% large format printing, industrial graphics, and environmental performance of our products will affect every part of our business. To minimize 3D printing products and solutions. Far-reaching 2 across their life cycle. In 1992, we developed environmental impacts, we are working toward circular by weight (this equals the sum goals related to product circularity (see below), product circularity, continued improvements of the five metrics below) counteracting deforestation, and GHG emissions our Design for the Environment program to in energy efficiency, using more sustainable reduction underpin these efforts. formally consider factors impacting sustainability materials, and making substantial investments performance throughout the product design in forests. We extend product life through design, 32,000 TONNES See the HP Circularity accounting manual. and development phases. We currently call this maintenance, upgrades, repair, and innovative of recycled content plastic used in HP products program Design for Circularity, to reflect how we and packaging (3.3% of total materials use)3 Four key strategies (see graphic) guide our efforts are designing products and business processes service-based business models. At end of to transform business models and decouple for a circular economy. service, we strive to reuse or recover all products. business growth from resource consumption. By Supporting these efforts, we aspire to using 100% 105,700 TONNES focusing on these areas, we strive to continue to We use a science-based approach to evaluate renewable energy and producing zero waste of recycled fiber in HP brand paper and shrink our environmental footprint, support our our products, identify and prioritize improvement to landfill across our manufacturing process. packaging (11.1% of total materials use) customers to meet their own sustainability goals, opportunities, and set goals. We will continue to innovate throughout our product 227,800 TONNES and realize long-term sustainable impact. and services portfolio and work with suppliers and channel partners to increase circularity. of certified sustainably managed fiber in HP brand paper and packaging (23.8% of total Product circularity Energy efficiency materials use) Keeping products and materials in use for longer, Improving product energy efficiency to reduce designing out waste, expanding repair, reuse, and customers’ energy consumption and decrease 2030 GOAL 4,300 TONNES recycling, increasing longevity, and implementing product use carbon and water footprints. of recycled content metal used in HP products circular business models. Reach (0.4% of total materials use) 7,200 TONNES Sustainable materials Forest positive 75% Increasing materials efficiency, practicing Responsibly sourcing paper and packaging, of reused products and parts (0.8% of total responsible chemistry, using more recycled content restoring, protecting, and responsibly managing circularity for products and packaging by 20301 materials use) and renewable materials, and tackling ocean plastics. forests, and inspiring industry action. 67 2021 HP Sustainable Impact Report www.hp.com/sustainableimpact
Contents Sustainable Impact Footprint Integrity and human rights Supply chain responsibility Operations Products and solutions Appendix Product design and development operations training, walk-through simulation, and immersive Life cycle assessment Supporting HP’s efforts to become a more for our personal computing products, LaserJet experiences. Augmented reality and VR in HP uses LCAs and product carbon footprinting circular business, we carried out our second Enterprise Solutions, and InkJet Printing Solutions employee training can replace classroom-style (PCF)4 performance assessment using the Ellen are International Organization for Standardization learning or be used to train for specific manual to quantify the environmental impacts of MacArthur Foundation (EMF) Circulytics tool in (ISO) 14001 certified. We conduct internal tasks, and is a focus area for HP’s Innovation our products, analyze possible alternatives, and early 2022. Developed by the EMF to accelerate compliance audits and benchmark against Garage and Campus of the Future initiatives. target product performance improvements that the transition to the circular economy, it is industry best practices on an ongoing basis. See Education. deliver value to our customers and our business. a comprehensive circularity measurement We have conducted LCAs and PCFs of hundreds system for companies. Relevant products obtain a range of external In 2021, HP joined the International Green Book of products over the last several years, spanning The assessment includes data across dozens certifications (see Product certifications and Supply Chain Alliance to support more our product portfolio. As we develop and expand of metrics, including a company’s products, other information). sustainable practices within the publishing our service-based models (which we refer to material flows, energy, water, infrastructure, industry, particularly efforts to eliminate waste as circular business solutions), we will continue and leadership. During the assessment, we The analog-to-digital shift and reduce environmental impact. to study and quantify the potential they have to documented incremental improvements to reduce environmental impacts and drive progress HP’s scores for both Enablers (which support HP industrial graphics and 3D printing toward a more circular and net zero carbon future progress) and Outcomes (which relate to technologies are driving an analog-to-digital shift economy. In 2021, we: current performance). by enabling cost-efficient short runs that reduce We also participated in panel discussions in inventory and waste and enable companies to HP won seven Green Good Design Awards • Conducted or updated 15 LCAs of HP desktop, late 2021 and early 2022 to provide feedback on engage with customers in new and exciting ways, for personal systems products in 2021. Our DesignJet, scanners, and enterprise printers. the tool, suggesting refinements to the process including through customized and quicker-to- winning products included: • Completed 373 PCFs of new business HP and offering guidance and support to other market products. See HP’s Digital Manufacturing • HP Elite Folio desktops, notebooks, tablets, workstations, organizations considering adopting Circulytics. Trends Report. thin clients, All-in-One computers, and displays • HP Spectre x360 14 to better understand performance and inform Across our portfolio, we offer solutions that • HP ProBook 635 Aero G7 ongoing design improvements. apply digital technology to improve traditionally • HP Renew Sleeve Among our main design priorities, we work to analog processes. For example, in the podiatry • Completed an ISO-compliant, peer-reviewed increase the use of recycled and renewable industry, clinics are able to replace highly variable, • HP U27 4K Wireless Monitor LCA of the HP Z4 G4 Workstation, which found materials; practice responsible chemistry; manual processes to create custom orthoses • HP EliteOne 800 G6 All-in-One its most significant environmental impacts enhance product repairability, reusability, with accurate, repeatable, and consistent digital • HP Elite c1030 Chromebook occurred during use. The circuit board and longevity, and recyclability; continually improve workflows and 3D printing. See Healthcare. HP storage components were the most significant product energy efficiency; and build in accessibility also works closely with customers across product impact drivers during production, followed by features. Our program has continually evolved design, architecture, engineering, training, mechanical components and the power supply. in response to technological and scientific healthcare, and location-based entertainment to • Evaluated the potential to decrease GHG developments, changes to our supply chain, and apply virtual reality (VR) technology to activities emissions associated with molded fiber customer demand. such as product development, employee packaging tooling, by switching from metal 68 2021 HP Sustainable Impact Report www.hp.com/sustainableimpact
Contents Sustainable Impact Footprint Integrity and human rights Supply chain responsibility Operations Products and solutions Appendix parts produced using milled aluminum to lighter Product certifications and parts produced with HP 3D printing, using other information INVESTING IN R&D castor oil-based PA11. The ISO 14067-compliant HP focuses on creating transformative technologies that will disrupt industries and assessment demonstrated a possible Product certifications help drive performance reduction in carbon footprint of 60–78%. across the industry by providing comprehensive economies around the world. In 2021, HP spent over US$1.9 billion on ongoing product • Completed three ISO-compliant, peer-reviewed information that enables customers to make development and creating the transformative and disruptive technologies of the LCA studies quantifying the environmental more sustainable product choices. In 2021, HP future. We invest in areas where we can make the greatest impact, and sustainability is benefits of EvoCycle cartridges—a hybrid tracked over US$7 billion in new sales in which integrated into our overall research agenda. of reused, recycled, and original HP parts— it met customer requirements for registered 5 compared with standard Original HP Toner product eco labels. The majority of our R&D spending is focused on inventions and development for products Cartridges, remanufactured cartridges, and We share extensive product safety and that will be released in the next one to two years. The rest is dedicated to HP Labs and the new build alternatives sold in France. environmental information online and contribute business units for new business creation (including 3D Printing and Microfluidics) and for • Completed a cradle-to-grave comparative to the development of new standards. developing technologies that will mature over the following three to seven years. LCA of flexible packaging production using HP Indigo digital pouch factory and analog Our research is yielding promising applications for more sustainable outcomes in technologies. The LCA model was reviewed by industry, healthcare, education, and other fields. For example, we are developing 100% a third party and then developed into an online Twenty-seven HP displays were recognized recyclable and biodegradable molded-fiber packaging solutions with our 3D printing 6 LCA calculation tool for HP Indigo’s 25,000 as Most Efficient by ENERGY STAR® in 2021. technology: HP’s Molded Fiber Advanced Tooling Solution enables the digital manufacture customers in the flexible packaging market. In all, HP has 658 ENERGY STAR qualified personal systems and printing products— of light, durable tools that are quicker to produce, less labor-intensive to install, and more HP’s environmental impact calculations are 7 customizable than any comparable tool on the market. more than any other manufacturer. done in accordance with ISO 14040 and ISO 14044. All impact estimates involve some level As of October 31, 2021, HP’s worldwide patent portfolio included over 28,000 patents. of reasonable assumptions and uncertainty, resulting largely from industry-wide data Large format printing limitations and data quality. To mitigate this The newest water-based HP Latex Ink qualifies standards for low chemical emissions in indoor • Eco Declarations: In 2021, HP provided Eco uncertainty, we have developed HP-specific tools for a range of certifications for health and air for the finished print. In addition, our water- Declarations for product groups representing that use a combination of HP process and product environmental performance. For example, this based HP PageWide pigmented inks have 93% of revenue data, as well as high-quality LCA data. We strive to HP Latex Ink is certified to UL ECOLOGO®, and attained UL ECOLOGO certification and the provide the most accurate environmental impact HP was the first printing manufacturer with Nordic Swan Ecolabel. • HP Carbon Footprint Calculators data, but some level of uncertainty will remain, UL ECOLOGO-certified ink. HP Latex Ink has • HP product carbon footprint reports and results should be considered accordingly. also achieved GREENGUARD Gold certification See also: for meeting some of the world’s most rigorous • Product compliance declarations • Eco labels and certifications • Safety data sheets 69 2021 HP Sustainable Impact Report www.hp.com/sustainableimpact
Contents Sustainable Impact Footprint Integrity and human rights Supply chain responsibility Operations Products and solutions Appendix Eco labels across our personal systems and printers portfolio % models, for products shipped in 2021* Products EPEAT identifies high-performance, environmentally preferable products ENERGY STAR® TCO Blue Angel recognizes products with recognizes various ergonomic recognizes criteria in product design, energy EPEAT (all) EPEAT Gold EPEAT Silver EPEAT Bronze superior energy efficiency and environmental features consumption, chemical emissions, noise, registered registered registered related to personal systems recyclable design, and take-back programs Personal systems 77% 29% 48% 0% 85% 40% N/A Printers 88% 14% 81% 6% 94% N/A 67% * EPEAT data for personal systems is for models registered worldwide, and for printers is for models registered in the United States. ENERGY STAR data for personal systems (version 8.0) is worldwide, and for printers (version 3.0) is for products sold in the United States. TCO data is for commercial desktops, notebooks, All-in-Ones, and displays shipped worldwide. Blue Angel applies only to products registered in Germany. All data is for models shipped any time during 2021. Product circularity We provide free service documentation for most Home and office printing solutions criteria. Through modular design, we increase products, supplemented with service options and Many of HP’s home and office printers adhere upgradeability and enable many of our printers We design our products to last, and make them warranties, including through HP Care Pack to relevant eco label standards for extending to be easily disassembled for repair or recycling. Central. The HP Customer Self Repair web page product life and conserving materials, including Spare parts are available until at least three years easy to repair, so they can stay in use for as long 8 as possible. Innovative service-based solutions, provides information and the HP Parts Store sells EPEAT® specifications based on IEEE standard after a printer has ceased production. such as HP Device as a Service and HP Managed PC and printer parts. HP Renew Services helps 1680.2, as well as Blue Angel environmental Print Services, reduce environmental impacts customers securely recover and repurpose or through extended life, device optimization, recycle end-of-use devices. and easy take-back. When customers return Personal systems HP EVOCYCLE TONER CARTRIDGE end-of-service products, our repair, reuse, and 9 recycling services help to incorporate products, We test the quality and durability of our Pro and In December 2021, HP introduced in France the HP EvoCycle Toner Cartridge, designed to help public 10 components, and materials back into the next Elite notebooks, Pro and Elite desktops and All- sector and enterprise customers meet their sustainability requirements. Incorporating reused and recycled generation of circular products. in-Ones, and select workstations and mobile thin components from Original HP Toner Cartridges returned within the region through HP Planet Partners, clients using the rigorous military MIL-STD-810G EvoCycle cartridges include 76% reused and recycled components (excluding toner and parts that directly 11 standard. See our technical white paper about impact print quality), or 45% by absolute weight. This innovative process enables EvoCycle cartridges to have Durability, repairability, 12 testing the business ruggedness and reliability of a lower production-phase carbon footprint than standard Original HP Toner Cartridges, while supporting the and reusability HP Business PCs. circular economy by using less virgin plastic. Since cartridges are manufactured and supplied within France, the HP products are often highly rated for durability program also reduces the carbon footprint associated with product distribution and helps sustain local jobs. and repairability. We offer services related to During 2021, the iFixit product repair site rated the optimization, maintenance, and renewal that extend HP EliteBook 840 Aero G8 9 out of 10. product life, capture more value from natural resources, and reduce environmental impact. 70 2021 HP Sustainable Impact Report www.hp.com/sustainableimpact
Contents Sustainable Impact Footprint Integrity and human rights Supply chain responsibility Operations Products and solutions Appendix Large format printing Due to continual upgrades of components and Personal systems Home and office printing solutions HP’s Splash-resistant Bond Paper offers technologies such as printheads, electronics, Our expanding Device as a Service (DaaS) HP Managed Print Services (MPS) helps clients 13 software, and inks, customers who invested in a customers improved splash resistance on an offering provides customers the latest HP manage and optimize their printer fleets, digital economical paper with HP Bright Office Inks on PageWide T200 press in 2010 can now experience technology while improving cost predictability workflows, and paper consumption by combining HP DesignJet T-series printers. Our new Z-series more than twice the speed, with even greater and enabling a better employee experience. hardware, supplies, software, and consulting Pro printers are all EPEAT® registered and print quality, color vision, media versatility, and HP Business customers can upgrade their products and management services. In late 2020, HP MPS ENERGY STAR® qualified, and are made of Brilliant Ink. See our 2020 HP Sustainable Impact to the most current and efficient models, with the was certified CarbonNeutral® in accordance Report for more details about how we protect 15 20–30% recycled content plastic. purchasing and consumption model that works with the CarbonNeutral Protocol, and was the industrial graphics investments. best for them. world’s most comprehensive carbon neutral HP Latex Inks are designed to provide indoor and 16 Managed Print Service offering. In 2021, we outdoor durability and versatility across common Print and compute as a service HP Renew Services helps phase out end-of-use extended CarbonNeutral product certification to media types used in sign and display applications. devices14 securely and responsibly: HP Component MPS, which provides partners a Learn more. HP’s service-based solutions are designed mechanism to make their contractual obligations to deliver increased value through reduced • HP Device Recovery Service buys used carbon neutral using the same stringent Industrial graphics environmental impact and capital costs. devices securely to give them new purpose, requirements and standards as HP MPS. HP digital presses are major capital investments Customers can access the latest technology extend their lifespans, and reduce negative for our customers, and are designed for while HP manages the fleet, and an ongoing environmental impact. Watch our video for We work to reduce GHG emissions across the upgradeability, repair, and refurbishment. Through relationship provides valuable insights on end more details. life cycle of our products, including by improving firmware updates and component upgrades, HP user behavior and needs. Our service offerings • HP Sanitization Service: Confidential data is resource efficiency, promoting settings and user Indigo presses used by customers are kept up to include regular maintenance, which has the securely erased according to the NIST 800-88 behaviors to reduce energy consumption and date. The HP Indigo Certified Pre-Owned program potential to keep hardware in use for longer and standard, or the storage media is destroyed, paper use, and driving responsible end-of-life enables us to keep products in use for longer, reduce waste. Decreasing individual product before removing or recycling customers’ old activities. For any remaining GHG emissions, shipments and customer store visits also 17 reducing waste while allowing customers to devices. Customers receive a certificate of we finance high-quality carbon offset projects. access HP Indigo products at a lower price point. reduces the associated GHG emissions. At end data sanitization if they purchase this service. Learn more. In 2021, we provided 100 pre-owned presses to of service, we recapture value from materials through a range of product repair, reuse, and • HP Recycling Service: Devices are recycled HP MPS end-to-end solutions for HP branded customers through the program. recycling options. securely. Customers receive a certificate of devices can help businesses reduce and offset destruction if they use this service. the carbon impact of printing by estimating the total carbon emissions from HP branded printing solutions using HP’s proprietary Sustainable 71 2021 HP Sustainable Impact Report www.hp.com/sustainableimpact
Contents Sustainable Impact Footprint Integrity and human rights Supply chain responsibility Operations Products and solutions Appendix 18 Impact Reporting and Analytics (SIRA) tool. The of uses to four. Each four-piece set of HP 953 Product repair, reuse, and recycling tracking and metrics used to ensure that offsets cartridges saves the equivalent of more than We design HP products to use resources 2025 GOAL are carried out effectively are managed by SIRA. eight 0.5 liter (16.9 ounce) bottles’ worth of plastic. efficiently and to last a long time. When they Once cartridges can no longer be renewed, they Recycle 1.2 million tonnes of hardware and HP Instant Ink helps home users and are responsibly recycled by HP Planet Partners. reach the end of their service, our robust repair, supplies by 2025, since the beginning of 2016 microbusinesses remain productive by ensuring reuse, and recycling programs help ensure that PROGRESS THROUGH 2021 19 products and materials are repurposed, keeping they never run out of ink or toner. The service Industrial graphics anticipates when the cartridge is running low and them at their highest-value state for as long as Recycled sends replenishments as well as new recycling HP offers Print as a Service in our industrial possible. These programs reduce waste, can give envelopes (for ink cartridges) or recycling labels/ graphics portfolio with the Indigo click-charge per- materials and products renewed life, and support 20 print and monthly service business models, which our drive toward a more materials-efficient information (for toner cartridges) automatically. include supplies and spare parts. We continually 764,800 Customers using this service save up to 50% circular model. on the cost of ink21 22 invest in innovations to extend the lifespan of TONNES or toner. We expanded this supplies and spare parts. See HP’s Statement on E-Waste and Used service from 18 to 37 countries in 2021, including Electronic Equipment. introducing or expanding access to cartridge HP PrintOS is a cloud-based print production 23 recycling in some of those locations. operating system that makes it easy to manage any number of print jobs, increasing Customer take-back programs In 2021, we launched the pilot phase of our press utilization, automating production, and HP provides take-back programs (see next page) HP Instant Ink with Planet Partners project in in 77 countries and territories worldwide24 through Germany. Introduced to several hundred Instant delivering accurate color consistently between a global network of reuse and recycling vendors. Ink subscribers, the initiative allows customers runs, across presses, and across sites. HP to choose renewed ink cartridges instead of also provides services to repair, renew, and new ones. Renewal reduces the use of materials upgrade our industrial graphics presses, as such as virgin plastics and microchips. The pilot well as consumables recycling and end-of increases the total number of times a cartridge service solutions. is used to two (including one reuse) and we are working to further increase the total number 72 2021 HP Sustainable Impact Report www.hp.com/sustainableimpact
Contents Sustainable Impact Footprint Integrity and human rights Supply chain responsibility Operations Products and solutions Appendix HP global take-back programs for customers* Program Description Progress in 2021 Repair and reuse Hardware Our remanufacturing programs help to extend hardware lifespan, with the aim of reducing environmental Our Hardware Reuse Standard outlines our requirements for vendors and subvendors who provide 6.29 million units of hardware repaired impacts from replacing products that still have useful life. reuse, remanufacturing, or remarketing services for HP. (35,300 tonnes) We provide customers with guidance about how to repair their own HP products. See Durability, Reuse vendors must comply with the Media Handling Standard for information security (included in 2.15 million units of hardware reused repairability, and reusability. the Hardware Reuse Standard), which requires the full and documented erasure or destruction of all (7,200 tonnes)** HP Device Recovery Service provides commercial customers reverse logistics, data sanitization with a data-containing devices. 6.8% overall repair and reuse rate of relevant HP *** certificate, a sustainability benefit report, and the fair market value of the device. Watch our video. hardware sales worldwide Recycling**** Hardware HP recycles hardware (both HP and non-HP) that cannot be economically repaired or reused. HP Recycling Services offers custom recycling programs for commercial and enterprise customers, 108,800 tonnes of hardware recycled Consumers, home office, and commercial users have various free recycling options for used equipment, which include reverse logistics and data sanitization with a certificate if they purchase that service. 15.6% overall recycling rate of relevant HP Available in 67 ****** including HP recycling vendors that provide take-back and recycling services or free drop-off for our Watch our video showing the recycling process. hardware sales worldwide countries and products in many countries. Recycling vendors must comply with the Hardware Recycling Standard. 92% of total volume of products and materials territories We belong to compliance systems to comply with producer responsibility requirements of the European taken back in 2021 was reused or recycled by ***** Recycling vendors must comply with the Media Handling Standard for information security (included Union Waste from Electrical and Electronic Equipment (WEEE) Directive and end-of-life legal obligations in the Hardware Recycling Standard), which requires the full and documented erasure or destruction HP or by a third party in countries across our Americas, Asia Pacific and Japan, and Europe, Middle East, and Africa regions. of all data-containing devices. In the United States, customers can drop off hardware at Best Buy stores through our closed-loop We publish disassembly instructions for use by end-of-life recyclers or treatment facilities. recycling program. Ink and toner HP provides free and convenient ways to recycle used Original HP Ink and Toner Cartridges and Samsung See how we recycle ink cartridges and toner cartridges. 10,300 tonnes of Original HP and Samsung toner cartridges toner cartridges. Recycling vendors must comply with the HP Supplies Recycling Standard. cartridges recycled Home and commercial customers can return Original HP Ink and Toner Cartridges for free to more than 84% of materials recovered used in other Available in 68 18,500 authorized sites worldwide. Free pickup and mail-back options are available in most countries. products, and 0% went to landfill countries and territories 1,500 tonnes of Original HP Ink Cartridges recycled 67% of materials recovered used in other products, and 0% went to landfill We also offer responsible processing for batteries and recycling for large format media/supplies, 3D consumables, and packaging. These offerings vary by location. * Descriptions of offerings in this table are as of report publication. Performance data is as of October 31, 2021. Availability of offerings varies by location. View full list of reuse and recycling programs by country. ** Reused material is defined as recovered products or components of products that are used for the same purpose for which they were conceived. A reused product/part should replace a new product/part shipment, and the product/part needs to have been used by a user and refurbished before being sent to a different user. Prior to 2021, this data also included some units remarketed to customers that had not been previously used and refurbished. Beginning in 2021, most repair and reuse data is based on the actual weight for every product, adjusted for estimated amounts that were recycled or for which no issues requiring repair were found. Prior to 2021, data was estimated based on the average weight of each product category. *** The repair and reuse rate is based on the weight of hardware products returned for repair and reuse compared to the weight of our product sales during the year. **** Recycling volumes in 2021 were adversely impacted in some locations by lockdowns and customer behavior impacted by the COVID-19 pandemic. ***** During 2021, 41,600 tonnes of waste electronic equipment was collected on HP’s behalf to comply with producer responsibility requirements of the EU WEEE Directive, compared to 92,600 tonnes of HP electronic equipment placed on the relevant markets during the year. Data includes EU countries in which the authorities or the legislative system provide visibility of the recycling volume allocated to HP. Take-back volumes related to non-EU legislation are excluded. ****** The recycling rate is based on the weight of hardware products returned for recycling compared to the weight of our product sales from seven years ago (the estimated average lifespan of our products). It is impractical for HP to report the recycling rate by product category, as materials are not typically sorted at collection points. This rate also does not include packaging recycling, due to limited data available from recyclers. 73 2021 HP Sustainable Impact Report www.hp.com/sustainableimpact
Contents Sustainable Impact Footprint Integrity and human rights Supply chain responsibility Operations Products and solutions Appendix Product reuse and recycling vendors Vendors with identified nonconformances must Reuse and recycling vendor audits Energy efficiency We work with a global network of vendors to submit corrective action plans within 30 days and provide product reuse and recycling services address those items within 90 days. In extreme to customers around the world. To promote cases, we will cease business with vendors that 2019 2020* 2021 Energy consumed by our products during use is transparency and drive social and environmental lack sufficient transparency or are unwilling to Initial audits 4 10 10 among the largest contributors to our carbon and standards in the electronics industry supply make the changes we require. Repeat audits 30 21 15 water footprints. To help our customers decrease chain, we publish a detailed list of our reuse and energy consumption and GHG emissions, we Through ERM, HP audited 25 vendor facilities in Countries 24 22 14 design for energy efficiency and offer convenient recycling vendor sites, updated annually. 14 countries during 2021. This represented 23% Major nonconformances 59 82 50 service-based solutions that are designed to of reuse vendor facilities and 32% of recycling identified deliver increased value to customers through Vendor audits * reduced environmental impact and capital costs. vendor facilities. This included repeat audits of Major nonconformances 100% 100% 100% Our specialized reuse and recycling vendors are 15 vendor facilities to evaluate their efforts to resolved** We use multiple metrics to assess progress and required to follow environmentally responsible improve performance. Because 28% of major Immediate priority findings 1 4 3 drive improvement. processing techniques and comply fully with nonconformances occurred at sites audited for relevant regulations. HP prefers our vendors to * 2020 data is revised due to calculation errors in the methodology the first time, HP’s engagement brought best from the previous year. attain third-party certification (R2, e-Stewards, or practices, enabling immediate performance ** As of May 2022. WEEELABEX), in line with EPEAT® and HP Recycling improvements. HP has closed investigations of 2025 GOAL Standards. In addition, we commission third-party 100% of the major nonconformances identified audits to monitor vendor conformance with our in 2021. All sites with major nonconformances Reduce HP product-use GHG emissions intensity Categories of major 26 high standards and ensure that returned items will be re-audited the following year to determine by 30% by 2025, compared to 2015 are processed appropriately. We contract with whether improvements are sustained. nonconformance PROGRESS THROUGH 2021 Environmental Resources Management (ERM) to percentage of total 25 HP has achieved this goal for the second year audit vendors for conformance with the following Immediate priority findings are the most serious in a row, with a policies and vendor standards: type of vendor nonconformance, and require 2019 2020* 2021 immediate action. During site audits in 2021, Health and safety 34% 43% 29% • Export of Electronic Waste to Developing three immediate priority findings were identified Environment 14% 16% 13% Countries Policy at two recycling vendor sites upon re-audits. In all cases, we worked closely with the vendor to Hazardous substance/ 10% 5% 12% 39% • HP Supplier Code of Conduct emergency response decrease through 2021, compared to 2015 • Reuse and Recycling Standards resolve and close the findings. This underlines the Insurance 5% 4% 4% (therefore, we will not report on this goal importance of revisiting these vendor locations in moving forward) HP uses a risk-based approach to prioritizing the following year to confirm closure is sustained. Subvendor use and audits 3% 7% 13% reuse and recycling vendor audits, and all vendors Other** 34% 25% 29% Read a statement from ERM. * must undergo an audit at least every three years. 2020 data is revised due to calculation errors in the methodology Vendors are assessed on environmental, health, from the previous year. and safety practices and performance, and ** Includes site security and controls, management systems, labor, data destruction, transboundary shipments, and approved audits ensure there is no “leakage” of materials to dispositions of processed materials. Findings related to data facilities outside our approved vendor network. destruction were limited gaps in processes, not breaches of data security. 74 2021 HP Sustainable Impact Report www.hp.com/sustainableimpact
Contents Sustainable Impact Footprint Integrity and human rights Supply chain responsibility Operations Products and solutions Appendix Personal systems These improvements more than offset a 22% Product use carbon and Sustainable materials Since 2019, the energy consumption of our average estimated increase in energy water footprints personal systems products has dropped by 18%, consumption of desktops between 2019 and To create a circular and net zero carbon economy, 2021, due largely to increased memory (primarily GHG emissions associated with product energy on average. This included average estimated 27 use equaled 8,700,000 tonnes of CO e in 2021, we must gain the most value possible from the reductions in energy consumption of 27% in between 2019 and 2020). 2 materials we use, and reduce our overall demand. 31% of our overall carbon footprint. This decrease notebooks, 40% in workstations, and 18% in See personal systems eco labels information, of 11% in absolute emissions compared to 2020 We use increasing amounts of recycled content displays. Ongoing design improvements in 2021, including ENERGY STAR®. was driven by reductions in product energy use plastics (including ocean-bound plastics), and including more efficient CPUs and power supplies, and by the continued impact of COVID-19 on recycled content metals in our products, and contributed to continued reductions in the typical Home and office printing sales of different product lines, particularly a we focus on packaging innovation to eliminate energy consumption of our notebooks and shift toward Chromebooks, other notebooks, unnecessary packaging materials and plastic. workstations. Increased sales of Chromebooks Original HP Toner Cartridges with HP EcoSmart and InkJet printers, which tend to be lighter and HP brand paper and paper-based packaging and other notebooks, which tend to use less black toner deliver more energy-efficient printing use recycled or renewable29 more energy efficient than desktop PCs and materials, and we 28 energy than desktop PCs, were also a factor. of premium-quality pages. When HP EcoSmart LaserJet printers. are exploring renewable materials use in our black toner became available in 2019, this new hardware products as well. toner formulation contributed to customers using Product energy use represented 54% of our Reduction in energy consumption of an average of 20% less energy when printing water footprint, due to the water used for cooling HP proactively identifies and evaluates materials compared to predecessor printing systems not during electricity generation. This indirect water used in our products and throughout our supply HP personal systems products* using HP EcoSmart black toner. In 2020, HP consumption related to product use equaled chain. We prioritize materials for replacement, % decrease since 2019 transitioned additional HP JetIntelligence platforms 78,900,000 cubic meters, 19% lower than the prior or for transition to a recycled or renewable to the HP EcoSmart black toner formulation, year, due to the same factors that decreased alternative, based on environmental, social, and 2019 2020 2021 enabling even more customers to experience the GHG emissions. supply impacts. Desktops 0% -17% -22% improved energy efficiency of this advancement in low-melt toner technology. Learn more. See product use carbon and water footprint data. We publish information on the material content Notebooks 0% 24% 27% of typical HP personal systems and printers, and Workstations 0% 15% 40% The HP Smart Tank 600, 6000, 700, and 7000 continue to expand our full materials disclosure Displays 0% 6% 18% printer series have been designed to reduce GHG program. In 2021, we more than doubled the Overall 0% 14% 18% emissions from the printing experience, with the number of EPEAT-registered HP products and the lowest carbon footprint of any of our home and number of products for which we are collecting a * The average energy consumption of HP products was estimated office printing solutions. They are ENERGY STAR substance inventory. We collected an inventory annually between 2019 and 2021 using high-volume products qualified and EPEAT® registered, and include of more than 90% of the substances by weight for all product lines including notebook, desktop, All-in-One, workstation, and thin client computers, as well as displays. around 25% recycled plastic content, including used in 79% of HP EPEAT 2021-registered personal Averages are calculated using the most heavily loaded ENERGY 30 STAR configuration as a representative for individual platforms, ocean-bound plastics. systems products. weighted by products sold. Desktops, Notebooks, Workstations, and Displays data is averaged performance data for multiple See printer eco label information, including product lines weighted by units sold. Data in the “Overall” row for ENERGY STAR. all years stated is weighted by units sold. 75 2021 HP Sustainable Impact Report www.hp.com/sustainableimpact
Contents Sustainable Impact Footprint Integrity and human rights Supply chain responsibility Operations Products and solutions Appendix 31 In 2021, we used 956,400 tonnes of materials We developed our General Specification for We are involved in several initiatives under the recovered and recycled materials, to support in our products and packaging, 2% more than the Environment (GSE) in 1998. It includes a full Clean Production Action coalition, including the progress toward a circular economy. 95% of in 2020. This was primarily due to including list of our material restrictions for products, Chemical Footprint Project (CFP), which is part HP PC and home and office print hardware commercial printers, scanners, ink and toner, and packaging, and manufacturing process of our work with the Business-NGO Working introduced since 2020 contains a minimum of spare parts in the data, which more than offset chemicals. The GSE goes beyond worldwide Group (BizNGO). In the 2020 CFP survey, HP was 34 5 grams of recycled content. a shift toward lighter printers better suited to regulatory requirements and is updated annually. recognized as a frontrunner, and shared our printing at home and reduced paper sales. Of the HP is committed to compliance with all applicable answers and scores publicly. Plastic materials we used in 2021, 39% were circular by laws and regulations, including material Our primary focus is on increasing recycled weight (reused, recycled, or renewable). See Data restriction requirements under restriction of We continually innovate to reduce use of plastic use, due to issues related to plastic waste for more detail about HP materials use. hazardous substances (RoHS) legislation. materials of concern. Highlights in 2021 included: and pollution. During 2021, we used a total of When exploring safer alternatives to materials • 83% of personal systems product series are 32,000 tonnes of postconsumer recycled content Responsible chemistry 32 plastic in HP products, equivalent to 13% of overall currently in use, we follow a precautionary low halogen. We aspire to a world where our products and approach, use the National Academy of Sciences • 45% of EPEAT®-registered personal systems plastic use. See Data for detail by product group. operations use materials and chemicals that publication A Framework to Guide Selection products contain GreenScreen Benchmark 2 HP’s strategy to use plastics responsibly is to: cause no harm. For more than two decades, we of Chemical Alternatives, and incorporate the 33 or 3 plasticizers and flame retardants. have worked to move the electronics industry GreenScreen® for Safer Chemicals methodology. • About 79% of InkJet printers were shipped • Reduce plastic use by making our products toward safer alternatives to materials of concern. We screen all ingredients in HP-formulated inks without USB cords and many of the others smaller and removing unneeded plastic We assess published lists of substances of using the GreenScreen methodology, as part of were shipped with shorter cords, avoiding from packaging. concern, customer preferences, new or upcoming our new product development process. approximately 34 million meters of cords. • Substitute plastic in packaging where feasible legal requirements, and sound scientific analysis with more sustainable materials such as that reveals a potential impact on human health We also contribute to standards, legislation, and or the environment. This approach also improves improved approaches to use of materials in the IT Increase recycled content recycled or certified fiber. circularity by increasing the reusability and sector. In 2021, we became a Founding Signatory We are both a supplier and a user of recovered recyclability of our products. See key milestones of the Toward Zero Exposure program by Green materials, incorporating recycled and recyclable in our Green Chemistry Timeline. America’s Clean Electronics Production Network content into new HP products. This helps to 2025 GOAL (CEPN), to protect workers from chemical hazards accelerate global market development for The HP Materials and Chemical Management in the electronics supply chain. Learn more. Use 30% postconsumer recycled content plastic Policy guides how we specify materials and across HP’s personal systems and print product portfolio by 202535 chemicals for use in products, packaging, and manufacturing processes. This policy applies to In 2021, HP collaborated with Ford and Lavergne to reuse spent 3D-printed parts and PROGRESS IN 2021 all HP employees and businesses worldwide and powder, turning them into injection-molded fuel-line clips used in the Ford Super Duty extends to our suppliers. F-250. As well as closing a waste loop, these injection-molded parts made from recycled HP PA 12 have better chemical and moisture resistance than conventional versions, are 13% 7% lighter, and cost 10% less. achieved 76 2021 HP Sustainable Impact Report www.hp.com/sustainableimpact
Contents Sustainable Impact Footprint Integrity and human rights Supply chain responsibility Operations Products and solutions Appendix • Replace virgin plastic with recycled plastic plastic in its keycaps, and 30% postconsumer content aluminum and up to 90% recycled content wherever possible. recycled content plastic in the bezel, and The OMEN by HP 25L Gaming Desktop magnesium. These metals are more likely to be • Source recycled plastic from locations where the outer box packaging is 100% sustainably achieved EPEAT Gold, is ENERGY recyclable through existing infrastructure than 37 materials such as carbon fiber, and still meet the HP can have positive environmental and social sourced. It is EPEAT® Gold registered, ENERGY STAR qualified, and contains 2% impact, such as ocean-bound plastic. STAR® qualified, and TCO certified. postconsumer recycled content plastic. demanding industrial design requirements of our • HP’s Dragonfly G3, launched in March 2022, is products. This decreases environmental impacts • Invest in take-back and recycling. made from 50% recycled plastic from DVDs, 5% associated with mining and producing virgin ocean-bound plastic in its speaker enclosure, materials, including energy use and associated and 90% recycled magnesium in its product • HP L700 and L800 Latex printers and the GHG emissions. enclosure, while the packaging and fiber new HP PageWide XL printer are made using In 2021, HP joined an industry 20–30% postconsumer recycled content To further improve the impacts of metal, we are cushions are 100% sustainably sourced.38 collaboration with Dow Packaging & It is plastic. Each is also EPEAT registered and also working to increase the use of postconsumer EPEAT Gold registered, ENERGY STAR qualified, ENERGY STAR qualified, and uses ink that is UL recycled content and introduce the use of Specialty Plastics, Reifenhäuser, Cadel and TCO certified. ECOLOGO® certified—while the PageWide XL recycled steel. Deinking, and Karlville to demonstrate • The new HP ENVY Inspire 7955e All-in-One ink also carries the Nordic Swan certification. a closed-loop concept for printed Printer is made using 45% postconsumer pouch packaging. The project showed recycled content plastic. It is EPEAT Silver Metal HP Indigo inks could be removed registered, recyclable through HP Planet Metal is an increasing focus for HP, particularly as RECYCLED METAL IN effectively from the recycled pouches, Partners, and supports Forest First printing, more personal systems products transition away PERSONAL SYSTEMS and new high-quality pouches could be where HP protects or restores forests in equal from plastic and we expand our use of recycled The HP EliteBook x360 1030 G8 is 39 produced using the recovered resin. measure to every page printed. metal to more product lines such as some designed and manufactured with Learn more. consumer notebooks. 75% recycled aluminum in its top cover Through 2021, we manufactured over 5.4 billion Metals make up a large portion of the materials and 90% recycled magnesium in its Original HP and Samsung cartridges using a in personal systems products, so we work with bottom deck and cover. cumulative 134,000 tonnes of recycled plastic, suppliers to source metals with a high proportion We use increasing amounts of recycled content including from recycled HP Cartridges. This of recycled content for some personal systems across our product portfolio: has kept 962 million Original HP Cartridges and products (see boxes), including up to 75% recycled • HP’s EliteBook 840 G9 is made with at least 50% an estimated 143 million apparel hangers and 5.5 billion postconsumer plastic bottles out of 36 recycled aluminum in the product enclosure, landfills, instead upcycling these materials for 5% ocean-bound plastic in its speaker continued use. More than 85% of our Original enclosure, 50% postconsumer recycled content HP Ink Cartridges contain 4–75% postconsumer recycled content, and 100% of Original HP Toner Cartridges contain 1–75% postconsumer or 40 post-industrial recycled content. 77 2021 HP Sustainable Impact Report www.hp.com/sustainableimpact
Contents Sustainable Impact Footprint Integrity and human rights Supply chain responsibility Operations Products and solutions Appendix products—equivalent to more than 102 million HP ECO-CARTON INK CARTRIDGE 16.9 ounce (500ml) bottles—preventing this We use OBP in an increasing number of HP As part of our continuing shift from plastic to alternative materials, our new HP Eco-Carton material from reaching waterways and oceans. products across our portfolio, and have launched more than 300 new products around Ink Cartridge for use with HP large format printers, such as the HP Latex 700/800 printer To drive change across and beyond our industry, the world that contain small quantities of OBP we collaborate with a range of initiatives and 43 series, contains recycled and certified fiber, as well as 45% postconsumer recycled since 2017. Examples include: content plastic from our closed-loop recycling process, beverage bottles, and UL-validated organizations: • Personal systems products such as the HP OBP resins. With an additional 500ml carton to complement the existing 1 liter cartridge, • NextWave Plastics convenes leading technology Pavilion x360 15 Convertible PC (5% OBP in use of the Eco-Carton expanded in 2021 to new Latex 700/800 printers, PageWide XL and consumer-focused companies to develop the speaker enclosure) and the HP Z1 Entry the first global network of OBP supply chains. Tower G8 (5% OBP in the speaker enclosure printers, and Z-series Pro printers. and bezel). In 2021, we collaborated on development of the Customers can recycle the outer carton locally and return the inner bag for free via HP Plastics Framework for Socially Responsible • The new Z series, launched in 2021, is the Planet Partners, where available for these products, which will avoid any materials going Ocean-Bound Plastic Supply Chains. This first full series of HP displays to contain OBP, reflects our commitment to collector-centered including in large parts such as the stand (5%) 41 and rear cover (5%). to landfill. The HP Eco-Carton Ink Cartridge reduces plastic use per liter of ink by 80% and OBP initiatives, codified in our UL OBP decreases life cycle GHG emissions by 66% compared to a plastic ink cartridge, due to certification, which requires us to document and • HP Presence is the world’s first conferencing 42 solution made with OBP. HP Presence meeting savings associated with manufacturing and transport. describe how we work to mitigate risks present in informal OBP collection infrastructure. room solutions contain 5% OBP in the speaker enclosure. • Ocean Heroes Network, co-founded by Captain Planet Foundation and Lonely Whale, with • Exclusively from HP, many Original HP Tackling ocean plastics collaboration with Lavergne Haiti, we committed support from HP, produces OH-WAKE, a new integrated printhead ink cartridges contain additional funding to support a productivity pilot OBP (minimum of 5%), validated by UL.44 Since 2016, our ambitious program in Haiti has quarterly online magazine with information helped to tackle the growing challenge of ocean- designed to improve efficiency in collection, to help readers build community, become bound plastics (OBP). In partnership with the logistics, and processing while increasing inspired, and learn how to apply their skills to a First Mile Coalition and our supplier partners, we material quality and average collector income. future with clean seas. • Project STOP collaborates with governments have built a self-reliant OBP supply chain that During the year, we supported collectors through • The NGO WORK in Haiti provides on-site learning and communities in Southeast Asia to create contributes to the circular economy and provides the political unrest caused by the assassination centers for the children of parents who work on effective waste management systems that income and education opportunities locally. of Haiti’s president in July and the devastating recycling efforts. These centers are equipped eliminate plastics leakage into the ocean, and impact of the earthquake in August, and the HP with the latest technology, including HP laptops provides replicable solutions. As a technical Our plastic washing line produces clean, high- Foundation donated over US$300,000 to WORK, and printers using cartridges that include some partner, we support the organization’s work to quality recycled plastic for use in HP products, UNICEF, and Direct Relief. content from waste plastic collected locally. create a circular waste management system in and has simplified our OBP supply chain in Haiti East Java, Indonesia. by eliminating a washing step off the island. This By using OBP in our products, we create • Ocean Plastics Leadership Network is has increased the value of plastic collected and consistent demand for plastic collectors. Since a membership community dedicated to the prices that collectors receive. In 2021, in 2016, we have used 1,298 tonnes of OBP in our addressing ocean plastic pollution. We joined as founding members in 2020. 78 2021 HP Sustainable Impact Report www.hp.com/sustainableimpact
Contents Sustainable Impact Footprint Integrity and human rights Supply chain responsibility Operations Products and solutions Appendix • HP joined the Trash Free Seas Alliance®, this policy for the paper, packaging, and wood packaging. We analyze our supply chain to launched in 2012 by Ocean Conservancy, incorporated into HP products that they provide. understand areas of specific risk (due to weak HP paper impacts, 2021 which develops innovative and pragmatic regulation or ecosystem vulnerability) and tonnes solutions to remove marine debris and plastics We require that all HP brand paper, paper-based create tailored strategies as needed. HP reports from oceans. packaging, and wood in products is derived from progress annually to WWF’s Forests Forward and recycled or certified sources. We continue to give CDP’s forests program. HP printer and copier paper sold 193,900 Renewable materials preference to Forest Stewardship Council® (FSC)- Paper-based packaging for home and office 139,900 certified fiber where available. Programme for HP brand paper sold during 2021 represented printers and supplies, PCs, and displays* 45 the Endorsement of Forest Certification (PEFC™) 0.5% of our carbon footprint. HP is taking steps to HP focuses on sourcing renewable materials * that are responsibly managed in order to certification or relevant national certification make paper use in printing more efficient, through Packaging is the box that comes with the product and all paper-based materials inside the box. Packaging for commercial, protect ecosystems and resources for future schemes can also be used if they comply with our product design features such as pull printing industrial, and 3D products, scanners, personal systems generations. We strive to ensure that our Sustainable Paper and Wood Policy. and automatic two-sided printing. In addition, our accessories, and spare parts is not included. paper and fiber-based packaging are derived HP+, carbon neutral HP Managed Print Services, from recycled or certified content, and we are We work with World Wildlife Fund’s (WWF) Forests and sustainable forestry initiatives help to working to eliminate the use of single-use plastic Forward program, FSC, and our suppliers to reduce and offset emissions associated with HP brand paper and packaging packaging by shifting to fiber-based packaging. continually improve our programs related to printers, Original HP supplies, and paper due to fiber sourcing, 2021* To continue expanding our use of renewable the sourcing of virgin fiber and to increase the raw material extraction (including forest impact), materials we are exploring the feasibility of using amount of certified fiber in our products and manufacturing, transportation, and use. tonnes more biobased plastics in our hardware products. Since 2016, HP brand paper has been derived from Certified fiber 227,800 Paper and forestry products recycled or certified sources, and since 2020 this HP Indigo and HP PageWide Press printers has also been the case for paper-based packaging Recycled fiber 105,700 Paper is integral to the printing process, so are complemented by recently updated media for home and office printers and supplies, PCs, and * healthy, resilient forests are essential to the All HP brand paper is derived from certified sources; paper-based locators for customers that provide lists of 46 packaging for PCs, displays, home and office print, and supplies displays. By sourcing recycled or certified fiber, future of HP’s business. Our forest-positive vision media confirmed to be compatible with these HP has established processes to guard against is reported by suppliers as recycled or certified, with a minimum for printing focuses on creating enduring positive products. These lists include designations for potential deforestation in our supply chain. In 2021, of 97% by volume verified by HP. Packaging is the box that comes change for forest environments. media that have FSC certification and other with the product and all paper-based materials inside the box. environmentally preferable attributes. the amount of FSC-certified fiber in HP brand Packaging for commercial, industrial, and 3D products, scanners, paper continued to exceed 55% by weight. For personal systems accessories, and spare parts is not included. Through the design of our printers and software— packaging, we have implemented a conformance including defaulting many print fleets to double- assurance program for our suppliers to maintain under the HP Sustainable Forests Collaborative. sided printing and reducing paper waste through this accomplishment in the future. HP’s aggressive goals not only focus on HP HP Managed Print Services—we help customers print more responsibly. HP ColorPRO and ColorLok® technologies help brand paper and packaging, but also address us raise standards across the paper industry, In 2021, we also announced a goal to counteract deforestation that goes beyond its own fiber HP’s Sustainable Paper and Wood Policy was the by requiring stringent sustainability standards deforestation for non-HP paper used in HP sourcing to include the paper used in its printing 47 first forestry policy published by an IT company. from paper producers who license these products and print services by 2030. This is products and services. We require our suppliers and licensees to follow technologies from us. Learn more. part of our plan to scale up investment in forest restoration, protection, and other initiatives 79 2021 HP Sustainable Impact Report www.hp.com/sustainableimpact
Contents Sustainable Impact Footprint Integrity and human rights Supply chain responsibility Operations Products and solutions Appendix Other materials experience while driving progress toward a Key initiatives in 2021 • Packaging: We developed a paper wrap for We continue to explore the use of other renewable circular and net zero carbon economy: The following is a selection of the many packaging notebooks that protects the device exterior materials. For example, we are evaluating the innovation projects at HP designed to advance and replaces the traditional plastic bag. In 2021, sustainability attributes of plastics made from • Eliminate unnecessary packaging material, the circular economy. In 2021, we completed more we launched one platform with paper wrap biobased feedstocks rather than fossil fuels and space, and hard-to-recycle materials such as than 30 new packaging innovation projects that packaging, and we plan to launch more in 2022. have created criteria to guide the product plastic foam. reduced our environmental impact. • Warehouse emissions: At selected HP development teams as they choose materials for • Innovate packaging designs to use materials ink supplies warehouses, we switched new products. Every bioplastic feedstock must be with lower environmental impact, such as Eliminate from traditional softwood pallets to pallets individually evaluated using LCAs to fully sustainable fiber and recycled plastics. HP is shifting away from plastic, foam, and other constructed with laminated veneer lumber, understand its environmental and social impacts • Prioritize high recycled content and easily hard-to-recycle materials, which have been reducing carbon footprint per pallet. and confirm that it is less impactful than the recyclable materials that can readily circulate traditionally used in packaging for most personal • Bulk shipping: By shipping more than 56,000 material it would replace. Bioplastic feedstocks through the economy. systems and printing products. For example: considered for use in products must be legal, notebooks, over 184,000 desktop PCs, and renewable, and sustainably grown without Watch a video to learn how HP is tackling the • Personal systems: In 2021, we shipped about 1,300 workstations in bulk (where several impacting regional food security, land use plastic packaging challenge, and learn about our almost 65 million units of personal systems products share one package), HP reduced practices, or critical ecosystems—as verified work to sustainably source renewable materials products in molded fiber or hybrid foam/fiber packaging materials by 815 tonnes in 2021, while through a credible crop management certification and counteract deforestation. packaging, representing about 74% of units also decreasing GHG emissions associated standard. Also, the use of bioplastic feedstocks shipped during the year and more than double with packaging and transportation. must not impact the recyclability of the plastic To address packaging at end-of-life, we offer take- the number shipped in fiber packaging in 2020. Circulate resins, so they can continue to cycle through back services and regularly update the Recycle This included 1.8 million units transitioned from HP’s efforts to eliminate single-use plastic the economy. your HP packaging guide to help consumers avoid foam packaging during the year, eliminating sending packaging materials to landfill. 407 tonnes of hard-to-recycle expanded packaging help to advance the circular economy. plastic foam. We continue to roll out easily recyclable, fiber- based packaging cushions created from recycled The HP Spectre x360 14 has the world’s • Printing: In 2021, we eliminated over 300 tonnes content. In 2021, we used approximately 19,000 first keyboard mechanism incorporating 2025 GOAL of hard-to-recycle expanded plastic foam from tonnes of fiber-based packaging cushions, which 48 the packaging of more than 5 million printer agricultural waste feedstock. During 2021, we launched the Spectre x360 16, Eliminate 75% of single-use plastic packaging units (see Circulate for more detail). which also has a keyboard mechanism by 2025, compared to 201850 49 Innovate To enable innovative packaging for others, incorporating agricultural waste feedstock. PROGRESS IN 2021 HP provides compostability certificates for We continue to improve the tooling design and fiber-based packaging printed with HP C500, fabrication process in the molded fiber industry HP PageWide Press, and HP Indigo industrial Packaging innovation with our 3D printing technology, and in 2021, we graphics printers. These certificates confirm 44% shipped more than 150,000 HP product units with that the ink used by the printers will not Our sustainable packaging strategy has three reduction, from an average of 221 grams/unit cushions made using this proprietary technology. compromise customers’ ability to compost focus areas, aiming to enhance customer in 2018 to 124 grams/unit in 2021 See a video about the HP Molded Fiber Advanced packaging after use. Tooling Solution. 80 2021 HP Sustainable Impact Report www.hp.com/sustainableimpact
Contents Sustainable Impact Footprint Integrity and human rights Supply chain responsibility Operations Products and solutions Appendix typically contain 100% recycled content, to ship non-HP paper used in our printing products and HP notebook, desktop, and display units. This print services. This commitment builds upon our Over the past two years, with WWF and regional stakeholders, HP helped to develop two included 70 tonnes of fiber-based packaging from ambition for HP Consumer Printing worldwide to pilot projects for science-based targets (SBTs) in Brazil’s Atlantic Forest. These pilots 51 new projects launched in 2021. be forest positive by 2025. The Collaborative’s supported continued development of the first standardized, place-based methodology for objectives are to: setting relevant targets for forest restoration. The findings highlighted the feasibility and We shipped 2.7 million A3 toner supplies in fiber- based packaging in 2021. During the year, we also • Responsibly source HP branded paper and importance of setting these targets within a regionalized context, and with consideration transitioned more than 5 million printers to fiber- packaging (see Renewable materials). for existing regional and global thresholds. HP is the first company to pilot SBTs for based packaging, including the HP DeskJet 1100, • Restore, protect, and responsibly forests using a new WWF methodology to estimate printing’s impact on forests. Models 2100, 2200, 2300, and 3700 series printers, using manage forests. developed with HP funding will also help identify regions for forest conservation and more about 1,000 tonnes of recycled content fiber. accurately estimate the carbon and nature benefits of forest protection, management, • Develop science-based targets for forests We also continued to use recycled material for (see callout at right). and restoration actions. pallets. In 2021, we used 97,000 pallets made • Create print technologies for efficient from 50 tonnes of straw from China that might paper consumption. otherwise have been burned as agricultural waste. HP continued its recycled pallet program • Influence industry partners to inspire forest- 2030 GOAL HP Forest Positive program in North America, using 479,000 recycled pallets positive action. during 2021. Counteract deforestation for non-HP paper used 2021** In October 2021, WWF announced its largest U.S. 52 Learn how we gain more value from materials corporate partnership to date, as HP pledged in our products and print services by 2030. Hectares responsibly managed* 14,270 Continue to source only sustainable fiber for all through our product repair, reuse, and US$80 million to support WWF to help address HP brand paper and paper-based packaging Hectares restored* 150 recycling programs. the potential impacts on forests from paper for home and office printers and supplies, PCs, * See HP Forest positive accounting manual for details about our used in printing with HP printers. Starting in early 53 Learn about our approach to responsible and displays. program, methodology, and definitions. 2022, the initiative will focus on approximately ** This data is based on the period October 1, 2020— minerals sourcing, which helps ensure there 950,000 acres (about 380,000 hectares) of forest PROGRESS IN 2021 September 30, 2021. is no connection between the materials used landscapes, including working with communities, During the year, we addressed 23% of our total in HP products and armed violence or human NGOs, and local academics to help protect, fiber footprint for paper used in our products rights abuses. restore, and improve forest management. and print services. Our programs counteracted As part of this collaboration, WWF has joined deforestation for non-HP paper representing 54 The HP Sustainable Forests Collaborative HP’s Sustainable Forests Collaborative in an 19% of this footprint. Since 2020, all HP brand partners include Domtar, New Leaf Paper, Forest positive advisory role. paper and paper-based packaging for home and Chenming Paper, Crown Van Gelder, Sylvamo, office printers and supplies, PCs, and displays Mondi, Felix Schoeller, Lenzing Papier, Boise Paper, The HP Sustainable Forests Collaborative, have been derived from recycled or certified 55 and Andhra Paper. Environmental NGOs Arbor launched in 2019, is driving progress toward sources. During 2021, these equaled 4% of Day Foundation and WWF play an advisory role. our 2030 goal to counteract deforestation for this footprint. 81 2021 HP Sustainable Impact Report www.hp.com/sustainableimpact
Contents Sustainable Impact Footprint Integrity and human rights Supply chain responsibility Operations Products and solutions Appendix In 2021, progress included: HP is the founding sponsor of the FSC One Simple Product responsibility Action digital marketplace, launched in 2021, • Brazil (Atlantic Forest): We funded restoration which helps consumers in North America of 150 hectares of forest in partnership with understand why FSC matters, and find products We are committed to the safety, security, and and detailing agents. The information includes WWF and in coordination with local NGOs and to buy if they want to be part of the solution for privacy of our customers when they use HP physical, chemical, and toxicological properties, government institutions (see table on previous forests. We believe that FSC certification is the products. The company maintains high standards regulatory details, and recommendations for safe page). This effort supports biodiversity most rigorous standard56 in these areas and continues to innovate across handling. Many HP products also qualify for eco available in the corridors and water provision in the Upper marketplace, designed to ensure that critical its portfolio. labels and other certifications that cover health Paraná, Serra do Mar, and Mogi Guaçu/ forest ecosystems—and the wildlife and workers and safety as well as environmental aspects. Mantiqueira regions. that depend upon them—are protected. • China: In 2021, 14,270 hectares of forest were Product safety Home and office printing solutions placed under FSC certification (see table on HP is committed to providing products that are previous page). With HP funding, WWF has Designed with sustainability in mind, Indoor air quality begun on-the-ground activities toward restoring safe for their intended use and that comply with HP voluntarily designs and tests its printing the HP ENVY Inspire is our newest the applicable government regulations of the 1 25 hectares of wild elephant habitat in Yunnan. countries where we market those products. All HP systems to prevent emissions that exceed eco HP funded research to draft the Operational home printing solution with the HP label guidelines and document that its printing 57 branded electrical products undergo evaluations Management Manual for Biodiversity of Forest First feature: for every page systems are compliant with Blue Angel and Planted Forest. The manual will be developed printed with HP+, HP protects or and testing to ensure that they meet HP safety EPEAT® indoor air quality (IAQ) criteria. Original HP standards. This is consistent with HP’s Safe & through case studies, field training, and forest 58 Toner and Ink Cartridges are designed and tested restores forests in equal measure. Legal Product requirements, which outline relevant pilot planning to address challenges in select Through this technology we’re bringing internal and international safety standard with health in mind. forest farms. our customers enhanced printing requirements (e.g., the Safety Standard UL/EN/ In 2021 and 2022, HP commissioned Fraunhofer • Arbor Day Foundation and Eden experiences from home. The ENERGY IEC 62368-1). We work to identify opportunities for Institute WKI to perform studies that tested the Reforestation Project: Through these STAR® qualified 7200e and 7900e series ongoing improvement in this area. emission rates of volatile organic compounds initiatives, we planted nearly 1.1 million trees, printers have supplies that contain 74% and ultrafine particles of different toner cartridge contributing to the World Economic Forum’s We share extensive product safety information brands used in popular HP laser printers. WKI’s 1t.org initiative—a global movement to conserve, recycled plastic, including ocean-bound online to support customers’ informed purchasing tests on brands most commonly available in the restore, and grow 1 trillion trees by 2030. plastic content. decisions. View Declarations of Conformity North America, Latin America, and Europe, Middle • Conservation International: We continued to for European Union requirements. Contact HP East, and Africa regions found that 95% of the non- support Conservation International initiatives Sustainability and Compliance Center regarding HP cartridges tested failed to meet Blue Angel declarations for other countries. 2 focused on local farming communities and emission criteria. WKI’s tests on brands most forest protection. In 2021, the partnership Safety data sheets are available for HP commonly available in Asia Pacific and Japan broadened beyond Brazil to include areas in formulated products, including inks, toners, found that 93% of the non-HP toner cartridges 3 Colombia, Peru, and Ecuador. batteries, and 3D printing materials and fusing tested exceeded Blue Angel emission limits. 82 2021 HP Sustainable Impact Report www.hp.com/sustainableimpact
Contents Sustainable Impact Footprint Integrity and human rights Supply chain responsibility Operations Products and solutions Appendix applications involving toys.4 Test results for HP PA 11, HP PA 12, HP PA 12 GB, HP CB PA 12, Total volatile organic compounds emissions from non-HP cartridges tested* specific HP inks can be made available to HP PP enabled by BASF, and HP TPA enabled customers upon request. For these assessments, by Evonik, as well as the corresponding HP 3D 400% we typically consider general chemical regulatory 600/700/710 and HP 3D 710 R Fusing and Detailing 30% compliance criteria and material-specific Agents, have been tested for problematic s % requirements for ink formulations, with an heavy metals, phthalates, BPA, and migration of n o i 300% emphasis on standards relating to paper and certain components. s s i m t printing on books and puzzles. s ei 0% m d i n l l u e See Product certifications and other information. o g p n 00% Product security and privacy m e A o u c cl i e B0% Cybersecurity is an increasing concern for our n h Industrial graphics a g r w t customers worldwide. We continually work to o e ol 00% l e i t Food contact material compliance enhance HP products, solutions, and services a r b l o e o0% to offer industry-leading security and resiliency l vv We incorporate relevant food contact material a o t b o capabilities, and seek to address and anticipate T a regulations, industry guidance, and brand 0 requirements into our formulation qualification an ever-evolving cyber-threat landscape. -0% Non-HP brands tested process to support a variety of food packaging HP follows security-by-design and privacy-by- printing solutions offered by our Indigo, PageWide design principles, including Zero Trust principles, * Results from two WKI studies: 2022 WKI Emissions Testing study, commissioned by HP, in compliance with Blue Angel protocol DE-UZ Industrial, and Specialty Printing Systems in the development of our products, from design 219: 22 non-HP (17 imitation and five remanufactured) toner cartridge brands compatible with HP Color LaserJet Enterprise M553X technologies. Whenever possible, HP strives to and HP LaserJet M404dn purchased in the North America, Latin America, and Europe, Middle East, and Africa regions. See HP.com/go/ formulate with chemicals previously evaluated through manufacturing, renewal/reuse, and IAQnonhpWKI2022. March 2021 WKI Blue Angel Indoor Air Quality study, commissioned by HP, in compliance with DE-UZ 205: 12 imitation recycling. We build protection, detection, and and three remanufactured toner cartridge brands compatible with HP LaserJet Pro M402dne and M403d (26A, 28A) purchased in Australia, and deemed suitable for use in food packaging China, Korea, Malaysia, Singapore, and Thailand. See HP.com/go/IAQnonhpAPJ2021. printing applications. recovery capabilities into the devices, not just in software, providing customers separate, In December 2021, HP won an Outstanding Case the ink formulation to determine its suitability 3D printing auditable security mechanisms to help manage Study award from the Sustainable Purchasing for the application. We also obtain the ECO and recover from security risks. We design Leadership Council for a study that provides PASSPORT by OEKO-TEX®, an independent For our 3D printing solutions, we conduct a hazard business PCs and printers with future threats in information about the importance of considering safety certification for chemicals and colorants and regulatory assessment for each substance mind, with built-in hardware-enforced security and IAQ in printing-system purchasing decisions. used in the manufacturing of textiles, which in the fusing and detailing agent formulations resiliency capabilities that integrate seamlessly supports customers who wish to obtain the to determine suitability for applications such as with an organization’s broader infrastructure. Large format printing OEKO-TEX STANDARD 100 certification for their toys, medical devices, and cosmetics packaging. Aiming to deliver the most secure devices, and the textile products. To ensure we meet customers’ sustainability services and solutions to help our customers use For our textile printing solutions, which include requirements, we also review formulations endpoint infrastructures safely and confidently, is HP Stitch printers, HP conducts a hazard and Some HP inks are assessed to provide against restricted substances lists as required the foundation of our strategy. regulatory assessment for each substance in information about suitability for printing by individual customers. HP 3D printing materials 83 2021 HP Sustainable Impact Report www.hp.com/sustainableimpact
Contents Sustainable Impact Footprint Integrity and human rights Supply chain responsibility Operations Products and solutions Appendix HP’s leadership team oversees our portfolio-wide requirements that mitigate the risks of NIST Platform Firmware Resiliency Guidelines. Social impact approach to security and provides the resources counterfeits, malware, and tampering. HP FutureSmart printers automatically self- needed to support HP’s continued leadership. Our heal and recover from attacks, and provide the Security Advisory Board, consisting of several Personal systems following award-winning features: Digital equity is the path for everyone, everywhere HP leaders as well as external advisors with to have equal access to education, healthcare, broad backgrounds in offensive and defensive HP produces the world’s most secure PCs • HP Sure Start maintains BIOS integrity. and economic opportunity. HP’s commitment to 5 creating positive, lasting change for communities security, advises us on the ever-changing threat and workstations. The HP Endpoint Security • Whitelisting ensures both HP and HP- landscape, augmenting our work in HP R&D and Controller is our foundation for hardware-based approved partner firmware is digitally signed around the world extends to how we design and HP Labs research activities. security, and has been certified by a third-party and validated. deploy products, solutions, and services. lab. It establishes a hardware root of trust, and is We continually conduct threat analysis on physically isolated from the machine’s CPU and • Run-time intrusion detection monitors memory HP’s portfolio of education products, emerging attack vectors, which in turn helps operating system, providing resiliency to the PC. for unusual activity. partnerships, and programs is enabling better guide product security development efforts. We • HP Connection Inspector monitors outbound learning outcomes and accelerating digital 1 employ cybersecurity specialists and conduct HP Wolf Pro Security helps small to mid-sized printer network connections. equity for millions of people worldwide, while our cybersecurity architecture reviews, penetration businesses with a simple solution that delivers strong focus on inclusive design aims to ensure testing, code reviews, and automated code maximum security coverage without increasing Through our industry-first printer Bug Bounty that everyone benefits from our technology. Our scanning using industry-leading tools. When IT’s workload or disrupting employee productivity. program, we offer rewards for highly trained, healthcare products are designed to streamline issues arise, we take appropriate actions to geographically diverse ethical hackers who patient care, optimize clinical workflows, and remediate reported security vulnerabilities. HP Sure Click Enterprise goes beyond Next- expose flaws in our print technology. The program deliver customized solutions. Many programs Generation Antivirus and Endpoint Detection and leverages deep, hard-to-find technical skills to find described throughout this report also contribute In 2018, we adopted the industry best practice Response with hardware-enforced isolation and obscure, previously unidentified vulnerabilities in Coordinated Vulnerability Disclosure approach, containment, and provides detailed, real-time our devices and ink/toner cartridges before they which describes how we work with partners, threat intelligence to security teams. are released to market. industry, and the security community to address 2030 GOAL HP’s Threat Research experts provide breaking vulnerabilities. When notified about a suspected HP Security Manager is the industry’s only 2 vulnerability, we investigate thoroughly and, news on malware, including indicators of comprehensive policy-based printer security Accelerate digital equity for 150 million people compromise and suggestions on how to defend by 2030 (beginning in 2021) if confirmed, work with the submitter on against threats. compliance tool. It is used to assess and remediate remediation and a coordinated public release configuration settings across HP printer fleets. PROGRESS THROUGH 2021 of information. Learn more about our personal systems Accelerated digital equity for security solutions and HP End-of-Use Services, HP Print Security Services combines credentialed The HP supply chain security group works to ensure including Device Recovery, Sanitization, and security experts and trained print specialists to that our products can resist attacks throughout the Recycling Services. assess customers’ unique print environments, 4.3 MILLION supply chain life cycle, from component sourcing address compliance requirements, develop and and manufacturing to transportation, service, implement plans, provide ongoing management, people and take-back. Our HP Product Cybersecurity Printers and proactively identify gaps in defenses. Standard for Suppliers, enforced through periodic 6 audits, contractually holds relevant suppliers to HP offers the world’s most secure printers, and Learn more about security solutions. our FutureSmart printers meet and exceed the 84 2021 HP Sustainable Impact Report www.hp.com/sustainableimpact
Contents Sustainable Impact Footprint Integrity and human rights Supply chain responsibility Operations Products and solutions Appendix to economic opportunity, such as our supplier with UN Women, the BHP Foundation, and Intel to Through an inclusive education partnership with diversity efforts, HP LIFE, our ocean-bound plastic 2025 GOAL launch five HP LIFE Centers during 2021 as part Governor Morehead School in Raleigh, North work in Haiti, and our supply chain capability- of UN Women’s Second Chance Education and Carolina, United States, HP provided technology building initiatives. Enable better learning outcomes3 for 100 million Vocational Learning (SCE) program. This expanded “bundles” and ongoing training for teachers people by 2025, since the beginning of 2015 on the three Centers opened the prior year. and staff. The bundles, which included laptops We prioritize initiatives that support those most PROGRESS THROUGH 2021 and docking stations, large monitors, external likely to experience the digital divide: women and People with disabilities keyboards, and noise-canceling headphones, girls, people with disabilities, communities of color support learning at home and on campus at the and marginalized groups, and educators and Inclusive technology is a vital tool for achieving HP Computer Learning Lab and empower visually healthcare practitioners. 74.3 MILLION digital equity. As well as designing more impaired students to continue developing critical students and adult learners have benefited from accessible products, we engage in projects that digital skills. HP’s education programs and solutions, which create learning environments where everyone Education advance quality learning and digital literacy can thrive. We continue to support the nonprofit Don’t Hide and enable better learning outcomes, since the It, Flaunt It (DHIFI), which works to empower Education is a fundamental human right and beginning of 2015 (including 24 million in 2021) children to accept differences and their unique foundational to sustainable development. characteristics. In 2021, HP employees and their Technology can be a great equalizer by bringing In 2021, HP Indigo in Brazil empowered children had the opportunity to judge essay quality digital learning to people where they live, Hershey to celebrate International Women’s submissions to DHIFI’s Kids Flaunt contest. The which is vital in a rapidly changing world of work than 1 million through Girl Rising’s partnership Day: #HerShe for the second consecutive contest was open to children across the United that calls for flexibility, intercultural connection, in India with NGO Slam Out Loud, which uses year. #HerShe focuses on “Making Invisible States, and we provided laptops, printers, and 24/7 collaboration, and lifelong learning. For the arts to build skills such as communication, Women Visible” and helping women’s voices power banks as prizes for winning entrants. critical thinking, and empathy in children from be heard by turning Hershey’s iconic chocolate people everywhere, especially underserved disadvantaged communities. bar wrappers into powerful showcases for groups, equitable access to opportunity and female artists. HP, working with BETC Havas Historically excluded and outcome-based learning experiences are key to In support of digital equity, we collaborate with MIT and Hershey in Brazil, co-created dozens of marginalized communities building skills for work and participation in society. Solve, an initiative of the Massachusetts Institute women’s influencer stories that are celebrated of Technology (MIT) that aims to solve world on each wrapper. Using augmented reality, We aim to advance diversity, equity, and inclusion Women and girls challenges. In 2021, we launched the “Girls Save users scan each bar to access the stories at HP and beyond. HP has set numerous goals the World” prize for the Solv[ED] Youth Innovation and feel inspired to make their voices heard. A in this area, including to complete STEM pilots in More than 130 million girls around the world lack Challenge, asking girls aged 13–18 to submit ideas total of 320,000 chocolate bars were printed target communities with channel partners and access to education, and women account for and distributed in supermarkets, generating suppliers. In support of this, we worked with MIT two-thirds of the 750 million adults without basic to address local environmental issues, such as 1.3 billion impressions and achieving more than water pollution, air quality, and deforestation, 30% organic growth in the social network of Solve in 2021 to launch the first U.S. Challenge on literacy skills. Through our partnership with Girl offering the chance to win HP technology packages each influencer. This marketing campaign was Antiracist Technology, with funding available for Rising, from 2019 to 2022 we aim to equip up to and funding from a US$50,000 prize pool. developed by HP’s Brands Innovation team exceptional tech-based social entrepreneurs. 10 million students and teachers in India, Nigeria, using the company’s exclusive personalization This included the HP Prize for Accelerating Digital and the United States with a new inclusive HP is also collaborating with UN Women to framework, and printed on an HP Indigo 25k Equity, a US$100,000 grant to advance inclusion, curriculum and technology solutions. In 2021, we advance digital education and entrepreneurship press. Learn more. digital literacy, and economic opportunities in reached nearly 2 million people, including more for women and girls. In Mexico, we partnered communities around the world. 85 2021 HP Sustainable Impact Report www.hp.com/sustainableimpact
Contents Sustainable Impact Footprint Integrity and human rights Supply chain responsibility Operations Products and solutions Appendix Nonprofit NABU works to improve childhood rural communities. Each 20-seat WOW vehicle In 2021, more than 100,000 teachers attended Industry solutions literacy and confidence in marginalized is equipped with HP computing and printing a set of six webinars, with recordings and self- HP’s education programs build on the strength of communities by publishing books in children’s technology, as well as software and e-learning paced learning made accessible to 300,000 our innovation to deliver cutting-edge computing native languages. HP is partnering with NABU, as tools. In 2021, 43 WOW mobile learning labs teachers associated with the MOEC Learning and digital printing solutions and outcome-based part of the Digital Equity Accelerator (launched in directly benefited approximately 350,000 people Management System. learning experiences that support remote 4 early 2022), to establish the HP Creative Lab at the in villages throughout the country. • Digital Schools Awards: This HP-led initiative learning and help people thrive in a rapidly Kigali Public Library in Rwanda to train more than cultivates and recognizes use of technology evolving digital world. 200 African authors and illustrators to publish Another way we help connect people with that supports improvements in teaching, hundreds of books for children each year. In 2021, technology is through the HP Common Service learning, and assessment, including blended we produced two books with NABU, one of which Lab, which integrates e-education, e-health, and learning that helps teachers educate remotely. Campus of the Future was also in collaboration with Girl Rising. e-citizen services into a standard 40-foot ISO An estimated 185,000 students benefited in HP’s Campus of the Future framework creates shipping container. This turnkey solution can 2021, in Ireland, Lithuania, Northern Ireland, vibrant environments for teaching, learning, In December 2020, we began five HP Literacy provide services in hard-to-reach locations with research, and collaboration. HP and EDUCAUSE Attainment Coach pilot programs to drive digital limited or no infrastructure support. Learn more. Scotland, Serbia, and Slovenia. are collaborating with more than two dozen equity by increasing literacy levels among youth • Mentor a Teacher Program: In partnership colleges and universities, ranging from elite and adults. With support from local government Educators with Girl Rising, HP’s Mentor a Teacher R1 research institutions to technical colleges and NGO partners, the six-to-nine-month pilots Program (HP MAT) is collaborating with 1 Million and historically Black colleges and universities launched in Ghana, Kenya, Nigeria, Rwanda, Enabling digital equity around the world depends Teachers in Nigeria to empower teachers to (HBCUs), providing cutting-edge technologies and The Gambia. Participating schools receive on empowering educators. HP’s initiatives and support girls and advance their right to quality alongside financial and technical support. professional development, ongoing diagnostic partnerships are helping to create the conditions education by providing skills, resources, and These collaborations are exploring esports, 3D assessments, targeted instruction, and teaching needed for learners to thrive. mentors. The HP MAT Program is based on four printing, extended reality (XR), data science, and and learning resources. • HP Innovation and Digital Education Academy pillars: gender equity, relationships and digital machine learning to identify the technologies Communities in remote areas are particularly (IDEA): Launched in late 2020, HP IDEA is inclusion, leadership development, and the with the greatest potential for teaching, learning, likely to experience a digital divide, necessitating a network of innovative teachers who are success mindset. During 2021, it matched more and research. More than 30 collaborators tailored responses. In collaboration with the using technology to deliver powerful learning than 90 HP mentors from Canada, Nigeria, form the EDUCAUSE/HP XR Community Group, Indian government’s Digital India initiative and outcomes. Through December 2021, HP IDEA South Africa, and the United States with which gathers monthly to share learnings, other private sector partners, the HP World positively impacted approximately 500,000 educators on a 1:1 basis. reflect on challenges, and discuss successes on Wheels (WOW) program brings internet- students in about 400 schools worldwide. of the adoption of XR in higher education. In enabled, solar-powered mobile learning labs to collaboration with HP’s HBCU Technology • Empowering Indonesian educators: In Conference, EDUCAUSE also examined the remote areas of India. Supporting digital literacy, partnership with Indonesia’s Ministry of HP shipped approximately 15.6 million PCs to nuances of digital transformation at minority- education, entrepreneurship, and citizen services, Education and Culture (MOEC), HP created the schools in 2021. serving institutions. the initiative works with people in rural and semi- Semangat Guru learning program to upskill Indonesian teachers and education personnel, For example, EDUCAUSE investigated the benefits helping them adapt to digital transformation. esports programs provide higher education institutions, which include student recruitment 86 2021 HP Sustainable Impact Report www.hp.com/sustainableimpact
Contents Sustainable Impact Footprint Integrity and human rights Supply chain responsibility Operations Products and solutions Appendix and retention, workforce skills development, and HBCUs with valuable information about digital Healthcare Specialty Print & fostering inclusive engagement among students. transformation, as well as opportunities to share Technology Solutions EDUCAUSE also studied the outlook, and the IT best practices and discuss industry insights. Across our portfolio, from PC and printing obstacles and the catalysts, of XR adoption in See Diversity, equity, and inclusion. Pharmaceutical companies, drug manufacturers, higher education. solutions to personalized 3D-printed prosthetics, hospitals, medical laboratories, and pharmacies HP Innovation Garage HP innovations focus on meeting specific need a wide variety of high-quality variable See the following reports: challenges in the healthcare sector. Our solutions data coding and marking print solutions and The HP Innovation Garage, launched in 2020 in are designed to help clinicians improve patient color labels. HP Thermal Inkjet systems enable • Expanding Esports in Higher Ed: Benefits and collaboration with Intel, is the largest technology experiences, boost efficiency, and increase human- and machine-readable codes and marks Guidance for New Esports Programs start-up campus in the Middle East and North access for underserved populations. to be printed directly on packages, helping to • QuickPoll Results: XR Technology Africa region. Based at the Dubai Technology eliminate stock label waste and enhancing Entrepreneur Campus, the lab helps young We help customers in all industries keep high- product identification and security. For example, • Digital Transformation at Minority people develop transferable skills in technology, touch, collaborative, and public-facing technology personalized color-printed labels for medicine Serving Institutions design, and prototyping, and explore career clean, and support employee wellbeing by bottles give patients more information, such as a paths through Entrepreneur, VR, and STEAM offering a broad range of sanitizable devices. photograph of the medicine. HBCU Technology Conference (science, technology, engineering, arts, and math) From Elite PCs to Z by HP, and from displays to In September 2021, HP hosted the inaugural and Robotics learning zones. In 2021, around select accessories, these devices can be wiped The HP D300e Digital Dispenser, a bioprinter 40,000 educators, students, and other interested 5 annual HBCU Technology Conference, providing down with many common disinfectant wipes. For platform, accelerates drug research and other customers attended workshops and webinars example, select HP EliteBooks, ZBooks, and thin laboratory applications by automating serial hosted by the HP Innovation Garage. See the clients support easy, repeatable sanitization6 (up dilutions. This family of products enables 360-degree Virtual Tour. to 10,000 times) with select germicidal wipes on To help meet the demand for the entire device. technology in educational settings, HP Grants Support Program HP Healthcare Print Solutions address pressing we are providing HP Modular Tech In 2021, the HP Grants Support Program provided The HP Common Service Lab (CSL) initiative is educational institutions and nonprofits with free issues facing the healthcare industry, including designed to provide healthcare, education, and Hubs to schools in Southeast Asia, patient wellbeing and safety, care coordination, other citizen services to hard-to-reach locations enabling students to use HP PCs to access to quality grants research and consulting, mobility, privacy, and security. The portfolio offers in India. Housed in solar-powered shipping learn coding and Microsoft Office skills. in collaboration with Grants Office LLC and with Basic Print Cloud Services delivered through HP containers, CSL containers are accompanied by a funding support from AMD, Intel, and Microsoft. Print Security Advisory Services and HP Security general healthcare practitioner, enabling a range The program also includes training to During the year, 96 primarily education-focused of healthcare services to be provided directly, 7 support teachers to improve learning organizations, including libraries, K-12 school Manager, providing patient data protection such as general assessment and diagnosis, eye outcomes through technology. As of districts, community colleges, and elite research to all HP devices, with the added protection of tests, and COVID-19 vaccinations. If a case is institutions, used the program’s services to pursue PrintSecure on Zebra wristband printers. complicated, specialists can be contacted December 2021, HP had launched five Learn more. virtually via video using CSL’s telemedicine hubs in Indonesia, two in Vietnam, and more than US$7.6 million in STEM-related and other grants to improve student outcomes and features. Across all services, HP CSL reached one in Malaysia, and reached more than help close the digital divide. About US$500,000 in over 18,000 people in 2021. Learn more. 15,000 students. grants was awarded in 2021. 87 2021 HP Sustainable Impact Report www.hp.com/sustainableimpact
Contents Sustainable Impact Footprint Integrity and human rights Supply chain responsibility Operations Products and solutions Appendix researchers to dispense or print very small 3D printing has also demonstrated potential Accessibility HP regularly participates in accessibility-related (picoliter) quantities of fluid needed for drug and to help address supply chain imbalances and conferences, industry groups, and government vaccine research in seconds, which can save time contribute to healthcare solutions during the About one in seven people in the world has a forums in an effort to advance worldwide standards and reduce plastic waste associated with manual COVID-19 pandemic. See The global rise of 3D and policies that improve the accessibility of disability,8 including about one in four U.S. adults.9 pipetting methods. printing during the COVID-19 pandemic. Removing barriers that otherwise prohibit them information technology. These include current from engaging as dignified, independent, equal, standards (such as the Web Content Accessibility In 2021, HP continued to place D300e printers Learn more about healthcare and medical Guidelines 2.1, U.S. Revised Section 508, and in pharmaceutical and government labs around 3D printing. and active members of our communities is the E.U. EN 301 549) and emerging ones (such the world to help accelerate drug research for critical for society and business to thrive. HP is as the European Accessibility Act and the 10 diseases such as cancer and accelerate testing Microfluids and cancer research investing in accelerating digital equity for 150 Canadian Accessibility Act). In 2021, over US$7.5 of new therapies to combat antibiotic resistance. million people by 2030, including individuals billion in sales11 HP has decades of experience in manipulating with disabilities. was actively supported by HP fluids at the microscopic level, which we are in cases where accessibility was an area of 3D printing applying to research on the surveillance of The HP Hardware Accessibility Testing Guide customer interest. 3D printing has the potential to transform cancers in patients post-chemotherapy. A team details how we test products for accessibility and This work complements the most significant healthcare by replacing highly variable, manual in our Microfluidics and Systems Technology Lab communicate the results in our conformance contribution we can make to accessibility: processes with accurate, consistent digital is working to develop a new method for research reports. We share this information to help producing IT products and services that are workflows and additive manufacturing. purposes to isolate rare cancer cells. This advance a broader industry conversation about usable and enjoyable by the widest number of research deploys a combination of hydrodynamic best testing practices, in support of more people practicable. For example, we recently Advances in 3D printing enable transformative and electric fields to separate cells based on accessible products. released Accessibility Mode, as well as an approaches to healthcare and medical devices. electrical properties. This technology research optional Speech Access Module (SAM) for HP technology is being used to create anatomical has the potential to help researchers support We welcome new opportunities to incorporate Displays update for select displays with built-in models, highly customized dental aligner molds, personalized therapy and detection of post- feedback from the global disability community speakers or a 3.5 mm stereo headphone jack. tailored orthoses and prosthetics, and a wide treatment cancer cells through liquid biopsies. into our accessibility program. For example, HP’s Learn more about how HP products increase range of medical equipment. For example, care Learn more. inclusive education partnership with Governor possibilities for those with visual, auditory, providers using HP’s 3D Arize Orthotic Solution, Morehead School in Raleigh, North Carolina, physical, and cognitive disabilities. launched in 2021, can scan a patient and provide United States, provided user feedback and custom orthoses in as little as five minutes, examples of how we can design more inclusive Visit the HP Office of Aging and Accessibility applying industry-standard modifications with products to support education, whether students to learn more about HP product accessibility precision and consistency. HP’s 3D Arize Solution are learning remotely or in the classroom. and share your own accessibility story involving simplifies production and aims to help reduce HP technology. carbon emissions and waste. For the patient, this means receiving a customized orthotic suited to address their individual health and wellbeing needs—delivered correctly. 88 2021 HP Sustainable Impact Report www.hp.com/sustainableimpact
Contents Sustainable Impact Footprint Integrity and human rights Supply chain responsibility Operations Products and solutions Appendix Data Energy efficiency 2019 2020 2021 2019 2020 2021 Product-use GHG emissions intensity* Total recycling, by type [tonnes] [% reduction since 2015] 18% 33% 39% * Hardware 113,400 106,500 108,800 See endnote 26 on page 116. Original HP and Samsung Toner Cartridges****** 14,300 10,600 10,300 Product repair, reuse, and recycling* Original HP Ink Cartridges****** 1,400 1,300 1,500 2019 2020 2021 HP Indigo supplies n/a n/a 1,400 Overall Original HP and Samsung Toner Cartridge recycling Number of countries and territories with HP return and recycling programs 76 77 77 HP toner market covered by program [%] 91% 92% 94% Total reuse and recycling of hardware and recycling of supplies [tonnes] 135,300 124,400 129,300 See composition data. Percentage of total volume of hardware products and materials taken back that was Original HP Ink Cartridge recycling reused or recycled by HP or by a third party [%] 91% 91% 92% HP ink market covered by program [%] 90% 91% 89% Repair and reuse See composition data. ** Electronic equipment repaired [units] 4,620,000 5,310,000 6,290,000 * Totals include all hardware and supplies returned to HP for processing, with ultimate dispositions including recycling, energy recovery, ** and, where no suitable alternatives exist, responsible disposal. Original HP Toner and Ink Cartridge recycling data is for calendar year. Electronic equipment repaired [tonnes] 22,500 20,000 35,300 The remaining data is based on the HP fiscal year. Although for HP print cartridges we report the composition of recovered materials, *** Electronic equipment reused [units] 1,210,000 1,280,000 2,150,000 we cannot provide this data for hardware because we do not have operational control over all recycling processes and so do not have access to this information. Recycling volumes in 2020 and 2021 were adversely impacted in some locations by lockdowns and customer *** Electronic equipment reused [tonnes] 6,200 5,900 7,200 behavior impacted by the COVID-19 pandemic. In some cases, segments do not add up to total due to rounding. Although we do not **** include data prior to 2019 in the Product repair, reuse, and recycling section, the vast majority of product hardware recycling data, and Overall repair and reuse rate of relevant HP hardware sales worldwide [%] 4.2% 4.2% 6.8% all toner and ink cartridge recycling data, reported in past years was associated with the business units that are now a part of HP Inc. Recycling Through 2015, Hewlett-Packard Company reported 1,497,500 tonnes of cumulative computer hardware and supplies recycling combined. ** Data for 2020 and 2021 reflects a more complete data set and enhanced calculation methodology. Beginning in 2021, this data is based Total recycling of hardware and supplies [tonnes, approximate] 129,100 118,500 122,000 on the actual weight of every product. Prior to 2021, data was estimated based on the average weight of each product category. *** Reused material is defined as recovered products or components of products that are used for the same purpose for which they ***** Overall recycling rate of relevant HP hardware sales worldwide [%] 16.9% 16.3% 15.6% were conceived. A reused product/part should replace a new product/part shipment, and the product/part needs to have been used Total recycling, by region [tonnes] by a customer and refurbished before being sent to a different user. Prior to 2021, this data also included some units remarketed to customers that had not been refurbished or used. Beginning in 2021, this data is based on the actual weight of every product. Prior to Americas 52,400 38,800 39,900 2021, data was estimated based on the average weight of each product category. **** The repair and reuse rate is based on the weight of hardware products returned for repair and reuse compared to the weight of our Europe, Middle East, and Africa 60,000 60,200 63,000 product sales during the year. ***** The recycling rate is based on the weight of hardware products returned for recycling compared to the weight of our product sales Asia Pacific and Japan 16,700 19,500 19,100 from seven years ago (the estimated average lifespan of our products). It is impractical for HP to report the recycling rate by product category, as materials are not typically sorted at collection points. This rate also does not include packaging recycling, due to limited data available from recyclers. ****** Includes cartridges returned by customers only. 89 2021 HP Sustainable Impact Report www.hp.com/sustainableimpact
Contents Sustainable Impact Footprint Integrity and human rights Supply chain responsibility Operations Products and solutions Appendix HP materials use* Postconsumer recycled content plastic used in HP products tonnes tonnes Material 2019 2020 2021 2019 2020 2021 % of total plastic Total 990,600 942,000 956,400 use, 2021 Personal systems 9,650 9,780 8,510 14.9% By type Home and office printers 6,760 8,720 12,700 8.6% Electronic products 587,800 562,700 602,700 Original HP Ink Cartridges 5,384 5,767 7,788 53.6% Metal 209,600 202,800 191,700 Original HP and Samsung Toner Cartridges 3,565 2,913 2,414 11.7% Plastic 270,200 251,500 243,900 Large format and industrial graphics printers* 200 310 560 16.1% Other** 108,000 108,400 167,100 Total** 25,560 27,490 32,000 13% Paper 230,600 213,300 193,900 * Packaging 172,200 166,000 159,800 Data for 2019 includes only large format printers. ** Segments for some years do not add up to total due to rounding. Recycled content plastic in HP products and packaging*** 34,200 34,200 32,000 Recycled content metal in HP products**** 4,300 Recycled fiber in HP brand paper and packaging 87,500 100,800 105,700 Certified sustainably managed fiber in HP brand paper and packaging***** 254,600 248,300 227,800 * For 2019 and 2020, the data in this table does not include the following products or packaging for these products: commercial, industrial, or 3D printing products; scanners; personal systems accessories sold separately; spare parts; or the weight of ink and toner in cartridges. For 2021, the data in this table does not include the following products or packaging for these products: PageWide Industrial and 3D printing products; or personal systems accessories and print accessories sold separately. ** For 2019 and 2020, includes wires/cables, PCAs, LCDs, and batteries. For 2021, includes wires/cables, PCAs, LCDs, batteries, and the weight of ink and toner in cartridges, as well as the total mass of refurbished whole products and parts. *** Recycled content plastic in HP products is postconsumer. Although there is recycled content in some plastic packaging, in 2021 that amount is not included in this data because we are working to improve the data-collection process. **** Recycled content metal in HP products is a mix of certified pre-consumer and postconsumer. Data prior to 2021 is not included. ***** This material is renewable. As defined in the Global Reporting Initiative Sustainability Reporting Standards, renewable material is “material derived from plentiful resources that are quickly replenished by ecological cycles or agricultural processes, so that the services provided by these and other linked resources are not endangered and remain available for the next generation.” 90 2021 HP Sustainable Impact Report www.hp.com/sustainableimpact
Contents Sustainable Impact Footprint Integrity and human rights Supply chain responsibility Operations Products and solutions Appendix Appendix 92 About this report 102 United Nations Sustainable Development Goals index 94 Policies and standards 103 Sustainability Accounting 95 Independent accountants’ Standards Board index review report 104 Task Force on Climate-Related 98 ESG material topics Financial Disclosures index 100 Sustainability Bond 105 WEF IBC Stakeholder progress statement Capitalism Metrics index 101 United Nations Global 106 GRI index Compact index 112 Endnotes 91 2021 HP Sustainable Impact Report www.hp.com/sustainableimpact
Contents Sustainable Impact Footprint Integrity and human rights Supply chain responsibility Operations Products and solutions Appendix About this report Metrics and goals External verification HP has reported yearly on its social and In addition to our Sustainable Impact Report, The metrics in this report are HP data, unless Assurance demonstrates our commitment environmental progress since 2001. We provide we report on our programs and progress on our stated otherwise. Collecting data from more than that information in this report describes our in-depth information to stakeholders, including Sustainable Impact website on an ongoing basis. 100 sites globally is complex, and the process performance accurately and completely. customers, industry analysts, socially responsible Our past reports are available online. can vary by issue, business unit, function, and investors, nongovernmental organizations geography. As a result, company-wide metrics In 2021, HP engaged Ernst & Young LLP (EY) to (NGOs), employees, sustainability specialists, can be difficult to define and implement. We perform an independent review of selected governments, and others. Reporting scope continue to standardize our measurement key performance indicators in our 2021 HP and measures systems and metrics. Data is rounded to reflect Sustainable Impact Report. This process was To determine report contents, we consider: the appropriate level of certainty. conducted in accordance with attestation standards established by the American Institute • Our ESG materiality assessment. • This report describes HP’s Sustainable Impact Reporting performance beyond our immediate of Certified Public Accountants. • Input from executives and content experts policies, programs, and goals. It includes HP’s operations is also challenging. We must across HP. performance data through FY2021 (which ended make assumptions when estimating Scope 3 For a full listing of the indicators within the scope October 31, 2021), unless stated otherwise. greenhouse gas (GHG) emissions, product energy of EY’s review, please see the Independent • Input from external stakeholders. • The information in this report is current as of consumption and resulting GHG emissions, the accountants’ review report. • Broader sustainability context and trends. the date of its initial publication. The report percentage of HP products that are recycled, and In addition, the following data received external • External standards and frameworks such as has not been updated to reflect any changes other metrics. Where appropriate, we provide assurance this year: the Global Reporting Initiative Sustainability since that date, including any changes to HP’s context for data to help readers understand Reporting Standards, the UN Global Compact, business or strategy. HP assumes no obligation limitations and draw appropriate conclusions. • Product repair, reuse, and recycling: Through the UN Sustainable Development Goals, the and does not intend to update this report to Forward-looking content reflects approaches, Environmental Resources Management (ERM), Sustainability Accounting Standards Board reflect any such changes. goals, and priorities established by the HP teams HP audited 25 vendor facilities in 14 countries Hardware Sustainability Accounting Standard, • The performance data in this report covers responsible for implementing them. These were during 2021. This included repeat audits of 15 the Task Force on Climate-Related Financial 100% of HP’s global business operations and/ set in consultation with internal, and in some vendor facilities to evaluate their efforts to Disclosures, and the World Economic Forum or revenue, as of HP’s most recently completed cases external, stakeholders, and consider improve performance. Learn more in Product International Business Council Stakeholder fiscal year, unless stated otherwise. leading corporate practices. reuse and recycling vendors. Capitalism Metrics. • All references to years are to HP’s fiscal • Supply chain: HP participates in the Responsible • Global reporting trends and best practices. year, which ends October 31 of the year noted, Business Alliance (RBA) Validated Assessment unless stated otherwise. Feedback Program (VAP), which uses independent external auditors to audit our suppliers’ social • All references to dollars are to U.S. dollars. Your comments and suggestions are important and environmental responsibility performance • “Tonnes” refers to metric tons. to us. Please provide any feedback on this report, against HP Supplier Code of Conduct our performance, or our website using our requirements. Learn more in Supply online form. chain responsibility. 92 2021 HP Sustainable Impact Report www.hp.com/sustainableimpact
Contents Sustainable Impact Footprint Integrity and human rights Supply chain responsibility Operations Products and solutions Appendix Forward-looking statements This document contains forward-looking statements based on current here; the need to manage (and reliance on) third-party suppliers, including catastrophic events; the impact of changes to federal, state, local and expectations and assumptions that involve risks and uncertainties. If the with respect to component shortages, and the need to manage HP’s global, foreign laws and regulations, including environmental regulations and risks or uncertainties ever materialize or the assumptions prove incorrect, multi-tier distribution network, limit potential misuse of pricing programs tax laws; potential impacts, liabilities and costs from pending or potential the results of HP Inc. and its consolidated subsidiaries (“HP”) may differ by HP’s channel partners, adapt to new or changing marketplaces and investigations, claims and disputes; and other risks that are described materially from those expressed or implied by such forward-looking effectively deliver HP’s services; HP’s ability to execute on its strategic plan, herein and in HP’s Annual Report on Form 10-K for the fiscal year ended statements and assumptions. All statements other than statements of including the previously announced initiatives, business model changes October 31, 2021 and that are otherwise described or updated from time to historical fact are statements that could be deemed forward-looking and transformation; execution of planned structural cost reductions and time in HP’s other filings with the Securities and Exchange Commission. statements, including, but not limited to, any statements regarding the productivity initiatives; HP’s ability to complete any contemplated share As in prior periods, the financial information set forth in this document, potential impact of the COVID-19 pandemic and the actions by governments, repurchases, other capital return programs or other strategic transactions; including any tax-related items, reflects estimates based on information businesses and individuals in response to the situation; projections of the competitive pressures faced by HP’s businesses; risks associated with available at the time of preparation of this document. While HP believes net revenue, margins, expenses, effective tax rates, net earnings, net executing HP’s strategy and business model changes and transformation; these estimates to be reasonable, these amounts could differ materially earnings per share, cash flows, benefit plan funding, deferred taxes, successfully innovating, developing and executing HP’s go-to-market from reported amounts in HP’s Quarterly Reports on Form 10-Q for the share repurchases, foreign currency exchange rates or other financial strategy, including online, omnichannel and contractual sales, in an evolving fiscal quarter ended July 31, 2022, Annual Report on Form 10-K for the fiscal items; any projections of the amount, timing or impact of cost savings distribution, reseller and customer landscape; the development and year ended October 31, 2022, and HP’s other filings with the Securities and or restructuring and other charges, planned structural cost reductions transition of new products and services and the enhancement of existing Exchange Commission. The forward-looking statements in this document and productivity initiatives; any statements of the plans, strategies and products and services to meet evolving customer needs and respond to are made as of the date of this document and HP assumes no obligation and objectives of management for future operations, including, but not limited emerging technological trends; successfully competing and maintaining does not intend to update these forward-looking statements. to, our business model and transformation, our sustainability goals, the value proposition of HP’s products, including supplies; challenges our go-to-market strategy, the execution of restructuring plans and any to HP’s ability to accurately forecast inventories, demand and pricing, Throughout this document, we use the definition of “materiality” from the resulting cost savings, net revenue or profitability improvements or other which may be due to HP’s multi-tiered channel, sales of HP’s products to GRI (Global Reporting Initiative) Standards, which is different from the term financial impacts; any statements concerning the expected development, unauthorized resellers or unauthorized resale of HP’s products or our as it has been defined by or construed in accordance with the securities demand, performance, market share or competitive performance relating uneven sales cycle; integration and other risks associated with business laws or any other laws of the U.S. or any other jurisdiction, or as used in the to products or services; any statements concerning potential supply combination and investment transactions; the results of the restructuring context of our financial statements and financial reporting, or our reports constraints, component shortages, manufacturing disruptions or logistics plans, including estimates and assumptions related to the cost (including filed with the U.S. Securities and Exchange Commission. Topics identified challenges; any statements regarding current or future macroeconomic any possible disruption of HP’s business) and the anticipated benefits of as ESG material for the purpose of this document should not be construed trends or events and the impact of those trends and events on HP and its the restructuring plans; the protection of HP’s intellectual property assets, as being material for SEC or other financial reporting purposes. In addition, financial performance; any statements regarding pending investigations, including intellectual property licensed from third parties; the hiring and historical, current, and forward-looking sustainability-related statements claims, disputes or other litigation matters; any statements of expectation retention of key employees; the impact of macroeconomic and geopolitical may be based on standards for measuring progress that are still developing, or belief, including with respect to the timing and expected benefits of trends and events, including the ongoing situation in Ukraine and its regional internal controls and processes that continue to evolve, and assumptions acquisitions and other business combination and investment transactions; and global ramifications and the effects of inflation; risks associated with that are subject to change in the future. and any statements of assumptions underlying any of the foregoing. HP’s international operations; the execution and performance of contracts Forward-looking statements can also generally be identified by words such by HP and its suppliers, customers, clients and partners, including logistical HP’s Investor Relations website at investor.hp.com contains a significant as “future,” “anticipates,” “believes,” “estimates,” “expects,” “intends,” “plans,” challenges with respect to such execution and performance; changes in amount of information about HP, including financial and other information “predicts,” “projects,” “will,” “would,” “could,” “can,” “may,” and similar terms. estimates and assumptions HP makes in connection with the preparation for investors. HP encourages investors to visit its website from time to time, Risks, uncertainties and assumptions include factors relating to the effects of its financial statements; disruptions in operations from system security as information is updated, and new information is posted. The content of of the COVID-19 pandemic and the actions by governments, businesses risks, data protection breaches, cyberattacks, extreme weather conditions HP’s website is not incorporated by reference into this document or in any and individuals in response to the situation, the effects of which may give or other effects of climate change, medical epidemics or pandemics such other report or document HP files with the SEC, and any references to HP’s rise to or amplify the risks associated with many of these factors listed as the COVID-19 pandemic, and other natural or manmade disasters or website are intended to be inactive textual references only. 93 2021 HP Sustainable Impact Report www.hp.com/sustainableimpact
Contents Sustainable Impact Footprint Integrity and human rights Supply chain responsibility Operations Products and solutions Appendix Policies and standards Sustainable Impact Ethics and anti-corruption • Human Rights Policy • Anti-Corruption Policy • Contingent Worker Code of Conduct Employees • Corporate Governance Guidelines • Global Non-Discrimination Policy • Global Business Amenities Policy • Harassment-Free Work Environment Policy • Integrity at HP • Open Door Policy • Partner Code of Conduct Environment • U.S. Public Sector Code of Conduct • Climate Action Policy Position Privacy • Environmental, Health and Safety • Privacy Statement (EHS) Policy • Export of Electronic Waste to Developing Supply chain responsibility Countries Policy • Student and Dispatch Worker Standard • General Specification for the for Supplier Facilities in the People’s Republic Environment (GSE) of China (PRC) • Hardware Recycling Standard • Supplier Code of Conduct • Hardware Reuse Standard • Supply Chain Foreign Migrant Worker Standard • Sustainable Paper and Wood Policy • Supply Chain Social and Environmental • Materials and Chemical Management Policy Responsibility Policy 94 2021 HP Sustainable Impact Report www.hp.com/sustainableimpact
Contents Sustainable Impact Footprint Integrity and human rights Supply chain responsibility Operations Products and solutions Appendix Independent accountants’ review report To the Stockholders and the Board of data management systems and processes used different measurement techniques may also vary. Directors of HP Inc. to generate, aggregate and report the Subject Furthermore, Scope 3 emissions are calculated Matter and performing such other procedures as based on a significant number of estimations We have reviewed HP Inc.’s (“HP”) accompanying we considered necessary in the circumstances. and management assumptions due to the schedules of select sustainability information A review is substantially less in scope than an inherent nature of the Greenhouse Gas Protocol (the Subject Matter) included in Appendix A and examination, the objective of which is to obtain Corporate Value Chain (Scope 3) Accounting and as presented in HP’s 2021 Sustainable Impact reasonable assurance about whether the Subject Reporting Standard criteria. Report for the year ended October 31, 2021 in Matter is in accordance with the Criteria, in all accordance with the criteria also set forth in material respects, in order to express an opinion. The information included in HP’s 2021 Sustainable Accordingly, we do not express such an opinion. Impact Report, other than the Subject Matter, has Ernst & Young LLP Appendix A (the “Criteria”). HP’s management is not been subjected to the procedures applied 303 Almaden Blvd responsible for the Subject Matter in accordance A review also does not provide assurance that San Jose, CA 95110 we became aware of all significant matters that in our review and, accordingly, we express no United States of America with the Criteria. Our responsibility is to express conclusion on it. Tel: +1 (408) 947-5500 a conclusion on the Subject Matter based on would be disclosed in an examination. We believe our review. that our review provides a reasonable basis for Based on our review, we are not aware of any our conclusion. material modifications that should be made to the Our review was conducted in accordance accompanying schedules of select sustainability with attestation standards established by In performing our review, we have also complied the American Institute of Certified Public with the independence and other ethical indicators for the year ended October 31, 2021, in Accountants (AICPA) AT-C section 105, Concepts requirements set forth in the Code of Professional order for the schedules to be in accordance with Common to All Attestation Engagements, and Conduct and applied the Statements on Quality the Criteria. AT-C section 210, Review Engagements. Those Control Standards established by the AICPA. standards require that we plan and perform As described in Appendix A, the Subject Matter our review to obtain limited assurance about is subject to measurement uncertainties whether any material modifications should be resulting from limitations inherent in the nature made to the Subject Matter in order for it to be in and the methods used for determining such May 12, 2022 accordance with the Criteria. A review consists data. The selection of different but acceptable principally of applying analytical procedures, measurement techniques can result in materially making inquiries of persons responsible for the different measurements. The precision of subject matter, obtaining an understanding of the 95 2021 HP Sustainable Impact Report www.hp.com/sustainableimpact
Contents Sustainable Impact Footprint Integrity and human rights Supply chain responsibility Operations Products and solutions Appendix Appendix A—HP Inc. Schedules of Select Sustainability Information Schedule of Select Environmental Metrics for the year ended October 31, 2021 Indicator name Scope Unit of measure Reported value Criteria Scope 1 greenhouse gas (GHG) emissions1 Global Tonnes of carbon dioxide 48,700 World Resources Institute (WRI)/World Business Council for Sustainable Development’s (WBCSD) The Greenhouse Gas equivalents (tCO e) Protocol: A Corporate Accounting and Reporting Standard, Global Reporting Initiative (GRI) Standard 305-1 Direct (Scope 1) 2 Emissions and HP’s Carbon accounting manual2 Scope 2 GHG emissions (location-based method)1 Global tCOe 198,200 WRI/WBCSD’s The Greenhouse Gas Protocol: A Corporate Accounting and Reporting Standard, WRI/WBCSD’s The 2 Greenhouse Gas Protocol Scope 2 Guidance, GRI Standard 305-2 Energy Indirect (Scope 2) GHG Emissions and HP’s Scope 2 GHG emissions (market-based method)1 Global tCOe 110,800 Carbon accounting manual2 2 Scope 3 GHG emissions1, 3 Global tCOe 28,300,000 WRI/WBCSD’s The Greenhouse Gas Protocol Corporate Value Chain (Scope 3) Accounting and Reporting Standard, 2 WRI/WBCSD’s The Greenhouse Gas Protocol Technical Guidance for Calculating Scope 3 Emissions, GRI Standard 305-3 Other Indirect (Scope 3) GHG Emissions and HP’s Carbon accounting manual2 Direct energy use in operations (corresponds to Scope 1 Global MWh5 202,750 GRI Standard 302-1 Energy Consumption Within the Organization and HP management definitions disclosed in the 2021 emissions)4 Sustainable Impact Report Indirect energy use (corresponds to Scope 2 emissions)6 Global MWh5 494,308 Voluntary purchases of renewable energy Global MWh5 261,196 Direct water withdrawal7 Global Cubic meters8 2,556,000 GRI Standard 303-3(a) Water withdrawal and HP management definitions disclosed in the 2021 Sustainable Impact Report 1 Where possible, based on HP Inc.’s reporting timeline and requirements, HP Inc. uses the most up-to-date emission factors available at the time. 2 Carbon accounting manual is available at http://h20195.www2.hp.com/V2/getpdf.aspx/c05179524.pdf. 3 Scope 3 GHG emissions includes the following categories: Category 1 Purchased goods and services, Category 2 Capital goods, Category 3 Fuel- and energy-related activities not included in Scope 1 or Scope 2, Category 4 and 9 Transportation and distribution, Category 6 Business travel, Category 7 Employee commuting, Category 11 Use of sold products, and Category 12 End-of-life treatment of sold products. 4 Direct energy use refers to direct energy consumption in HP’s operations including natural gas, renewable energy generated on-site, diesel/oil/gas/LPG, and transportation fleet similar to the Scope 1 emissions boundary. Refrigerants and perfluorinated compounds are not applicable to the calculation of direct energy use, although they are included in the Scope 1 GHG emissions boundary. 5 Note that 1 MWh equates to 3,600 megajoules. 6 Indirect energy includes purchased electricity and steam and does not include renewable energy purchases. 7 Direct water withdrawal for HP operations. Includes: 1,000 cubic meters of surface water, representing captured rainwater; 13,000 cubic meters of groundwater, representing well water; and 2,542,000 cubic meters of third-party water, representing municipal water and NEWater, which is wastewater sourced from another organization. Note that sewage treatment plant (STP) water is not included within the scope of water withdrawal. 8 Note that 1,000 cubic meters equates to 1 megaliter. 96 2021 HP Sustainable Impact Report www.hp.com/sustainableimpact
Contents Sustainable Impact Footprint Integrity and human rights Supply chain responsibility Operations Products and solutions Appendix Schedule of Supply Chain Audits, Assessments and Findings for the year ended October 31, 2021 Indicator name Scope Reported value Criteria Supplier audits and assessments completed, including percentage RBA9 Production suppliers provide materials and components for product manufacturing and also assemble HP Global In 2021, we completed 161 audits of production, nonproduction, Validated Assessment Program (VAP) audits and product transportation suppliers, and 24 other assessments products. Product transportation suppliers provide services for the shipping and delivery of HP products. of production suppliers. During the year, 88% of production Nonproduction suppliers provide goods and services that do not go into the production of HP products (such supplier audits were third-party certified RBA VAP audits. as staffing, telecommunications, and travel). Audits of production suppliers, product transportation suppliers, suppliers supporting HP manufacturing, and HP manufacturing sites follow the RBA Code of Conduct Audit Protocol 6.0. HP also participates in the RBA VAP, which uses independent external auditors to audit suppliers’ social and environmental responsibility performance against HP Supplier Code of Conduct requirements. The number of audits reported includes those that begin during the reporting year and for which the audit report is received by February of the subsequent year (e.g., received by February 2022 for reports conducted during FY21). Audit reports received after this date are included in the following year’s reported value. Other assessments include health and safety assessments, onboarding assessments, vulnerable worker group (student and foreign worker) assessments, KPI validation assessments, and priority screening assessments. Supplier audit finding rate for major nonconformances and priority findings Global 80 initial audits and full re-audits of production suppliers Immediate priority findings are the most serious type of supplier nonconformance and require immediate conducted in 2021 identified 14 immediate priority findings, action. These would include any priority nonconformances (as defined by the RBA VAP) identified related to equivalent to 0.18 per audit on average, and 528 other the following topics: child labor, forced labor, severe forms of discrimination, health and safety issues posing 10 nonconformances, equivalent to 6.6 per audit on average. immediate danger to life or risk of serious injury, perceived violation of environmental laws posing serious and immediate harm to the community, and falsified pay slips. Other nonconformances include all other priority nonconformances and all major nonconformances as defined by the RBA VAP. Note: Non-financial information is subject to measurement uncertainties resulting from limitations inherent in the nature and the methods used for determining such data. The selection of different but acceptable measurement techniques can result in materially different measurements. The precision of different measurement techniques may also vary. 9 Responsible Business Alliance 10 Other priority nonconformances and major nonconformances represent 3.6% and 96.4% of other nonconformances, respectively. 97 2021 HP Sustainable Impact Report www.hp.com/sustainableimpact
Contents Sustainable Impact Footprint Integrity and human rights Supply chain responsibility Operations Products and solutions Appendix ESG material topics The following table summarizes issues determined to meet the ESG materiality threshold for this report. Issue Description GRI Standards topic(s) Topic boundary Location Climate Action Circular economy Managing product life cycles through design criteria and business models that: promote product Materials Supply chain Circular and net zero carbon economy serviceability and longevity; enable usage as a service; increase repair, reuse, recycling, recycled content, HP operations Product repair, reuse, and recycling and closed material loops; and dematerialize processes and products and reduce waste to landfill. Products and solutions Climate change resilience Working across our value chain and in collaboration with external partners to address the risks, No GRI-specific topics (GHG Supply chain Footprint opportunities, and impacts of climate change on our business, customers, the natural environment, emissions are addressed in HP operations Supply chain responsibility: Environmental impact: and society, with a focus on resilience and adaptation. next row) Products and solutions Greenhouse gas emissions Operations: Our facilities: Greenhouse gas emissions Decarbonization Improving energy efficiency, increasing renewable energy use, and reducing the GHG emissions of Energy Supply chain (first- and second-tier suppliers, Footprint HP's operations, including our owned and leased facilities and auto/aviation fleet, and our supply chain, Emissions Scope 3 emissions) Supply chain responsibility: Environmental impact: including product transportation and logistics. HP operations GHG emissions Operations: Our facilities: GHG emissions Packaging Decreasing the environmental impact of HP packaging, including by reducing materials use, increasing Materials Supply chain Packaging innovation the use of recycled and biodegradable materials, and eliminating deforestation and single-use plastic Products and solutions associated with packaging, where feasible. Paper and Forests Advancing more sustainable printing by HP and our customers through the sourcing, use, and recycling Materials Supply chain Renewable materials of paper and other printed materials, enabling more efficient printing practices, and addressing the Products and solutions Forest positive impacts of deforestation. Product energy efficiency Increasing the energy efficiency of HP products and services, and enabling customers to reduce Energy Products and solutions Products and solutions: Circular and net zero carbon energy use through efficient product fleets. economy: Energy efficiency Human Rights Diversity, equity, and Fostering diversity, equity, and inclusion within our workforce, supply chain, and communities worldwide. Diversity and Equal Opportunity Supply chain Supplier diversity inclusion Building a workforce representative of our customer base and communities. HP operations Diversity, equity, and inclusion Products and solutions Human capital Attracting, retaining, and developing human capital to meet current and future business needs. Employment HP operations Employee engagement Providing compensation, benefits, and wellness programs that support engaged and productive Labor/Management Relations Employee development employees and promote work/life balance, as well as managing the negative impacts of workforce Training and Education Compensation and benefits reductions and relocations. Wellbeing Human rights: operations Respecting human rights throughout our value chain consistent with international norms, remedying Human Rights Assessment HP operations Human rights and downstream human rights abuses in our operations and the customer use of products and services where we Products and solutions caused or contributed to the impact. 98 2021 HP Sustainable Impact Report www.hp.com/sustainableimpact
Contents Sustainable Impact Footprint Integrity and human rights Supply chain responsibility Operations Products and solutions Appendix Issue Description GRI Standards topic(s) Topic boundary Location Human rights: supply chain Monitoring and strengthening social and economic conditions throughout our supply chain, and Human Rights Assessment Supply chain Human rights addressing key areas of risk and opportunity such as working hours and conditions, wages and Supply chain responsibility benefits, capability building, health and safety, humane treatment of workers, prevention of slavery and forced labor, and responsible minerals sourcing. Product and operational Working to create a healthy, safe, and secure working environment in our supply chain and operations, Occupational Health and Safety Supply chain Supply chain responsibility: Health and safety health and safety and for our customers, including managing the use of materials, chemicals, and substances of Customer Health and Safety HP operations Health and safety concern in the manufacturing and use of our products. Products and solutions Product safety Digital Equity Digital divide Working to break down the digital divide that prevents underserved communities from accessing Indirect Economic Impacts Products and solutions Community giving and volunteerism computer hardware and the internet to achieve the digital literacy required to access education, jobs, Education and healthcare needed to thrive. Healthcare Accessibility Governance Corporate governance Maintaining the standards, structures, and processes to ensure the diversity and independence of the No GRI-specific topics HP operations Governance Board of Directors, and the effective governance of HP, including the company's Sustainable Impact Ethics and anti-corruption strategy, goals, and programs. Governance HP 2022 Proxy Statement Data and product security Designing products and processes that protect the collection, processing, analysis, use, storage, No GRI-specific topics Supply chain Cybersecurity transfer, transmission, and sharing of information from unwanted parties, unauthorized access, and HP operations Product security and privacy security threats, including cyberattacks. Products and solutions Ethics and anti-corruption Promoting high ethical standards and combating corruption in all of our business interactions, Anti-corruption Supply chain (interactions with suppliers, business Ethics and anti-corruption including in joint ventures and with business partners, customers, suppliers, and distributors. partners, and contractors) HP operations Products and solutions (interactions with business partners and customers) Privacy Collecting, analyzing, using, storing, transferring, and sharing information in ways that uphold the right Customer Privacy HP operations (employees) Privacy to privacy and personal data protection. Complying with evolving privacy laws and standards. Products and solutions (customers and partners) Public policy engagement Responsibly and proactively engaging with governments regarding regulatory ESG risks and Public Policy HP operations Public policy opportunities, as well as transparency in public policy positions and participation. Transparency and reporting Communicating transparently with our stakeholders about our products, business practices, and Overall report Supply chain Sustainability Bond progress statement progress on our sustainability goals, metrics, and targets. HP operations United Nations Global Compact index Products and solutions United Nations Sustainable Development Goals index Sustainability Accounting Standards Board index Task Force on Climate-Related Financial Disclosures index WEF IBC Stakeholder Capitalism Metrics index GR index 99 2021 HP Sustainable Impact Report www.hp.com/sustainableimpact
Contents Sustainable Impact Footprint Integrity and human rights Supply chain responsibility Operations Products and solutions Appendix Sustainability Bond progress statement Management assertion environmental and social impacts as outlined US$1 billion of net proceeds from the assets funded with the proceeds from HP Inc.’s On June 16, 2021, HP Inc. issued its inaugural in the HP Inc. Sustainable Bond Framework. The Sustainability Bond to eligible projects during the 2021 Sustainability Bond to ensure they met the Sustainability Bond for US$1 billion, with a 2.65% Framework aligns with the four core components period May 1, 2019–October 31, 2021. No proceeds use of proceeds, eligibility criteria, and reporting interest rate and a June 17, 2031, maturity date. of the Green Bond Principles (2018) and the remain unallocated. commitments outlined in the HP Inc. Sustainable After deducting the underwriting discounts Social Bond Principles (2020). Bond Framework. Sustainalytics’ annual review and offering expenses, the net proceeds have Sustainalytics, a leading provider of second-party (available on the Sustainalytics website) was been allocated to eligible Green Projects and As of October 31, 2021, in accordance with opinion services for issuers of sustainability issued in June 2022 and found that HP Inc.’s Social Projects expected to have positive our Framework, we have allocated the nearly bonds, was engaged to evaluate the projects and issued bond met the criteria required. Eligible project categories Eligible project criteria* Net bond proceeds allocation Impact KPIs associated with the eligible projects (US$ millions) Green buildings Investment in building offices and facilities that have achieved or are 232 • Two green buildings funded with the proceeds of this offering achieved LEED Gold certification (Gold or above) or expected to achieve LEED® Gold or above or similar certifications BREEAM Excellent Pollution prevention and control Recycling and remanufacturing services, including sourcing 275 • In 2021, 108,800 tonnes of hardware, 10,300 tonnes of Original HP and Samsung toner cartridges, and 1,500 tonnes of Original of recycled plastics and machinery investment to assist in HP Ink Cartridges were recycled. processing of ocean-bound plastics • In 2020, 106,500 tonnes of hardware, 10,600 tonnes of Original HP and Samsung toner cartridges, and 1,300 tonnes of Original HP Ink Cartridges were recycled. Eco-efficient and/or circular economy products, R&D for printers and personal systems devices that meet the 466 • 77% of personal systems products shipped in 2021 were EPEAT® registered and 85% were ENERGY STAR® qualified. production technologies and processes criteria laid out in the framework, including related to eco labels • 88% of printers shipped in 2021 were EPEAT registered and 94% were ENERGY STAR qualified. and the usage of recycled plastic components ** • Progress in 2021 toward our goal to eliminate 75% of single-use plastic packaging by 2025, compared to 2018: achieved a 44% reduction, from an average of 221 grams/unit in 2018 to 124 grams/unit in 2021. • Progress in 2021 toward our goal to use 30% postconsumer recycled content plastic across HP’s personal systems and print *** product portfolio by 2025: achieved 13%. **** Socioeconomic advancement and empowerment Expenditures toward improving diversity in HP’s workforce 14 • Progress in 2021 toward our goal to double the number of Black/African American executives by 2025, from a 2020 baseline: Target population through the HP Racial Equality and Social Justice Task Force and increased by 33%, compared with 2020, about one-third of the way to achieving the goal. • Girls and women other initiatives, Digital equity and Social Impact programs aimed • As of the end of 2021, 4.1% of U.S. executives were Black/African American. at promoting digital equity and inclusion among women and ***** • People with disabilities Black/African American and other underrepresented minorities • Progress in 2021 toward our goal to accelerate digital equity for 150 million people by 2030, since the beginning of • Communities of color as mentioned in the framework, and skill enhancement programs 2021: Accelerated digital equity for 4.3 million people. • Teachers, trainers, and educators aimed at empowering workers in the supply chain. • Digital equity programs designed to transform lives and communities through greater access to education and economic opportunity. * “Eligible project criteria” describes how HP products or services have a positive impact on the environment, as well as how HP invests in R&D, CAPEX, and OPEX aligned to “clean tech” requirements for raters and rankers such as MSCI, Corporate Knights Global 100, etc. ** Calculated as the percentage of primary plastic packaging (by weight) reduced per unit shipped. Excludes secondary and tertiary packaging components. Includes HP personal systems and printer hardware packaging. Does not include packaging for the following: Graphics Solutions hardware other than PageWide XL and DesignJet printers; 3D printing hardware; print supplies; refurbished products; and accessories such as third-party options, drop in box, and aftermarket options. *** Recycled content plastic (RCP) as a percentage of total plastic used in all HP personal systems, printer hardware, and print cartridges shipped during the reporting year. Total volume excludes brand-licensed products and after-market hardware accessories. Total RCP includes postconsumer recycled plastic, closed-loop plastic, and ocean-bound plastics used in HP products. Personal systems plastic is defined by EPEAT® eco label criteria. Subject to relevant restrictions on the use and distribution of materials destined for recycling and/or recycled feedstocks. **** As a percentage of U.S. personnel with the title of Executive, formerly called Vice President. ***** Our programs aim to accelerate digital equity through providing access to at least one of the following: hardware, connectivity, content, or digital literacy. 100 2021 HP Sustainable Impact Report www.hp.com/sustainableimpact
Contents Sustainable Impact Footprint Integrity and human rights Supply chain responsibility Operations Products and solutions Appendix United Nations Global Compact index HP is a signatory to the United Nations Global Compact (UNGC), a set of voluntary commitments for companies to improve human rights, labor conditions, the environment, and anti-corruption controls. This table links to the sections of this report that address the UNGC’S Ten Principles. Principle Location Principle Location Human rights Environment Principle 1: Businesses should support and respect the protection of Human rights Principle 7: Businesses should support a precautionary approach to Products and solutions internationally proclaimed human rights; and Privacy environmental challenges; Supply chain responsibility Principle 8: undertake initiatives to promote greater environmental Footprint responsibility; and Supply chain responsibility: Environmental impact Our employees Principle 2: make sure that they are not complicit in human rights abuses. Human rights Our facilities Supply chain responsibility Circular and net zero carbon economy Human Rights Policy Principle 9: encourage the development and diffusion of environmentally Supply chain responsibility: Environmental impact friendly technologies. Our facilities Labor Principle 3: Businesses should uphold the freedom of association and the Human rights Circular and net zero carbon economy effective recognition of the right to collective bargaining; Supply chain responsibility Product responsibility Human Rights Policy Anti-Corruption Principle 4: the elimination of all forms of forced and compulsory labor; Human rights Principle 10: Businesses should work against corruption in all its forms, Ethics and anti-corruption including extortion and bribery. Supply chain responsibility Supply chain responsibility Human Rights Policy Anti-Corruption Policy Principle 5: the effective abolition of child labor; and Human rights Supply chain responsibility “To promote higher standards across the areas of human rights, Human Rights Policy labor, environment, and anti-corruption, we endorse the United Nations Principle 6: the elimination of discrimination in respect of employment Human rights Global Compact as a practical framework for the development, and occupation. Supply chain responsibility Diversity, equity, and inclusion implementation, and disclosure of sustainability policies and practices.” Global Non-Discrimination Policy Enrique Lores, president and chief executive officer, HP Inc. 101 2021 HP Sustainable Impact Report www.hp.com/sustainableimpact
Contents Sustainable Impact Footprint Integrity and human rights Supply chain responsibility Operations Products and solutions Appendix United Nations Sustainable Development Goals index HP supports the United Nations Sustainable Development Goals (SDGs). We have existing programs that contribute to progress against 16 of the 17 goals, and will continue to drive innovations that help achieve them. This table references sections of this report that relate to each goal. Goal 1 End poverty in all its forms everywhere Goal 2 End hunger, achieve food security and Goal 3 Ensure healthy lives and promote well- Goal 4 Ensure inclusive and equitable quality HP’s actions Community giving and volunteerism improved nutrition and promote sustainable being for all at all ages education and promote lifelong learning agriculture HP’s actions Supply chain responsibility: Health opportunities for all HP’s actions No major programs at this time and safety, Our employees: Health and safety, HP’s actions Education, Community giving and Wellbeing volunteerism Goal 5 Achieve gender equality and empower all Goal 6 Ensure availability and sustainable Goal 7 Ensure access to affordable, reliable, Goal 8 Promote sustained, inclusive and women and girls management of water and sanitation for all sustainable and modern energy for all sustainable economic growth, full and productive HP’s actions Supplier diversity, Diversity, equity, HP’s actions Operations: Water, Supply chain HP’s actions Renewable energy, Supply chain employment and decent work for all and inclusion responsibility: Water responsibility: Environmental impact HP’s actions Supply chain responsibility, Diversity, equity, and inclusion, Community giving and volunteerism Goal 9 Build resilient infrastructure, promote Goal 10 Reduce inequality within and among Goal 11 Make cities and human settlements Goal 12 Ensure sustainable consumption and inclusive and sustainable industrialization and countries inclusive, safe, resilient and sustainable production patterns foster innovation HP’s actions Supplier diversity, Community giving HP’s actions Community giving and volunteerism HP’s actions Circular and net zero carbon HP’s actions Circular and net zero carbon and volunteerism, Education economy economy, Our facilities Goal 13 Take urgent action to combat climate Goal 14 Conserve and sustainably use the oceans, Goal 15 Protect, restore and promote sustainable Goal 16 Promote peaceful and inclusive societies change and its impacts seas and marine resources for sustainable use of ecosystems, sustainably manage forests, for sustainable development, provide access to HP’s actions Footprint, Supply chain development combat desertification, and halt and reverse land justice for all and build effective, accountable and responsibility: Greenhouse gas emissions, HP’s actions Tackling ocean plastics degradation and halt biodiversity loss inclusive institutions at all levels Operations: Greenhouse gas emissions HP’s actions Forest positive HP’s actions Ethics and anti-corruption, Human rights, Supply chain responsibility Goal 17 Strengthen the means of implementation and revitalize the global partnership for sustainable development HP’s actions HP supports the UN SDGs, the UNGC, the Global Reporting Initiative, and other global efforts to advance sustainable development. 102 2021 HP Sustainable Impact Report www.hp.com/sustainableimpact
Contents Sustainable Impact Footprint Integrity and human rights Supply chain responsibility Operations Products and solutions Appendix Sustainability Accounting Standards Board index This table contains and refers to information related to the Sustainability Accounting Standards Board (SASB) Hardware Sustainability Accounting Standard. Topic Code Metric 2021 reporting Product Security TC-HW-230a.1 Description of approach to identifying and addressing Cybersecurity data security risks in products Product security and privacy Employee Diversity TC-HW-330a.1 Percentage of gender and racial/ethnic group Diversity, equity, and inclusion and Inclusion representation for (1) management, (2) technical staff, and Operations: Data (3) all other employees Product Lifecycle TC-HW-410a.1 Percentage of products by revenue that contain IEC 62474 100% of HP products may contain small amounts of some chemicals on the IEC 62474 Declarable Substance List. HP is committed to meeting all legal and regulatory Management declarable substances requirements, and has gone beyond these requirements to proactively restrict substances of concern. Any remaining uses of substances of concern in products are for applications that lack viable alternatives. All electronics companies still have products claiming Restriction of Hazardous Substances Directive (RoHS) exemptions or using Registration, Evaluation, Authorisation and Restriction of Chemicals (REACH) regulation candidate list substances when there is no viable alternative. For example, 100% of electronics products still contain some amount of lead used in specialized applications that are allowed under RoHS exemptions. See HP’s REACH Article 33 Declarations and the Substances and Materials Requirements (HP Standard 011-01) in the HP General Specification for the Environment for more detail. * TC-HW-410a.2 Percentage of eligible products, by revenue, meeting the 77% of models of HP personal systems shipped in 2021 were EPEAT registered. 88% of models of HP printers shipped in 2021 were EPEAT registered. requirements for EPEAT® registration or equivalent Product certifications and other information TC-HW-410a.3 Percentage of eligible products, by revenue, meeting 85% of models of HP personal systems shipped in 2021 were ENERGY STAR qualified. 94% of models of HP printers shipped in 2021 were ENERGY STAR qualified.* ENERGY STAR® criteria Product certifications and other information TC-HW-410a.4 Weight of end-of-life products and e-waste recovered, During 2021, we recycled 108,800 tonnes of hardware, 10,300 tonnes of Original HP and Samsung Toner Cartridges, and 1,500 tonnes of Original HP Ink Cartridges. percentage recycled Product repair, reuse, and recycling Supply Chain Management TC-HW-430a.1 Percentage of Tier 1 supplier facilities audited in the RBA In 2021, we completed 189 audits of production suppliers, product reuse and recycling vendors, and nonproduction suppliers, as well as 24 other assessments of Validated Audit Process (VAP) or equivalent, by (a) all production suppliers. Travel and factory restrictions and office closures related to COVID-19 decreased our ability to conduct these activities. During the year, 88% of facilities and (b) high-risk facilities production supplier audits were third-party certified, RBA VAP audits. Performance monitoring and evaluation TC-HW-430a.2 Tier 1 suppliers’ (1) non-conformance rate with the Eighty initial audits and full re-audits of production suppliers conducted in 2021 identified 14 immediate priority findings, equivalent to 0.18 per audit on average, and 528 ** RBA Validated Audit Process (VAP) or equivalent, and other nonconformances, equivalent to 6.6 per audit on average. (2) associated corrective action rate for (a) priority Performance monitoring and evaluation non-conformances and (b) other non-conformances Product repair, reuse, and recycling: Vendor audits Materials Sourcing TC-HW-440a.1 Description of the management of risks associated with HP does not currently report this information. the use of critical materials Responsible minerals sourcing describes our program and performance related to conflict minerals, including tantalum and tungsten, which are defined as critical materials by the U.S. National Research Council. * EPEAT data for personal systems is for models registered worldwide, and for printers is for models registered in the United States. ENERGY STAR data for personal systems (version 8.0) is worldwide, and for printers (version 3.0) is for products sold in the United States. All data is for models shipped any time during 2021. ** Immediate priority findings (14 in 2021) include child labor, forced labor, severe forms of discrimination, health and safety issues posing immediate danger to life or risk of serious injury, and perceived violation of environmental laws posing serious and immediate harm to the community. Prior to 2020, we reported non-immediate priority nonconformances and major nonconformances together as major nonconformances. Starting in 2020, to more fully align with RBA Protocol 6.0 definitions, HP began distinguishing non-immediate priority nonconformances from major nonconformances and referring to those as “other nonconformances.” In 2021, the 528 other nonconformances identified included all non-immediate priority nonconformances (3.6% of the total) and all major nonconformances (96.4% of the total), as defined by the RBA Protocol 6.0 and 7.0. 103 2021 HP Sustainable Impact Report www.hp.com/sustainableimpact
Contents Sustainable Impact Footprint Integrity and human rights Supply chain responsibility Operations Products and solutions Appendix Task Force on Climate-Related Financial Disclosures index HP considered recommendations of the Task Force on Climate-Related Financial Disclosures (TCFD) in the development of this report. This index includes links to information about relevant disclosures. Topic Disclosure focus area Disclosure Location* Governance Disclose the organization’s governance around climate-related a) Describe the board’s oversight of climate-related risks and opportunities. Sustainable Impact: Governance risks and opportunities. CDP C1.1, C1.2 b) Describe management’s role in assessing and managing climate-related risks and opportunities. CDP C1.2, C1.3a, C2.2 Strategy Disclose the actual and potential impacts of climate-related risks a) Describe the climate-related risks and opportunities the organization has identified over the short, CDP C2.1, C2.2, C2.3-a, C2.4-a and opportunities on the organization’s businesses, strategy, and medium, and long term. financial planning. b) Describe the impact of climate-related risks and opportunities on the organization’s businesses, CDP C2.2, C2.3a, C2.4a, C3.1, C3.2a, C3.3, C3.4 strategy, and financial planning. c) Describe the resilience of the organization’s strategy, taking into consideration different climate-related CDP C2.3a, C3.1a, C3.2 scenarios, including a 2°C or lower scenario. Risk management Disclose how the organization identifies, assesses, and manages a) Describe the organization’s processes for identifying and assessing climate-related risks. CDP C2.1, C2.2, C2.3a, C11.3 climate-related risks. b) Describe the organization’s processes for managing climate-related risks. CDP C2.1, C2.2a c) Describe how processes for identifying, assessing, and managing climate-related risks are integrated CDP C2.1, C2.2, C3.1 into the organization’s overall risk management. Metrics and targets Disclose the metrics and targets used to assess and manage a) Disclose the metrics used by the organization to assess climate-related risks and opportunities in line CDP C1.3a, C2.3a, C2.4a, C4.1, C4.2, C4.5a, C9.1, C11.3 relevant climate-related risks and opportunities. with its strategy and risk management process. b) Disclose Scope 1, Scope 2, and, if appropriate, Scope 3 greenhouse gas (GHG) emissions, and the Footprint: Carbon and climate impact related risks. Supply chain responsibility: Environmental impact CDP C2.3a, C4.1b, C5.1, C6.1-C6.3, C6.5, C6.10, C7.1-7.1a c) Describe the targets used by the organization to manage climate-related risks and opportunities and CDP C1.3a, C4.1, C4.2 performance against targets. * CDP disclosures refer to HP’s 2021 CDP Climate Change questionnaire responses. 104 2021 HP Sustainable Impact Report www.hp.com/sustainableimpact
Contents Sustainable Impact Footprint Integrity and human rights Supply chain responsibility Operations Products and solutions Appendix World Economic Forum International Business Council Stakeholder Capitalism Metrics index In the development of this report, HP considered the core metrics and disclosures published in the World Economic Forum International Business Council (WEF IBC) white paper, Measuring Stakeholder Capitalism: Towards Common Metrics and Consistent Reporting of Sustainable Value Creation. This index includes links to information about relevant disclosures. Pillar Theme Sub-theme Location Principles of Governance Governing purpose Setting purpose 11, Nominating, Governance and Social Responsibility Committee charter Quality of governing body Governance body composition 11, Governance, HP Board of Directors, HP 2022 Proxy Statement Stakeholder Engagement Material issues impacting stakeholders 12 Ethical behavior Anti-corruption 22, Anti-Corruption Policy Protected ethics advice and reporting mechanisms 21 Risk and opportunity oversight Integrating risk and opportunity into business process 5, 14, 20, 28, 45, 66, HP 2021 10-K Planet Climate change Greenhouse gas emissions 15, 36, 82, 104 TCFD implementation 104 Freshwater availability Water consumption and withdrawal in water-stressed areas 38, HP CDP Water Security response People Dignity and equality Diversity and inclusion (%) 46, HP 2021 EEO-1 Report Pay equality (%) 51 Risk for incidents of child, forced, or compulsory labor 31, 42, 110 Health and wellbeing Health and safety (%) 51, 53, 109 Skills for the future Training provided (#, $) 50 Prosperity Employment and wealth generation Economic contribution 4, 58, HP 2021 10-K (pages 39, 55, 83–87, 88–91) Financial investment contribution HP 2021 10-K (pages 29, 57–59, 86–90) Innovation of better products and services Total R&D expenses ($) HP 2021 10-K (page 39) Community and social vitality Total tax paid HP 2021 10-K (pages 40, 83–87) 105 2021 HP Sustainable Impact Report www.hp.com/sustainableimpact
Contents Sustainable Impact Footprint Integrity and human rights Supply chain responsibility Operations Products and solutions Appendix GRI index HP considered the GRI (Global Reporting Initiative) 2016 Sustainability Reporting Standards (unless noted to be 2018 Standards) in the development of this report. This index includes links to information about relevant Disclosures. Disclosure Location Disclosure Location GRI 102: General Disclosures 102-17 Mechanisms for advice and concerns about ethics 21 Organizational profile Governance 102-1 Name of the organization 4 102-18 Governance structure 11, Governance 102-2 Activities, brands, products, and services 4, HP 2021 10-K 102-19 Delegating authority 11 102-3 Location of headquarters 4 102-20 Executive-level responsibility for economic, environmental, and social topics 11 102-4 Location of operations HP 2021 10-K, HP Supplier List 102-22 Composition of the highest governance body and its committees Governance 102-5 Ownership and legal form 4, HP 2021 10-K 102-23 Chair of the highest governance body Governance 102-6 Markets served HP 2021 10-K 102-24 Nominating and selecting the highest governance body Corporate Governance Guidelines 102-7 Scale of the organization 4, 53, HP 2021 10-K (pages 9, 57) 102-25 Conflicts of interest Corporate Governance Guidelines 46 102-26 Role of highest governance body in setting purpose, values, and strategy 11, Nominating, Governance and Social 102-8 Information on employees Responsibility Committee Charter and other workers A portion of the organization’s work is performed by individuals other than HP employees or other workers supervised by HP, including workers employed or supervised by contractors. 102-31 Review of economic, environmental, and social topics 11 102-9 Supply chain 28 102-33 Communicating critical concerns Contacting the Board 102-10 Significant changes to the organization and its supply chain HP 2021 10-K 102-35 Remuneration policies HP 2022 Proxy Statement 102-11 Precautionary Principle or approach 75 102-36 Process for determining remuneration HP 2022 Proxy Statement 102-12 External initiatives 27, 30, 49, 102 Stakeholder engagement 102-13 Membership of associations Affiliations and memberships 102-40 List of stakeholder groups 11 Strategy 102-41 Collective bargaining Approximately 20,500 employees are represented by an independent trade union, agreements works council, or other employee representative group, or covered by collective 102-14 Statement from senior decision-maker 3 bargaining agreements. 102-15 Key impacts, risks, and opportunities 4, 5, HP 2021 10-K 102-42 Identifying and selecting stakeholders 11 Ethics and integrity 102-16 Values, principles, standards, and norms of behavior 94 106 2021 HP Sustainable Impact Report www.hp.com/sustainableimpact
Contents Sustainable Impact Footprint Integrity and human rights Supply chain responsibility Operations Products and solutions Appendix Disclosure Location Disclosure Location 11 102-56 External assurance 95 Some forms of stakeholder engagement follow a set frequency, such as our annual Material Topics employee Voice Insight Action survey, yearly responses to rating/ranking questionnaires, and supplier audits. Other forms of engagement, such as responses to customer requests GRI 200 Economic Standards Series 102-43 Approach to stakeholder engagement for information about our Sustainable Impact performance, collaboration with NGOs and GRI 201: Economic Performance* industry peers on specific issues, and discussion with policymakers, occur on an ad hoc basis. Examples are included throughout this report. We consider input from customers, GRI 103: Management Approach NGOs, employees, investors, and others in the preparation of our annual Sustainable 103-1 Explanation of the material topic and its Boundary HP 2021 10-K Impact Report. 103-2 The management approach and its components HP Fiscal 2022 Financial Outlook, HP 2021 10-K 11 Our ESG materiality assessment reflects the key topics and concerns that have been raised 103-3 Evaluation of the management approach HP 2021 10-K 102-44 Key topics and concerns raised through stakeholder engagement and various analyses. This report describes how HP 201-1 Direct economic value generated and distributed 4, HP 2021 10-K addresses those issues, including in some cases through engagement with the relevant stakeholder groups. 201-2 Financial implications and other risks and opportunities due to climate change 104, HP 2021 10-K Reporting practice GRI 203: Indirect Economic Impacts 102-45 Entities included in the consolidated financial statements HP 2021 10-K GRI 103: Management Approach 12, 98 103-1 Explanation of the material topic and its Boundary 98 102-46 Defining report content and HP determined the boundary for each material issue in this report based on input and review 103-2 The management approach and its components 34, 58 topic Boundaries from executives and content experts. These assessments considered the value chain phases in which the most relevant impacts and opportunities occur. 103-3 Evaluation of the management approach 34, 58 102-47 List of material topics 98 203-2 Significant indirect economic impacts 34, 58 102-48 Restatements of information Noted in sections as appropriate. GRI 205: Anti-corruption This 2021 HP Sustainable Impact Report includes in-depth information on our approach and GRI 103: Management Approach 102-49 Changes in reporting performance across the broad range of environmental, social, and governance issues. The 103-1 Explanation of the material topic and its Boundary 21, 98 standalone Executive Summary provides a high-level overview of our Sustainable Impact strategy, progress, and vision for the future. 103-2 The management approach and its components 21 102-50 Reporting period 92 103-3 Evaluation of the management approach 21, Anti-Corruption Policy 102-51 Date of most recent report June 2021 205-1 Operations assessed for risks 22 related to corruption Results of HP’s internal assessments of corruption-related risks are confidential. 102-52 Reporting cycle Annual 205-2 Communication and training about anti-corruption policies and procedures 23 102-53 Contact point for questions regarding the report Feedback GRI 300 Environmental Standards Series 102-54 Claims of reporting in accordance This report has been prepared in accordance with the GRI Standards: Core option. GRI 301: Materials with the GRI Standards 102-55 GRI content index 106 GRI 103: Management Approach * Although this GRI Standards topic was not determined to be material in HP’s ESG materiality assessment, we recognize that it is relevant to some stakeholders, and we provide information about HP’s programs and performance in this area. 107 2021 HP Sustainable Impact Report www.hp.com/sustainableimpact
Contents Sustainable Impact Footprint Integrity and human rights Supply chain responsibility Operations Products and solutions Appendix Disclosure Location Disclosure Location 103-1 Explanation of the material topic and its Boundary 75, 98 103-1 Explanation of the material topic and its Boundary 36, 54, 74, 98 103-2 The management approach and its components 75 103-2 The management approach and its components 36, 53, 74, HP Carbon accounting manual 103-3 Evaluation of the management approach 75, HP 2021 10-K 103-3 Evaluation of the management approach 95 301-1 Materials used by weight or volume 90 305-1 Direct (Scope 1) GHG emissions 17 301-2 Recycled input materials used 90 305-2 Energy indirect (Scope 2) GHG emissions 17 301-3 Reclaimed products and their packaging materials 72, 89 305-3 Other indirect (Scope 3) GHG emissions 18 GRI 302: Energy 305-4 GHG emissions intensity 17 GRI 103: Management Approach 305-5 Reduction of GHG emissions 54, 36 103-1 Explanation of the material topic and its Boundary 36, 74, 98 305-6 Emissions of ozone-depleting substances (ODS) 65 103-2 The management approach and its components 53, 74 GRI 306: Waste* 103-3 Evaluation of the management approach 53, 54, 95 GRI 103: Management Approach 302-1 Energy consumption within the organization 64 103-1 Explanation of the material topic and its Boundary 38, 57, 72, 98 302-3 Energy intensity 64 103-2 The management approach and its components 38, 57, 72, Export of Electronic Waste 302-4 Reduction of energy consumption 54 to Developing Countries Policy 302-5 Reductions in energy requirements of products and services 74 103-3 Evaluation of the management approach HP 2021 10-K GRI 303: Water and Effluents* 306-1 Waste generation and significant waste-related impacts 72, 80, 70, 57 GRI 103: Management Approach 306-2 Management of significant waste-related impacts 38, 57, 67 103-1 Explanation of the material topic and its Boundary 38, 56, 98 306-3 Waste generated 57 103-2 The management approach and its components 53, 38, HP Water accounting manual 306-4 Waste diverted from disposal 57, 73 103-3 Evaluation of the management approach 95 306-5 Waste directed to disposal 57, 73 303-1 Interactions with water as a shared resource 16, 38, 64 GRI 308: Supplier Environmental Assessment 303-2 Management of water discharge-related impacts 64, CDP Water security 2021: W1.2b GRI 103: Management Approach 303-3 Water withdrawal 64 103-1 Explanation of the material topic and its Boundary 44, 98 303-4 Water discharge CDP Water security 2021: W1.2b 103-2 The management approach and its components 44, Supply chain responsibility: Our approach, HP Supplier Code of Conduct 303-5 Water consumption CDP Water security 2021: W1.2b GRI 305: Emissions GRI 103: Management Approach * * Although this GRI Standards topic was not determined to be material in HP’s ESG materiality assessment, we recognize that it is relevant to Although this GRI Standards topic was not determined to be material in HP’s ESG materiality assessment, we recognize that it is relevant to some stakeholders, and we provide information about HP’s programs and performance in this area. some stakeholders, and we provide information about HP’s programs and performance in this area. 108 2021 HP Sustainable Impact Report www.hp.com/sustainableimpact
Contents Sustainable Impact Footprint Integrity and human rights Supply chain responsibility Operations Products and solutions Appendix Disclosure Location Disclosure Location We determined that 95% of HP first-tier production suppliers, by spend, had environmental 403-2 Hazard identification, risk assessment, and incident investigation 53 103-3 Evaluation of the management system (EMS) certification (e.g., ISO 14001) for manufacturing sites during 403-3 Occupational health services 53, 51 management approach 2021. Data represents review of 96% of HP production spend. The HP Supplier Code of Conduct requires our suppliers to have an effective EMS for manufacturing sites, 403-4 Worker participation, consultation, and communication on occupational 53, 51 regardless of third-party certification. We audit suppliers to this standard. HP 2021 10-K health and safety 308-1 New suppliers that were screened 95% of HP production suppliers, by spend, have been screened using environmental criteria. 403-5 Worker training on occupational health and safety 53 using environmental criteria This includes new suppliers that were onboarded during 2021. 403-6 Promotion of worker health 53, 51 GRI 400 Social Standards Series GRI 401: Employment 403-7 Prevention and mitigation of occupational health and safety impacts directly 53 linked by business relationships GRI 103: Management Approach 63 103-1 Explanation of the material topic and its Boundary 51, 98 The types of injury HP recorded in calendar year 2021 included head/neck (17% of the total), hands/wrists (17%), lower extremities (17%), arms/shoulders (8%), back (13%), and other (29%). 103-2 The management approach and its components 51 Some injuries are classified using multiple injury types. It is not practical to break down the 103-3 Evaluation of the management approach 21 403-9 Work-related injuries injury data that HP reports by employment contract (employees and contractors that HP manages) or by gender. Despite a comprehensive COVID-19 response plan, HP did experience 401-1 New employee hires and employee turnover 62 several presumptive work-related COVID-19 exposures, which accounted for about 20% of 401-2 Benefits provided to full-time 51 all recordable incidents that we recorded as occupational illnesses. HP experienced zero employees that are not provided to fatalities for the years reported (calendar years 2019–2021). HP does not report absentee rate. temporary or part-time employees This is not practical to report by significant locations of operations, given variation by country. GRI 404: Training and Education GRI 402: Labor/Management Relations GRI 103: Management Approach GRI 103: Management Approach 103-1 Explanation of the material topic and its Boundary 98 103-1 Explanation of the material topic and its Boundary 98 49 103-2 The management approach and its components 49 Each year, HP leaders identify human capital development priorities to help advance our business and human resource strategies. This involves analyzing the capabilities and skills 103-3 Evaluation of the management approach 49 we need to deliver on culture and talent development, business transformation, leadership 402-1 Minimum notice periods regarding agility, employee engagement, and innovation. This needs assessment is informed by data HP does not currently disclose this information. 103-2 The management approach sources such as our employee engagement survey, succession planning, and business operational changes and its components performance metrics. Employees also work with their managers to create annual personal GRI 403: Occupational Health and Safety 2018 development goals that build on their strengths, improve performance, and progress their careers. We track and measure employee development at program and audience levels, GRI 103: Management Approach with clear targets for both. We systematically evaluate all formal development programs 103-1 Explanation of the material topic and its Boundary 31, 51, 53, 98 through our learning management system, measuring improvements in employee performance and business impact. 103-2 The management approach and its components 51, HP Environmental, Health and Safety Policy 103-3 Evaluation of the management approach 49 103-3 Evaluation of the management approach 53 404-1 Average hours of training per year per employee 49 403-1 Occupational health and safety management system 53 404-2 Programs for upgrading employee skills and transition assistance programs 50 109 2021 HP Sustainable Impact Report www.hp.com/sustainableimpact
Contents Sustainable Impact Footprint Integrity and human rights Supply chain responsibility Operations Products and solutions Appendix Disclosure Location Disclosure Location GRI 405: Diversity and Equal Opportunity 103-1 Explanation of the material topic and its Boundary 98 GRI 103: Management Approach 31, Supply chain responsibility: Our approach, 103-1 Explanation of the material topic and its Boundary 46, 98 103-2 The management approach and its components HP Human Rights Policy, HP 2020 Human Rights Update, HP Modern Slavery Act 103-2 The management approach and its components 46 Transparency Statement 103-3 Evaluation of the management approach 46, HP 2021 10-K 103-3 Evaluation of the management approach 40, 24 405-1 Diversity of governance bodies and employees 46, 61, HP Board of Directors, HP 2022 42 Proxy Statement HP discloses the rates of conformance in production supplier sites audited, as well as the GRI 406: Non-discrimination data needed to calculate the approximate number of nonconformances. To support rights 408-1 Operations and suppliers at in this area, HP has controls to meet student and young worker requirements. In China, no GRI 103: Management Approach significant risk for incidents of child labor more than 20% of the direct labor supporting the manufacturing of HP products, packaging, 103-1 Explanation of the material topic and its Boundary 98 parts, components, subassemblies, and materials at any given facility should consist of student workers at any point in time. We track performance in this area through our KPI 103-2 The management approach and its components 40, Supply chain responsibility: program and student worker assessments. Our approach, HP 2020 Human Rights Update GRI 409: Forced or Compulsory Labor 103-3 Evaluation of the management approach 24, HP 2021 10-K GRI 103: Management Approach 42 103-1 Explanation of the material topic and its Boundary 31, 98 406-1 Incidents of discrimination HP discloses the rates of conformance in production supplier sites audited, as well as and corrective actions taken the data needed to calculate the approximate number of nonconformances. Due to 31, 23, Supply chain responsibility: Our confidentiality, HP does not report details regarding specific incidents of discrimination 103-2 The management approach and its components approach, HP Human Rights Policy, HP 2020 during the reporting period. Human Rights Update, HP Modern Slavery Act Transparency Statement GRI 407: Freedom of Association and Collective Bargaining 103-3 Evaluation of the management approach 24, 40 GRI 103: Management Approach 103-1 Explanation of the material topic and its Boundary 98 409-1 Operations and suppliers at 31, 42 significant risk for incidents of forced or HP discloses the rates of conformance in production supplier sites audited, as well as the 103-2 The management approach and its components 29, Supply chain responsibility: compulsory labor data needed to calculate the approximate number of nonconformances. See Combating Our approach modern slavery for more detail about our approach in this area. 103-3 Evaluation of the management approach 42 GRI 412: Human Rights Assessment 42 GRI 103: Management Approach 407-1 Operations and suppliers in which HP discloses the rates of conformance in production supplier sites audited, as well as the data 103-1 Explanation of the material topic and its Boundary 23, 98 the right to freedom of association and needed to calculate the approximate number of nonconformances. We require suppliers to collective bargaining may be at risk train workers to understand their rights concerning collective bargaining, and to allow workers 103-2 The management approach and its components 24, HP Human Rights Policy, HP 2020 to associate freely without fear of discrimination, reprisal, intimidation, or harassment. Human Rights Update GRI 408: Child Labor 103-3 Evaluation of the management approach 40, 24, HP 2020 Human Rights Update GRI 103: Management Approach 412-1 Operations that have been subject to human rights reviews or impact assessments 40 110 2021 HP Sustainable Impact Report www.hp.com/sustainableimpact
Contents Sustainable Impact Footprint Integrity and human rights Supply chain responsibility Operations Products and solutions Appendix Disclosure Location Disclosure Location 412-2 Employee training on human rights policies or procedures 24 GRI 416: Customer Health and Safety 412-3 Significant investment agreements and contracts that include human rights 31 GRI 103: Management Approach clauses or that underwent human rights screening 103-1 Explanation of the material topic and its Boundary 82, 98 GRI 413: Local Communities* 103-2 The management approach and its components 82 GRI 103: Management Approach 103-3 Evaluation of the management approach 82 103-1 Explanation of the material topic and its Boundary 6, 98 416-1 Assessment of the health and safety impacts of product and service categories 82 103-2 The management approach and its components 6, 38, 58, HP Global Charitable GRI 418: Customer Privacy Contributions Policy 103-3 Evaluation of the management approach 58, HP 2022 Proxy Statement GRI 103: Management Approach 413-1 Operations with local community engagement, impact assessments, and 6, 38, 58 103-1 Explanation of the material topic and its Boundary 25, 83, 98 development programs 103-2 The management approach and its components 25, 83, Privacy, HP Privacy Statement GRI 414: Supplier Social Assessment 103-3 Evaluation of the management approach 25 GRI 103: Management Approach 418-1 Substantiated complaints concerning breaches of customer privacy and losses 26 103-1 Explanation of the material topic and its Boundary 29, 98 of customer data 29, 39, Supply chain responsibility: Other material issuesˆ 103-2 The management approach and its components Our approach Corporate governance 103-3 Evaluation of the management approach 40, 39 GRI 103: Management Approach 414-1 New suppliers that were 95% of HP production suppliers, by spend, have been screened using social criteria. 103-1 Explanation of the material topic and its Boundary 98 screened using social criteria This includes new suppliers that were onboarded during 2021. 23, 21, Governance, HP 2022 Proxy GRI 415: Public Policy 103-2 The management approach and its components Statement GRI 103: Management Approach 103-3 Evaluation of the management approach Governance, HP 2022 Proxy Statement 103-1 Explanation of the material topic and its Boundary 27, 98 Data and product security 103-2 The management approach and its components 27, HP Political Contributions Policy GRI 103: Management Approach 27, HP Corporate Political Contributions, 103-1 Explanation of the material topic and its Boundary 83, 98 103-3 Evaluation of the management approach HP Employee PAC Contributions, U.S. lobbying 103-2 The management approach and its components 83 expenditures 27, HP Political Contributions Policy, HP 103-3 Evaluation of the management approach 83 415-1 Political contributions Employee PAC Contributions, U.S. Lobbying Expenditures * ^ Although this GRI Standards topic was not determined to be material in HP’s ESG materiality assessment, we recognize that it is relevant to This includes issues determined to meet the ESG materiality threshold for this report that are not already addressed by the GRI Standards some stakeholders, and we provide information about HP’s programs and performance in this area. topics in the index above. 111 2021 HP Sustainable Impact Report www.hp.com/sustainableimpact
Contents Sustainable Impact Footprint Integrity and human rights Supply chain responsibility Operations Products and solutions Appendix Endnotes Additional information about the data presented in this report is available upon request. About HP shipped during the reporting year. Total volume excludes brand-licensed products and after-market hardware accessories. Total RCP includes postconsumer recycled plastic, closed-loop plastic, and ocean-bound plastics used in HP products. Personal systems plastic is 1 As of October 31, 2021. defined by EPEAT® eco label criteria. Subject to relevant restrictions on the use and distribution of materials destined for recycling and/or 2 Ibid. recycled feedstocks. 10 Calculated as the percentage of primary plastic packaging (by weight) reduced per unit shipped. Excludes secondary and tertiary Sustainable Impact packaging components. Includes HP personal systems and printer hardware packaging. Does not include packaging for the following: Graphics Solutions hardware other than PageWide XL and DesignJet printers; 3D printing hardware; print supplies; refurbished products; Sustainable Impact strategy and accessories such as third-party options, drop in box, and aftermarket options. 1 In 2021, we tracked over US$3.5 billion in new sales (total contract value) in which sustainability criteria were a known consideration and 11 Zero-waste operations: eliminate nonhazardous waste to landfill in all HP direct operations by 2025. Includes all HP-owned and -managed were supported actively by HP’s Sustainability and Compliance organization and Commercial organization. sites worldwide. Zero waste is defined by the UL or TRUE certification standards. 2 HP estimates supplier GHG emissions avoided based on supplier-reported energy savings from specific energy-efficiency projects 12 Fiber by weight will be 1) certified to rigorous third-party standards, 2) recycled, or 3) balanced by forest restoration, protection, and other (compared to projected energy use without those projects) and supplier use of zero-emissions energy. This energy data is converted into initiatives through HP’s Forest Positive Framework. GHG emissions avoided using emission factors for electricity and fuel types. This data also includes estimates of product transportation- 13 HP brand paper and paper-based packaging for home and office printers and supplies, PCs, and displays are derived from certified related GHG emissions avoided, related to specific initiatives to improve product transportation efficiency. and recycled sources, with a preference for Forest Stewardship Council® (FSC®) certification. Packaging is the box that comes with the 3 All HP brand paper is derived from certified sources; paper-based packaging for PCs, displays, home and office print, and supplies is product and all paper-based materials inside the box. reported by suppliers as recycled or certified, with a minimum of 97% by volume verified by HP. Packaging is the box that comes with the 14 We calculate the annual tonnage for paper used in our products and print services that will be addressed through projects with civil product and all paper-based materials inside the box. Packaging for commercial, industrial, and 3D products, scanners, personal systems society forestry organizations to counteract possible deforestation by taking the estimated annual total tonnage of paper consumed in accessories, and spare parts is not included. the use of our printing products and print services minus the weight of such paper that we mitigate internally, through our responsible 4 Absolute reduction of Scope 1, 2, and 3 GHG emissions compared to 2019. Excludes non-HP paper consumed during product use. sourcing programs. Non-HP paper represented 96% of our total fiber footprint during 2021. See HP Forest positive accounting manual. 5 Moving forward, this will be replaced by a new goal, which has been submitted to and is awaiting validation by SBTi. This will support our 15 All HP brand paper is derived from certified sources; paper-based packaging for PCs, displays, home and office print, and supplies is broader goal to achieve carbon-neutral HP operations by 2025. reported by suppliers as recycled or certified, with a minimum of 97% by volume verified by HP. Packaging is the box that comes with the 6 Product-use GHG emissions intensity describes the performance of our portfolio, taking into account changes to product mix and product and all paper-based materials inside the box. Packaging for commercial, industrial, and 3D products, scanners, personal systems business growth. HP product-use GHG emissions intensity measures per-unit GHG emissions during anticipated product lifetime use. accessories, and spare parts is not included. These values are then weighted by contribution of personal systems and printing products to overall revenue in the current year. These 16 This data does not include participation in RBA audits. Participation in our supply chain sustainability programs is quantified by those emissions represent more than 99% of HP product units shipped each year, including notebooks, tablets, desktops, mobile computing programs that go beyond audits to build supplier capabilities to meet our standards. This includes deep-dive assessment, weekly devices, workstations, and displays; HP InkJet, LaserJet, DesignJet, Indigo, Scitex, and Jet Fusion 3D printers; and scanners. Although HP reporting of labor metrics, procurement engagement through our supplier Sustainability Scorecard, and in-depth coaching and updated its carbon footprint calculation methodology in 2021 (see the methodological updates box on page 15), we continue to calculate workshops tailored to supplier risks. this metric using the original methodology, for comparability with past years. 17 This replaces and expands on our prior goal to develop skills and improve the wellbeing of 500,000 factory workers by 2025, since the 7 Percentage of HP’s total annual product and packaging content, by weight, that will come from recycled and renewable materials and beginning of 2015. Progress through 2021 against that goal includes a total of 349,000 factory workers: 77,800 factory workers in 2015; reused products and parts by 2030. 45,700 in 2016; 119,900 in 2017; 12,000 in 2018; 11,000 in 2019; 46,000 in 2020; and 37,000 in 2021. Prior to 2020, data included production 8 Percentage of HP’s total annual product and packaging content, by weight, that comes from recycled and renewable materials and reused supplier workers only. In 2020, we expanded the scope of our program to also include nonproduction supplier workers and workers at HP- products and parts. 2021 data does not include the following products or packaging for these products: PageWide Industrial and 3D controlled manufacturing facilities. Total does not equal sum of data for each year due to rounding. printing products; or personal systems accessories and print accessories sold separately. 18 Labor-related human rights are defined as modern slavery, working hours, pay, and safety. Assure based on key performance metrics 9 Recycled content plastic (RCP) as a percentage of total plastic used in all HP personal systems, printer hardware, and print cartridges based on evidence and analysis of published disclosures, mandated data submittals, certifications, audits, etc. 112 2021 HP Sustainable Impact Report www.hp.com/sustainableimpact
Contents Sustainable Impact Footprint Integrity and human rights Supply chain responsibility Operations Products and solutions Appendix 19 “Leadership” is defined as director level and up at HP. Privacy 20 As a percentage of U.S. personnel with the title of Executive, formerly called Vice President. 1 HP’s ISO 27001 certifications in 2021 include: DaaS Remote Monitoring & Management Services and within DaaS Proactive Management 21 Annually, HP employees fill out a survey called Voice Insight Action (VIA) to help us understand overall employee engagement including with TechPulse; Managed Print Services Remote Monitoring and Management Services; HP UK Development Limited; Indigo Presses, their sense of belonging in the company. Servers, and Software Solutions; PSGO Image Load Services; PSGO Dynamic Configuration Service; HP Inc. UK Limited; Customer Service Life Cycle Solutions (Bentonville, AR); Customer Support Break/Fix (APJ); Customer Support Break/Fix (EMEA); HP India Sales Pvt. Ltd. 22 Excludes new hires joining HP after February 1, 2021 (although all new hires are given 30 days to complete Integrity at HP New Hire training as part of their mandatory onboarding process). 2 A cybersecurity event requires external disclosure if compelled by applicable laws or regulations. 23 Our programs aim to accelerate digital equity through providing access to at least one of the following: hardware, connectivity, content, or Supply chain responsibility digital literacy. 24 We enable better learning outcomes by supporting education through provision of learning and digital literacy programs and solutions. Approach 25 Includes valuation of employee volunteer hours, employee donations, HP Foundation match, and HP Foundation grants. 1 HP uses the terms “production suppliers,” “product transportation suppliers,” and “nonproduction suppliers” throughout this report. ESG materiality “Production suppliers” provide materials and components for our product manufacturing and also assemble HP products, and are the primary focus of our HP Supplier Code of Conduct audits, assessments, KPI program, Sustainability Scorecard, and capability-building 1 This ESG materiality assessment followed the “double materiality” principle, which considers both how topics impact a company and how initiatives. “Product transportation suppliers” provide services for the shipping and delivery of HP products. Learn more in Supply chain the company impacts the environmental, social, and economic aspects of those topics. responsibility: Environmental impact. “Nonproduction suppliers” provide goods and services that do not go into the production of HP Footprint products (such as staffing, telecommunications, and travel). These suppliers are a significant focus of our supplier diversity efforts. 2 Retained, existing, and new sales are tracked through internal HP processes that identify customer requests related to sustainability and 1 Carbon and water footprint data presented in this section related to our production suppliers (except for HP brand paper) is calculated supply chain responsibility. Sales values take into account total contract values. using product life cycle assessment-based estimates for materials extraction through manufacturing and product transportation. 3 This data does not include participation in RBA audits. Participation in our supply chain sustainability programs is quantified by those Production supplier GHG emissions and water withdrawal data presented on page 44 is based on a different methodology. See programs that go beyond audits to build supplier capabilities to meet our standards. This includes deep-dive assessment, weekly Methodological updates on page 15 for detail about nonproduction suppliers. reporting of labor metrics, procurement engagement through our supplier Sustainability Scorecard, and in-depth coaching and workshops tailored to supplier risks. Carbon and climate impact 4 This replaces and expands on our prior goal to develop skills and improve the wellbeing of 500,000 factory workers by 2025, since the 1 Absolute reduction of Scope 1, 2, and 3 GHG emissions compared to 2019. Excludes non-HP paper consumed during product use. beginning of 2015. Progress through 2021 against that goal includes a total of 349,000 factory workers: 77,800 factory workers in 2015; Water 45,700 in 2016; 119,900 in 2017; 12,000 in 2018; 11,000 in 2019; 46,000 in 2020; and 37,000 in 2021. Prior to 2020, data included production supplier workers only. In 2020, we expanded the scope of our program to also include nonproduction supplier workers and workers at HP- 1 Methodological updates to improve the accuracy of our carbon footprint calculations also impacted calculations in the following water controlled manufacturing facilities. Total does not equal sum of data for each year due to rounding. footprint categories: water consumption in HP supply chain—direct use in operations, water consumption in HP supply chain associated 5 Labor-related human rights are defined as modern slavery, working hours, pay, and safety. Assure based on key performance metrics with the generation of electricity, and water consumption associated with the generation of electricity used by HP products. Please see based on evidence and analysis of published disclosures, mandated data submittals, certifications, audits, etc. Methodological updates on page 15 for more detail. Integrity and human rights Human rights 1 The term “forced labor” refers to situations in which people are coerced to work against their will, either overtly through violence or intimidation, or by more subtle means such as accumulated debt, retention of identity papers, and threats of denunciation. HP forbids any Ethics and anti-corruption forced, bonded, or indentured labor, involuntary prison labor, slavery, or trafficking of persons within its supply chain. 1 Excludes new hires joining HP after February 1, 2021 (although all new hires are given 30 days to complete Integrity at HP New Hire training 2 We use these terms interchangeably when describing HP’s existing programs and policies. as part of their mandatory onboarding process). Human rights Responsible minerals sourcing 1 “Conflict minerals” refers to the mineral precursors of the metals tantalum, tin, tungsten, and gold (3TG) as defined in the U.S. Securities 1 Excludes new hires joining HP after February 1, 2021 (although all new hires are given 30 days to complete Integrity at HP New Hire training and Exchange Commission (SEC) rule requiring a conflict minerals disclosure. Revenue from mining these minerals in the Democratic as part of their mandatory onboarding process). Republic of the Congo (DRC) and adjoining countries has been widely linked to funding for groups engaged in extreme violence and human rights atrocities. 113 2021 HP Sustainable Impact Report www.hp.com/sustainableimpact
Contents Sustainable Impact Footprint Integrity and human rights Supply chain responsibility Operations Products and solutions Appendix Supplier diversity Operations 1 Data is for the 12 months ending September 30 of the year noted. Figures are for purchases in the United States and Puerto Rico from U.S.-based businesses. Suppliers are categorized as minority-owned or women-owned, not both. These categories include all sizes of Our employees businesses. 1 As of October 31, 2021. 2 HP’s allocatable indirect spend is calculated based on suppliers’ spending with diverse suppliers and their dollar volume of HP’s business 2 McKinsey & Company, 2020, “Diversity wins: How inclusion matters”, https://www.mckinsey.com/featured-insights/diversity-and-inclusion/ compared to their total revenue. diversity-wins-how-inclusion-matters. Environmental impact 3 “Leadership” is defined as director level and up at HP. 1 Intensity is calculated as the portion of first-tier production and product transportation suppliers’ reported GHG emissions attributable 4 Annually, HP employees fill out a survey called Voice Insight Action (VIA) to help us understand overall employee engagement, including to HP, divided by HP’s annual revenue. This method normalizes performance based on business productivity. Intensity is reported as a their sense of belonging in the company. three-year rolling average to decrease the impact of variance year over year and highlight longer-term trends. Production supplier GHG 5 As a percentage of U.S. personnel with the title of Executive, formerly called Vice President. emissions include Scope 1 and Scope 2. 6 As of October 31, 2021. 2 This continues a goal from before the separation of Hewlett-Packard Company on November 1, 2015, extending the goal to 2025. Includes 7 Ibid. data from suppliers associated with HP Inc. and HP Inc. pre-separation business units. 8 Estimate is based on 1.09 million hours of formal organized learning, 0.55 million hours of self-directed learning, and more than 0.11 million 3 HP estimates supplier GHG emissions avoided based on supplier-reported energy savings from specific energy-efficiency projects hours of manufacturing and technology training. (compared to projected energy use without those projects) and supplier use of zero-emissions energy. This energy data is converted into GHG emissions avoided using emission factors for electricity and fuel types. This data also includes estimates of product transportation- 9 In the United States, the minimum amount of vacation time for salaried exempt employees is three weeks per year. Vacation time varies in related GHG emissions avoided, related to specific initiatives to improve product transportation efficiency. other locations. 4 Ibid. 10 In the United States, salaried exempt employees are eligible for paid sick time to cover occasional illness or until short-term disability is approved. Policies vary in other locations. 5 These are the total GHG emissions reductions and financial savings reported by suppliers through CDP, not amounts attributable to HP. 11 During calendar year 2021, HP documented 71 recordable incidents, 35 lost workday cases, and 1,234 lost workdays. 6 Based on HP consumer and commercial PCs and displays shipped in 2021. 100% renewable electricity achieved by purchasing both Renewable Energy Credits (RECs) and International Renewable Energy Credits (I-RECs) as defined by EPEAT®. Our facilities 7 Due to COVID-19, in limited cases SmartWay partners were not available during 2021. 1 Depending on the project, our sites may achieve certification for LEED Building Design and Construction (LEED BD+C), LEED Interior Performance monitoring and evaluation Design and Construction (LEED ID+C), or LEED Building Operations and Maintenance (LEED O+M). Learn more. 2 This includes BREEAM International Refurbishment and Fit Out (RFO). Learn more. 1 These include child labor, forced labor, severe forms of discrimination, health and safety issues posing immediate danger to life or risk of serious injury, and perceived violation of environmental laws posing serious and immediate harm to the community. We take such findings 3 About GHG emissions data: This report includes Scope 1, 2, and 3 GHG emissions data from HP’s operations, transportation fleet, very seriously and require suppliers to cease all related practices and report corrective actions taken within 30 days of the original audit. and employee business travel, calculated according to the Greenhouse Gas Protocol of the World Business Council for Sustainable Recruitment fees must be reimbursed within 90 days of discovery and are verified by an on-site inspection within 180 days of discovery. Development (WBCSD) and World Resources Institute (WRI). See the HP 2021 carbon footprint for more details and an overview of We follow up closely to ensure that all required corrective actions are completed, and visit sites to confirm resolution. Immediate priority emissions across the value chain. findings do not necessarily involve termination of the supplier; we work with suppliers as appropriate to improve their performance and • Scope 1 emissions include those from the direct use of natural gas, diesel fuel, refrigerants, and PFCs in operations and from fuel used worker conditions in these areas. by HP’s transportation fleet. 2 Immediate priority findings (14 in 2021) include child labor, forced labor, severe forms of discrimination, health and safety issues posing • Scope 2 emissions are primarily from purchased electricity used in HP’s operational real estate. immediate danger to life or risk of serious injury, and perceived violation of environmental laws posing serious and immediate harm • Scope 3 emissions reported in this section result from employee business travel by commercial airlines and from commuting. to the community. Prior to 2020, we reported non-immediate priority nonconformances and major nonconformances together as Data in this section for 2019–2021 uses the market-based method. In the data summary, we also include 2019–2021 data using the major nonconformances. Starting in 2020, to more fully align with RBA Protocol 6.0 definitions, HP began distinguishing non-immediate location-based method. See note * on page 18 for additional detail. priority nonconformances from major nonconformances and referring to those as “other nonconformances.” In 2021, the 528 other 4 Moving forward, this will be replaced by a new goal, which has been submitted to and is awaiting validation by SBTi. This will support our nonconformances identified included all non-immediate priority nonconformances (3.6% of the total) and all major nonconformances broader goal to achieve carbon neutral HP operations by 2025. (96.4% of the total), as defined by the RBA Protocol 6.0 and 7.0. 5 As applicable, HP uses RECs in Canada and the United States, GOs in most European countries, and I-RECs in most Asian countries and other countries not covered by RECs and GOs. 114 2021 HP Sustainable Impact Report www.hp.com/sustainableimpact
Contents Sustainable Impact Footprint Integrity and human rights Supply chain responsibility Operations Products and solutions Appendix 6 NEWater (ultra-purified wastewater used in manufacturing operations, landscaping, and plumbing in Singapore) is currently our only recycling, product quality, and usage trends (see hp.com/go/EvoCycle-HP-2021). The LCA leverages a 2021 SpencerLab Reliability study, reused source. commissioned by HP, comparing Original HP CF226X Toner Cartridges with HP EvoCycle CF226XR Toner Cartridges. For details, see 7 Beginning in 2019, HP directly tracks nonhazardous waste data for the company’s highest energy-consuming sites globally (12,900 tonnes www.spencerlab.com/reports/HP-EvoCycle2021.pdf. The LCA concludes that the HP EvoCycle has a 37% lower carbon footprint than the in 2021), which account for 90% of HP’s operational waste. These sites provide a representative sample of the main types of facilities in our HP CF226A in the production phase and a 1.8% lower carbon footprint when looking at the entire life cycle of the cartridge. portfolio from across the regions where we operate. 11 Weight percentage where toner and components considered by HP to be critical to print quality (cleaning blade, imaging drum, developer 8 Zero-waste operations: eliminate nonhazardous waste to landfill in all HP direct operations by 2025. Includes all HP-owned and -managed blade, developing roller, and charge roller) are excluded: 36% reused, 40% recycled. Total 76% reused/recycled. Absolute weight sites worldwide. Zero waste is defined by the UL or TRUE certification standards. percentage excluding toner: 21% reused; 24% recycled. Total 45% reused/recycled. 12 See endnote 10 above. Community giving and volunteerism 13 Moderately water-resistant with Original HP Bright Office Inks. Performance varies based on printer and print profile. Water resistance 1 The HP Foundation is a nonprofit, 501(c)(3) organization. testing by HP Image Permanence Lab on a range of HP media, following ISO 18935 method. For more information, see HPLFMedia.com/ 2 Includes valuation of employee volunteer hours, employee donations, HP Foundation match, and HP Foundation grants. printpermanence. 3 Hourly rate is based on type of volunteering: US$195/hour for board, service corp, pro bono, and skills based; US$28.54/hour for hands-on 14 HP and non-HP personal systems devices. and undetermined. Valuation of non-U.S. volunteering hours is adjusted using World Bank data for purchasing power differences 15 Natural Capital Partners, The CarbonNeutral Protocol, 2020 edition, https://www.carbonneutral.com/thecarbonneutral-protocol. across countries. 16 Based on results of third-party (WSP) research for HP of OEM MPS providers with carbon neutral offers as of June 2020. “Comprehensive” Products and solutions means the planet’s only globally certified carbon neutral MPS service that covers life cycle emissions due to raw material extraction; manufacturing; transportation; use of HP printers, Original HP supplies, and paper; and end of service. 17 Refers to the emissions from the HP branded fleet over the term of the Managed Print Service. Circular and net zero carbon economy 18 LCAs are verified by an independent third party to conform to ISO 14040 and ISO 14044, and are used by HP to understand the total carbon 1 Percentage of HP’s total annual product and packaging content, by weight, that will come from recycled and renewable materials and footprint for HP printing and imaging devices, paper, and supplies. Using this data, along with the information unique to each customer, we reused products and parts by 2030. calculate the total carbon emissions for a customer’s fleet. Data is third-party verified throughout the process and the HP Carbon Neutral 2 Percentage of HP’s total annual product and packaging content, by weight, that comes from recycled and renewable materials and reused Service is certified to the CarbonNeutral Protocol. products and parts. 2021 data does not include the following products or packaging for these products: PageWide Industrial and 3D 19 Based on plan usage, internet connection to eligible HP printer, valid payment method, email address, and delivery service in your printing products; or personal systems accessories and print accessories sold separately. geographic area. 3 Recycled content plastic in HP products is certified postconsumer. Although there is recycled content in some plastic packaging, in 2021 20 Program availability varies due to local postal or environmental regulations. For details, see www.hp.com/hprecycle. that amount is not included in this data because we are working to improve the data-collection process. 21 Based on monthly subscription cost of HP Instant Ink 700-page plan without purchase of additional sets of pages compared to cost 4 We conduct product carbon footprints (PCFs), a subset of life cycle assessment, of business HP desktops, notebooks, tablets, per page to print ISO/IEC 24711 pages on most in-class, traditional A4 color inkjet cartridge printers and MFPs priced <$385 AUD, <$420 workstations, thin clients, All-in-One computers, and displays to better understand performance of individual products and our overall CAD, <$333 NZD, and <$350 USD using original standard-capacity cartridges. Average CPP per country used to determine percent portfolio. These estimate total GHG emissions associated with a product over its lifetime and include emissions from materials extraction, savings versus CPP for HP Instant Ink. Sale prices not considered for this study. HP Ink Advantage printers and printers which only use XL manufacturing, distribution, use, and end-of-life management. To assess and report our complete personal systems product carbon cartridges excluded due to non-standard hardware & supplies model. Keypoint Intelligence September 2021 study commissioned by HP, footprint, we extrapolate these results to cover 99% of overall personal systems product sales (by unit and by revenue) during the based on publicly available information as of August 18, 2021. Printers selected by market share in IDC Quarterly Hardcopy Peripherals reporting year. Tracker—Final Historical 2021Q2. For details: www.keypointintelligence.com/HPInstantInk. 5 In 2021, HP tracked approximately US$7 billion in new sales associated with deals in which it met customer requirements for registered 22 Based on monthly subscription cost of HP Instant Ink monochrome toner service 1,500-page plan without purchase of additional sets product eco labels, including ENERGY STAR®, EPEAT®, and Blue Angel. of pages compared to cost per page to print ISO/IEC 24711 pages on most in-class, traditional A4 monochrome toner cartridge printers 6 As of November 2021. <$493 USD and <€494 and MFPs priced <$649 USD and <€672 using original standard-capacity integrated cartridges (toner and drum 7 As of October 31, 2021. in one cartridge). Average CPP per country used to determine percent savings versus CPP for HP Instant Ink. Sale prices not considered for this study. Printers which only use XL cartridges excluded due to non-standard hardware & supplies model. Keypoint Intelligence 8 Or as otherwise required by law. September 2021 study commissioned by HP, based on publicly available information as of August 18, 2021. Printers selected by market 9 As of May 2022, this program is only available in France. share in IDC Quarterly Hardcopy Peripherals Tracker—Final Historical 2021Q2. For details: www.keypointintelligence.com/HPInstantInk. 10 2021 Four Elements Consulting LCA study, commissioned by HP, provides a comparative environmental assessment of an Original 23 Availability varies due to local postal or environmental regulations. See hp.com/hprecycle. Number of countries is as of October 2021. HP Toner Cartridge (CF226A) with an HP EvoCycle Cartridge (CF226XR) utilising the most current data on production practices, 115 2021 HP Sustainable Impact Report www.hp.com/sustainableimpact
Contents Sustainable Impact Footprint Integrity and human rights Supply chain responsibility Operations Products and solutions Appendix 24 This is the number of countries or territories where HP offers hardware recycling and/or Original HP Ink Cartridge recycling and/or defined by EPEAT® eco label criteria. Subject to relevant restrictions on the use and distribution of materials destined for recycling and/or Original HP and Samsung toner cartridge recycling. recycled feedstocks. 25 These include child labor, forced labor, severe forms of discrimination, health and safety issues posing immediate danger to life or risk of 36 A, C, and D covers. serious injury, and perceived violation of environmental laws posing serious and immediate harm to the community. We take such findings 37 This means the outer box packaging is made from recycled or certified content. very seriously, and require suppliers to cease all related practices and report corrective actions taken within 30 days of the original audit. Recruitment fees must be reimbursed within 90 days of discovery, and are verified by an on-site inspection within 180 days of discovery. 38 Ibid. We follow up closely to ensure that all required corrective actions are completed, and visit sites to confirm resolution. Immediate priority 39 HP works collaboratively with our partners including WWF and Arbor Day Foundation to manage, restore, and protect forests in many findings do not necessarily involve termination of the supplier; we work with suppliers as appropriate to improve their performance and countries around the world. With HP+, every print—regardless of paper brand—is addressed through HP’s Forest Positive Framework to worker conditions in these areas. counteract risks of deforestation. HP brand paper is sourced only from certified responsibly managed forests or from recycled content. 26 Product-use GHG emissions intensity describes the performance of our portfolio, taking into account changes to product mix and For other brands of paper, HP invests in forest restoration, protection or management projects in key regions sufficient to balance any business growth. HP product-use GHG emissions intensity measures per-unit GHG emissions during anticipated product lifetime use. paper used by HP+ customers that may not have been responsibly sourced. To learn more visit www.hp.com/forestfirst. These values are then weighted by contribution of personal systems and printing products to overall revenue in the current year. These 40 Percentage for Original HP Toner Cartridges does not include toner bottles. See hp.com/go/TonerRecycledContent for list. Percentage for emissions represent more than 99% of HP product units shipped each year, including notebooks, tablets, desktops, mobile computing Original HP Ink Cartridges does not include ink bottles and other products not listed. See hp.com/go/InkRecycledContent for list. devices, workstations, and displays; HP inkjet, LaserJet, DesignJet, Indigo, Scitex, and Jet Fusion 3D printers; and scanners. Although HP 41 The HP Eco-Carton Ink Cartridge outer carton is 100% recyclable through local cardboard/paper programs. Inner materials including the updated its carbon footprint calculation methodology in 2021 (see the methodological updates box on page 15), we continue to calculate ink bag are 55% recyclable and may be eligible for return free of charge to the HP Planet Partners program for reprocessing of plastic this metric using the original methodology, for comparability with past years. parts. None of these materials returned to HP Planet Partners will be sent to landfill. For information on take-back of ink bag/printhead/ 27 The average energy consumption of HP products was estimated annually between 2019 and 2021 using high-volume product lines prints and HP Planet Partners program availability, visit http://www.hp.com/recycle; program may not be available in all jurisdictions. representative of the overall shipped product volume. The high-volume personal systems product lines include notebook and desktop 42 CO e reduction based on moving from plastic ink cartridge to cardboard HP Eco-Carton Ink Cartridge, with annual manufacturing savings computers, tablets, All-in-Ones, workstations, thin clients, and displays. 2 of 291 tonnes and transport savings of 8 tonnes. 28 HP calculations based on ENERGY STAR® normalized TEC data comparing the HP LaserJet 200–500 series with predecessor printing 43 As of December 31, 2021. Not all products are available in all countries. systems not using HP EcoSmart. 44 Original HP ink integrated printhead cartridges only. UL 2809 Environmental Claim Validation Procedure; see ul.com/news/hp-receives- 29 As defined in the Global Reporting Initiative Sustainability Reporting Standards, renewable material is “material derived from plentiful first-recycled-content-validation-ocean-bound-plastics-ul. An HP-commissioned August 2021 Keypoint Intelligence report verifies HP is resources that are quickly replenished by ecological cycles or agricultural processes, so that the services provided by these and other the only in-class printer OEM with ink cartridges containing recycled ocean-bound plastic validated by UL 2809. See keypointintelligence. linked resources are not endangered and remain available for the next generation.” To count as renewable, HP also requires that materials com/HPPlanetPartners. must be sustainably sourced and, where applicable, certified through a credible third-party certification scheme. 45 As defined in the Global Reporting Initiative Sustainability Reporting Standards, renewable material is “material derived from plentiful 30 For 2021, we improved the calculation methodology for this data point to reflect the number of EPEAT®-registered product models for resources that are quickly replenished by ecological cycles or agricultural processes, so that the services provided by these and other which substance inventory is collected divided by the total number of EPEAT-registered product models. The prior calculation linked resources are not endangered and remain available for the next generation.” methodology counted each product-country combination for which the substance inventory was collected and for which the product was 46 All HP brand paper is derived from certified sources; paper-based packaging for PCs, displays, home and office print, and supplies is registered. According to the revised methodology, the 2020 data is 83% (compared to 95% reported previously). reported by suppliers as recycled or certified, with a minimum of 97% by volume verified by HP. Packaging is the box that comes with the 31 2021 data does not include the following products or packaging for these products: PageWide Industrial and 3D Printing products; or product and all paper-based materials inside the box. Packaging for commercial, industrial, and 3D products, scanners, personal systems personal systems accessories and print accessories sold separately. accessories, and spare parts is not included. 32 This is the percentage of product series shipping with product models that have low-halogen printed circuit boards and plastic parts 47 Fiber by weight will be 1) certified to rigorous third-party standards, 2) recycled, or 3) balanced by forest restoration, protection, and other weighing more than 25 grams. initiatives through HP’s Forest Positive Framework. 33 For 2021, we improved the calculation methodology for this data point to reflect the number of EPEAT-registered product models for which 48 HP analysis of PC laptop keyboards currently in market as of October 2020. Keyboard scissors manufactured from waste bio-feedstock GreenScreen Benchmark (BM) 2 or 3 plasticizers and flame retardants are used divided by the total number of EPEAT-registered product according to the mass balance approach. models. The prior calculation methodology counted each product-country combination for which GreenScreen BM 2 or 3 plasticizers and 49 Keyboard scissors manufactured from waste bio-feedstock according to the mass balance approach. flame retardants are used. According to the revised methodology, the 2020 data is 34% (compared to 49% reported previously). 50 Calculated as the percentage of primary plastic packaging (by weight) reduced per unit shipped. Excludes secondary and tertiary 34 Individual EPEAT-registered products contain a minimum of 5 grams of recycled content. packaging components. Includes HP personal systems and printer hardware packaging. Does not include packaging for the following: 35 Recycled content plastic (RCP) as a percentage of total plastic used in all HP personal systems, printer hardware, and print cartridges Graphics Solutions hardware other than PageWide XL and DesignJet printers; 3D printing hardware; print supplies; refurbished products; shipped during the reporting year. Total volume excludes brand-licensed products and after-market hardware accessories. Total RCP and accessories such as third-party options, drop in box, and aftermarket options. includes postconsumer recycled plastic, closed-loop plastic, and ocean-bound plastics used in HP products. Personal systems plastic is 116 2021 HP Sustainable Impact Report www.hp.com/sustainableimpact
Contents Sustainable Impact Footprint Integrity and human rights Supply chain responsibility Operations Products and solutions Appendix 51 HP Forest Positive Framework goes beyond existing HP sustainable fiber sourcing programs. It includes NGO partnerships targeted to and protocols: EN 71-3, EN 71-9, ASTM F963-17, US 16 CFR 1303, US 16 CFR 1307, SOR 2011-17, and SOR 2018-83. Testing methods focus on conserve forests, improve responsible forest management, and help develop science-based targets for forests. Our vision is that printing with problematic colorants, heavy metals, phthalates, Bisphenol A (BPA), and/or amines (including specific endpoints such as heavy metals and HP will counteract deforestation regardless of what brand of paper customers use. This is applicable to the entire installed base of HP printers. primary aromatic amines (PAA)). HP does not recommend using the inks for toys intended to target children under the age of 3 years. 52 Fiber by weight will be 1) certified to rigorous third-party standards, 2) recycled, or 3) balanced by forest restoration, protection, and other 5 “World’s most secure PCs and workstations” is based on HP’s unique and comprehensive security capabilities at no additional cost initiatives through HP’s Forest Positive Framework. among vendors on HP Elite PCs and HP Workstations with Windows and 8th Gen and higher Intel® processors or AMD Ryzen™ 4000 53 HP brand paper and paper-based packaging for home and office printers and supplies, PCs, and displays are derived from certified and processors and higher; HP ProDesk 600 G6 with Intel 10th Gen and higher processors; and HP ProBook 600 with AMD Ryzen 4000 or Intel recycled sources, with a preference for FSC certification. Packaging is the box that comes with the product and all paper-based materials 11th Gen processors and higher. inside the box. 6 “World’s most secure printing” or “most resilient printers” claims include HP’s most advanced embedded security features are available 54 We calculate the annual tonnage for paper used in our products and print services that will be addressed through projects with civil on HP Managed and Enterprise devices with HP FutureSmart firmware 4.5 or above. Claim based on HP review of 2021 published features society forestry organizations to counteract possible deforestation by taking the estimated annual total tonnage of paper consumed in of competitive in-class printers. Only HP offers a combination of security features to automatically detect, stop, and recover from attacks the use of our printing products and print services minus the weight of such paper that we mitigate internally, through our responsible with a self-healing reboot, in alignment with NIST SP 800-193 guidelines for device cyber resiliency. For a list of compatible products, visit: sourcing programs. Non-HP paper represented 96% of our total fiber footprint during 2021. See HP Forest positive accounting manual. hp.com/go/PrintersThatProtect. For more information, visit: hp.com/go/PrinterSecurityClaims. 55 All HP brand paper is derived from certified sources; paper-based packaging for PCs, displays, home and office print, and supplies is Social impact reported by suppliers as recycled or certified, with a minimum of 97% by volume verified by HP. Packaging is the box that comes with the product and all paper-based materials inside the box. Packaging for commercial, industrial, and 3D products, scanners, personal systems 1 HP defines “accelerating digital equity” as providing access to at least one of the following: hardware, connectivity, content, or digital literacy. accessories, and spare parts is not included. 2 Our programs aim to accelerate digital equity through providing access to at least one of the following: hardware, connectivity, content, or 56 By setting preference for FSC-certified paper, HP advocates prevention of deforestation associated with timber harvesting. FSC digital literacy. certification requires that all trees harvested are replaced or allowed to regenerate naturally. 3 We enable better learning outcomes by supporting education through provision of learning and digital literacy programs and solutions. 57 Forest First: With HP+, every print—regardless of paper brand—is addressed through HP’s Forest Positive Framework to counteract 4 Direct beneficiaries are the number of people who visited a WOW vehicle during the year. This is different from the data reported prior to risks of deforestation. HP brand paper is sourced only from certified responsibly managed forests or from recycled content. For other 2020, which included direct beneficiaries as well as indirect beneficiaries (the total number of people who had access to a WOW vehicle brands of paper, HP invests in restoration, protection, or working forest-recovery projects in key regions, for instance Brazil, sufficient to during the year). Only direct beneficiaries are included in progress against our goal to enable better learning outcomes for 100 million balance any paper used by HP+ customers that may not have been responsibly sourced. Read more about projects and our partners at people by 2025, since the beginning of 2015. hp.com/forestfirst. 5 Select household wipes can be safely used to clean HP Elite and Workstation PCs for up to 1,000 wipes: See wipe manufacturer’s 58 HP works collaboratively with our partners including WWF and Arbor Day Foundation to manage, restore, and protect forests in many instructions for disinfecting and the HP cleaning guide for HP Elite-tested wipe solutions at How to Clean Your HP Device with Approved countries around the world. With HP+, every print—regardless of paper brand—is addressed through HP’s Forest Positive Framework to Disinfecting Wipes. counteract risks of deforestation. HP brand paper is sourced only from certified responsibly managed forests or from recycled content. 6 See How to Clean Your HP Device with Approved Disinfecting Wipes (2021). For other brands of paper, HP invests in forest restoration, protection or management projects in key regions sufficient to balance any 7 HP JetAdvantage Security Manager must be purchased separately. For details, see hp.com/go/securitymanager. paper used by HP+ customers that may not have been responsibly sourced. To learn more visit www.hp.com/forestfirst. 8 According to the World Health Organization (WHO), more than one billion people are estimated to experience disability, a widely-cited Product responsibility statistic based on its findings in the first ever World report on disability in 2011. The WHO has reconfirmed this number repeatedly, 1 An HP printing system consists of an HP printer, paper, and Original HP supply. Blue Angel DE-UZ 219 emissions criteria or earlier versions including in its Disability and health fact sheet published in 2021. of criteria applicable when printing system launched. 9 According to the U.S. Centers for Disease Control and Prevention, 61 million adults in the United States live with a disability based on 2 2022 WKI Emissions Testing study, commissioned by HP, in compliance with Blue Angel protocol DE-UZ 219: 22 non-HP (17 imitation and five data from its Disability and Health Data System (DHDS) and “Morbidity and Mortality Weekly Report”: https://www.cdc.gov/ncbddd/ remanufactured) toner cartridge brands compatible with HP Color LaserJet Enterprise M553X and HP LaserJet M404dn purchased in the disabilityandhealth/infographic-disability-impacts-all.html. North America, Latin America, and Europe, Middle East, and Africa regions. See HP.com/go/IAQnonhpWKI2022. 10 Our programs aim to accelerate digital equity through providing access to at least one of the following: hardware, connectivity, content, or 3 March 2021 WKI Blue Angel Indoor Air Quality study, commissioned by HP, in compliance with DE-UZ 205: 12 imitation and three digital literacy. remanufactured toner cartridge brands compatible with HP LaserJet Pro M402dne and M403d (26A, 28A) purchased in Australia, China, 11 In 2021, more than US$7.5 billion in retained, existing, and new sales was tied in some way to HP’s accessibility programs. Korea, Malaysia, Singapore, and Thailand. See HP.com/go/IAQnonhpAPJ2021. 4 Printing inks can be considered a toy component. It is the obligation of the toy manufacturer to classify the item (including all components) for sale as a toy. HP 832, 873, 872, 882, and 886 Latex Inks have been tested and demonstrated compliance to the following toy safety methods 117 2021 HP Sustainable Impact Report www.hp.com/sustainableimpact