Quest Diagnostics Corporate Responsibility Report
Corporate Responsibility Report 2 021
Table of contents A letter from our Chairman, CEO, and President Steve Rusckowski ..................................... 3 A conversation with CEO-elect Jim Davis ................................................................................. 4 2021 overview Company overview ...................................................................................................................... 6 2021 highlights ............................................................................................................................ 7 Approach to corporate responsibility through our ESG strategy ........................................... 8 Materiality assessment .............................................................................................................. 9 Stakeholder engagement ........................................................................................................ 10 Governance ............................................................................................................................... 11 Board of Directors oversight on corporate responsibility and ESG .................................... 12 Awards and honors .................................................................................................................. 13 COVID-19: Challenges, accomplishments, and opportunities Highlights of our COVID-19 response .................................................................................... 15 Working with the CDC and others to advance understanding of SARS-CoV-2 .................. 16 Bringing COVID-19 testing to New York’s first responders .................................................. 17 Transitioning to life with COVID-19: a new normal ............................................................... 18 Multiple testing options to get—and keep—employees working safely ........................... 19 Nationwide COVID-19 testing initiatives to support safer classrooms ............................. 20 Quest’s initiatives for returning to the “business of play” .................................................... 21 Promoting a healthier world Thought leadership marries insights to influence ............................................................... 24 Key insights on current and emerging healthcare issues ................................................... 25 Improving outcomes for the leading cause of death in the US ........................................... 28 Disparities in breast cancer mortality and treatment ......................................................... 29 Expanding the possibilities with Quest Advanced Neurology ............................................. 30 Advancing healthcare equity in underserved communities ............................................... 31 Keeping kids and families healthy and active ...................................................................... 32 Eliminating disparities in healthcare leadership ................................................................. 33 Addressing COVID-19 in Black communities: Choose Healthy Life .................................... 34 Quest for Health Equity aims to improve healthcare access .............................................. 35 Quest HealthConnect: personalized access to quality healthcare .................................... 36 Increasing access to preventive care through QuestDirect ................................................. 37 Creating an inspiring workplace Our culture rests on equity in compensation and opportunity ........................................... 39 Creating opportunities for excellence .................................................................................... 40 Workforce demographics ........................................................................................................ 41 Benefits that support wellness and prevention ................................................................... 43 Safely working together ........................................................................................................... 44 New tests yield actionable insights ....................................................................................... 45 Bringing our whole selves to work .......................................................................................... 46 Our I&D learning journey ......................................................................................................... 47 Inclusion and Diversity Council inspires new and ongoing initiatives ................................ 48 Inclusion in action: Clifton and West Hills labs ..................................................................... 49 Employee Business Networks reflect and drive Quest values ............................................ 50 Our holistic approach to learning and development ............................................................ 51 Investing in our people ............................................................................................................. 52 Employees are sharing, and we’re listening .......................................................................... 53 Supporting and recognizing all Quest employees ................................................................ 54 RecognitionQuest: a culture of appreciation, celebration, and rewards ............................ 55 Major accolades awarded to our colleagues ........................................................................ 56 Building value State-of-the-art lab opens in Clifton, NJ .............................................................................. 58 Quest collaborations on the cutting edge ............................................................................. 60 Wherever we are, Quest is part of the community ................................................................ 61 Memberships, sponsorships, and affiliations ...................................................................... 63 Environmental sustainability drives operational excellence .............................................. 64 Integrity: a fundamental value ................................................................................................ 67 Cybersecurity and data privacy are high-level priorities ..................................................... 69 Driving supplier excellence and innovation through collaboration .................................... 71 References SASB Sustainability Accounting Standards Index ............................................................... 73 About this report ...................................................................................................................... 78 References ................................................................................................................................ 79 Quest, Quest Diagnostics, any associated logos, and all associated Quest Diagnostics registered or unregistered trademarks are the property of Quest Diagnostics. All third-party marks— ® and ™—are the property of their respective owners. ® 2022 Quest Diagnostics Incorporated. All rights reserved. MI10666 7/2022
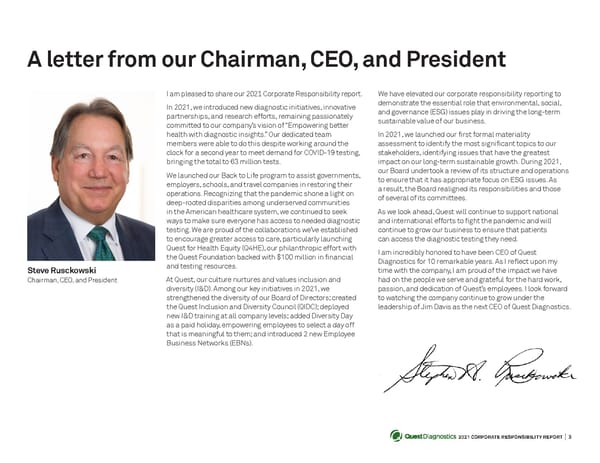
2021 CORPORATE RESPONSIBILITY REPORT I 3 A letter from our Chairman, CEO, and President I am pleased to share our 2021 Corporate Responsibility report. In 2021, we introduced new diagnostic initiatives, innovative partnerships, and research efforts, remaining passionately committed to our company’s vision of “Empowering better health with diagnostic insights.” Our dedicated team members were able to do this despite working around the clock for a second year to meet demand for COVID-19 testing, bringing the total to 63 million tests. We launched our Back to Life program to assist governments, employers, schools, and travel companies in restoring their operations. Recognizing that the pandemic shone a light on deep-rooted disparities among underserved communities in the American healthcare system, we continued to seek ways to make sure everyone has access to needed diagnostic testing. We are proud of the collaborations we’ve established to encourage greater access to care, particularly launching Quest for Health Equity (Q4HE), our philanthropic effort with the Quest Foundation backed with $100 million in financial and testing resources. At Quest, our culture nurtures and values inclusion and diversity (I&D). Among our key initiatives in 2021, we strengthened the diversity of our Board of Directors; created the Quest Inclusion and Diversity Council (QIDC); deployed new I&D training at all company levels; added Diversity Day as a paid holiday, empowering employees to select a day off that is meaningful to them; and introduced 2 new Employee Business Networks (EBNs). We have elevated our corporate responsibility reporting to demonstrate the essential role that environmental, social, and governance (ESG) issues play in driving the long-term sustainable value of our business. In 2021, we launched our first formal materiality assessment to identify the most significant topics to our stakeholders, identifying issues that have the greatest impact on our long-term sustainable growth. During 2021, our Board undertook a review of its structure and operations to ensure that it has appropriate focus on ESG issues. As a result, the Board realigned its responsibilities and those of several of its committees. As we look ahead, Quest will continue to support national and international efforts to fight the pandemic and will continue to grow our business to ensure that patients can access the diagnostic testing they need. I am incredibly honored to have been CEO of Quest Diagnostics for 10 remarkable years. As I reflect upon my time with the company, I am proud of the impact we have had on the people we serve and grateful for the hard work, passion, and dedication of Quest’s employees. I look forward to watching the company continue to grow under the leadership of Jim Davis as the next CEO of Quest Diagnostics. Steve Rusckowski Chairman, CEO, and President
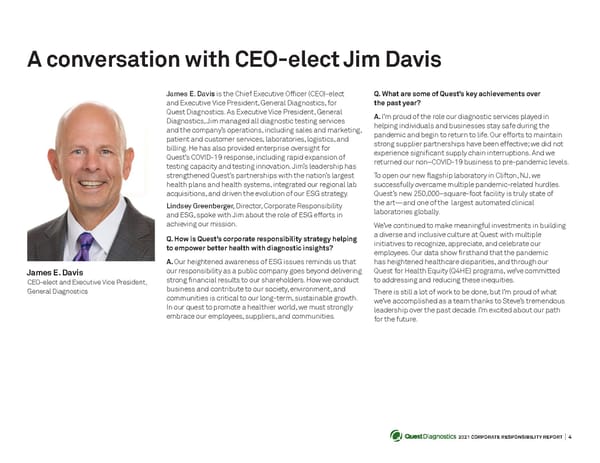
2021 CORPORATE RESPONSIBILITY REPORT I 4 A conversation with CEO-elect Jim Davis James E. Davi s is the Chief Executive Officer (CEO)-elect and Executive Vice President, General Diagnostics, for Quest Diagnostics. As Executive Vice President, General Diagnostics, Jim managed all diagnostic testing services and the company’s operations, including sales and marketing, patient and customer services, laboratories, logistics, and billing. He has also provided enterprise oversight for Quest’s COVID-19 response, including rapid expansion of testing capacity and testing innovation. Jim’s leadership has strengthened Quest’s partnerships with the nation’s largest health plans and health systems, integrated our regional lab acquisitions, and driven the evolution of our ESG strategy. Lindsey Greenberger, Director, Corporate Responsibility and ESG, spoke with Jim about the role of ESG efforts in achieving our mission. Q. How is Quest’s corporate responsibility strategy helping to empower better health with diagnostic insights? A . Our heightened awareness of ESG issues reminds us that our responsibility as a public company goes beyond delivering strong financial results to our shareholders. How we conduct business and contribute to our society, environment, and communities is critical to our long-term, sustainable growth. In our quest to promote a healthier world, we must strongly embrace our employees, suppliers, and communities. Q. What are some of Quest’s key achievements over the past year? A . I’m proud of the role our diagnostic services played in helping individuals and businesses stay safe during the pandemic and begin to return to life. Our efforts to maintain strong supplier partnerships have been effective; we did not experience significant supply chain interruptions. And we returned our non–COVID-19 business to pre-pandemic levels. To open our new flagship laboratory in Clifton, NJ, we successfully overcame multiple pandemic-related hurdles. Quest’s new 250,000–square-foot facility is truly state of the art—and one of the largest automated clinical laboratories globally. We’ve continued to make meaningful investments in building a diverse and inclusive culture at Quest with multiple initiatives to recognize, appreciate, and celebrate our employees. Our data show firsthand that the pandemic has heightened healthcare disparities, and through our Quest for Health Equity (Q4HE) programs, we’ve committed to addressing and reducing these inequities. There is still a lot of work to be done, but I’m proud of what we’ve accomplished as a team thanks to Steve’s tremendous leadership over the past decade. I’m excited about our path for the future. James E. Davis CEO-elect and Executive Vice President, General Diagnostics
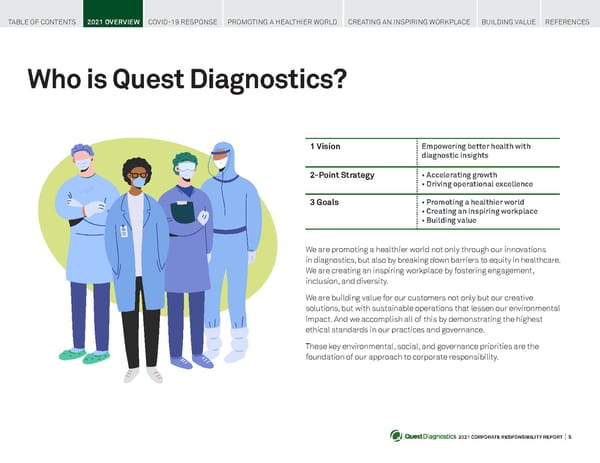
2021 CORPORATE RESPONSIBILITY REPORT I 5 Who is Quest Diagnostics? We are promoting a healthier world not only through our innovations in diagnostics, but also by breaking down barriers to equity in healthcare. We are creating an inspiring workplace by fostering engagement, inclusion, and diversity. We are building value for our customers not only but our creative solutions, but with sustainable operations that lessen our environmental impact. And we accomplish all of this by demonstrating the highest ethical standards in our practices and governance. These key environmental, social, and governance priorities are the foundation of our approach to corporate responsibility. 1 Vision Empowering better health with diagnostic insights 2-Point Strategy • Accelerating growth • Driving operational excellence 3 Goals • Promoting a healthier world • Creating an inspiring workplace • Building value TABLE OF CONTENTS 2021 OVERVIEW COVID-19 RESPONSE PROMOTING A HEALTHIER WORLD CREATING AN INSPIRING WORKPLACE BUILDING VALUE REFERENCES
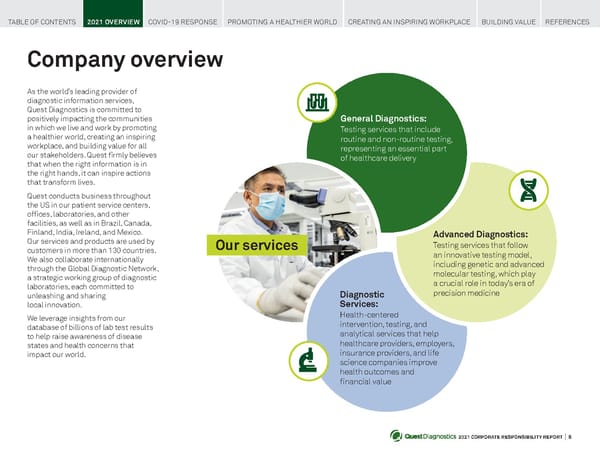
2021 CORPORATE RESPONSIBILITY REPORT I 6 Company overview TABLE OF CONTENTS 2021 OVERVIEW COVID-19 RESPONSE PROMOTING A HEALTHIER WORLD CREATING AN INSPIRING WORKPLACE BUILDING VALUE REFERENCES As the world’s leading provider of diagnostic information services, Quest Diagnostics is committed to positively impacting the communities in which we live and work by promoting a healthier world, creating an inspiring workplace, and building value for all our stakeholders. Quest firmly believes that when the right information is in the right hands, it can inspire actions that transform lives. Quest conducts business throughout the US in our patient service centers, offices, laboratories, and other facilities, as well as in Brazil, Canada, Finland, India, Ireland, and Mexico. Our services and products are used by customers in more than 130 countries. We also collaborate internationally through the Global Diagnostic Network, a strategic working group of diagnostic laboratories, each committed to unleashing and sharing local innovation. We leverage insights from our database of billions of lab test results to help raise awareness of disease states and health concerns that impact our world. General Diagnostics: Testing services that include routine and non-routine testing, representing an essential part of healthcare delivery Advanced Diagnostics: Testing services that follow an innovative testing model, including genetic and advanced molecular testing, which play a crucial role in today’s era of precision medicine Diagnostic Services: Health-centered intervention, testing, and analytical services that help healthcare providers, employers, insurance providers, and life science companies improve health outcomes and financial value Our services
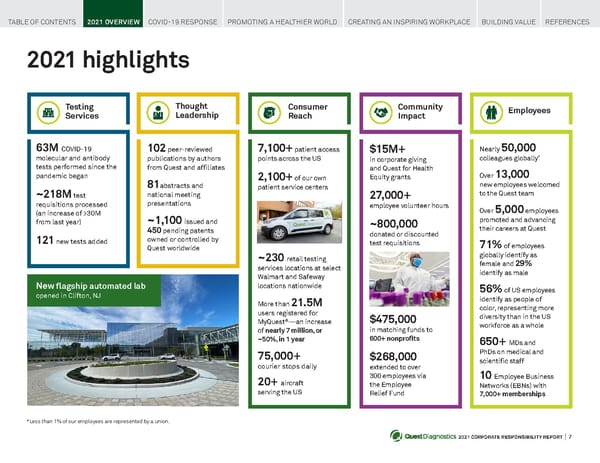
2021 CORPORATE RESPONSIBILITY REPORT I 7 2021 highlights 63M COVID-19 molecular and antibody tests performed since the pandemic began ~218M test requisitions processed (an increase of >30M from last year) 1 2 1 new tests added 102 peer-reviewed publications by authors from Quest and affiliates 8 1 abstracts and national meeting presentations ~1 , 100 issued and 450 pending patents owned or controlled by Quest worldwide $15M+ in corporate giving and Quest for Health Equity grants 2 7 ,000+ employee volunteer hours ~800,000 donated or discounted test requisitions $475,000 in matching funds to 600+ nonprofits $ 268,000 extended to over 300 employees via the Employee Relief Fund Nearly 50,000 colleagues globally * Over 13,000 new employees welcomed to the Quest team Over 5,000 employees promoted and advancing their careers at Quest 71% of employees globally identify as female and 29% identify as male 56% of US employees identify as people of color, representing more diversity than in the US workforce as a whole 650+ MDs and PhDs on medical and scientific staff 10 Employee Business Networks (EBNs) with 7,000+ memberships 7 , 100+ patient access points across the US 2 , 100+ of our own patient service centers ~ 230 retail testing services locations at select Walmart and Safeway locations nationwide More than 21 .5M users registered for MyQuest ® —an increase of nearly 7 million, or ~50%, in 1 year 75,000+ courier stops daily 20+ aircraft serving the US Testing Services Consumer Reach Community Impact Employees Thought Leadership New flagship automated lab opened in Clifton, NJ *Less than 1% of our employees are represented by a union. TABLE OF CONTENTS 2021 OVERVIEW COVID-19 RESPONSE PROMOTING A HEALTHIER WORLD CREATING AN INSPIRING WORKPLACE BUILDING VALUE REFERENCES
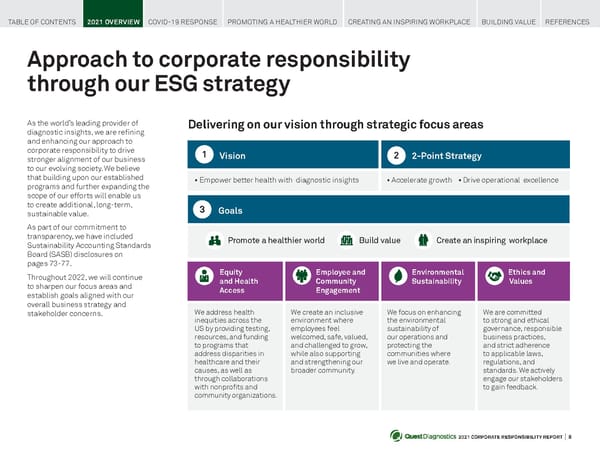
2021 CORPORATE RESPONSIBILITY REPORT I 8 Approach to corporate responsibility through our ESG strategy As the world’s leading provider of diagnostic insights, we are refining and enhancing our approach to corporate responsibility to drive stronger alignment of our business to our evolving society. We believe that building upon our established programs and further expanding the scope of our efforts will enable us to create additional, long-term, sustainable value. As part of our commitment to transparency, we have included Sustainability Accounting Standards Board (SASB) disclosures on pages 73-77. Throughout 2022, we will continue to sharpen our focus areas and establish goals aligned with our overall business strategy and stakeholder concerns. Delivering on our vision through strategic focus areas Vision 2-Point Strategy • Empower better health with diagnostic insights • Accelerate growth • Drive operational excellence 1 2 Equity and Health Access Employee and Community Engagement Environmental Sustainability Ethics and Values We address health inequities across the US by providing testing, resources, and funding to programs that address disparities in healthcare and their causes, as well as through collaborations with nonprofits and community organizations. We create an inclusive environment where employees feel welcomed, safe, valued, and challenged to grow, while also supporting and strengthening our broader community. We focus on enhancing the environmental sustainability of our operations and protecting the communities where we live and operate. We are committed to strong and ethical governance, responsible business practices, and strict adherence to applicable laws, regulations, and standards. We actively engage our stakeholders to gain feedback. Goals Promote a healthier world Build value Create an inspiring workplace 3 TABLE OF CONTENTS 2021 OVERVIEW COVID-19 RESPONSE PROMOTING A HEALTHIER WORLD CREATING AN INSPIRING WORKPLACE BUILDING VALUE REFERENCES
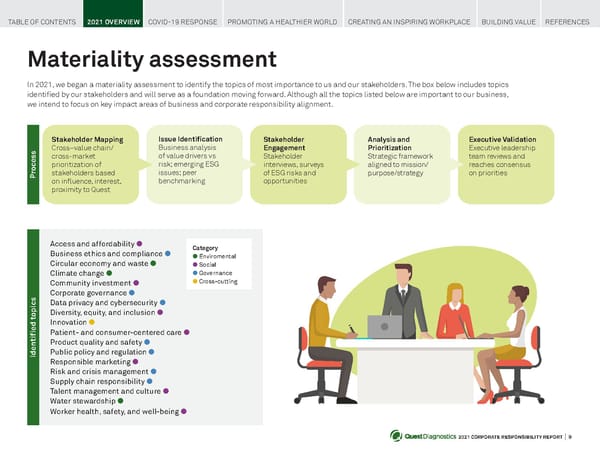
2021 CORPORATE RESPONSIBILITY REPORT I 9 Materiality assessment In 2021, we began a materiality assessment to identify the topics of most importance to us and our stakeholders. The box below includes topics identified by our stakeholders and will serve as a foundation moving forward. Although all the topics listed below are important to our business, we intend to focus on key impact areas of business and corporate responsibility alignment. Stakeholder Mapping Cross–value chain/ cross-market prioritization of stakeholders based on influence, interest, proximity to Quest Issue Identification Business analysis of value drivers vs risk; emerging ESG issues; peer benchmarking Stakeholder Engagement Stakeholder interviews, surveys of ESG risks and opportunities Analysis and Prioritization Strategic framework aligned to mission/ purpose/strategy Executive Validation Executive leadership team reviews and reaches consensus on priorities Process TABLE OF CONTENTS 2021 OVERVIEW COVID-19 RESPONSE PROMOTING A HEALTHIER WORLD CREATING AN INSPIRING WORKPLACE BUILDING VALUE REFERENCES Identified topics Access and affordability l Business ethics and compliance l Circular economy and waste l Climate change l Community investment l Corporate governance l Data privacy and cybersecurity l Diversity, equity, and inclusion l Innovation l Patient- and consumer-centered care l Product quality and safety l Public policy and regulation l Responsible marketing l Risk and crisis management l Supply chain responsibility l Talent management and culture l Water stewardship l Worker health, safety, and well-being l Category l Enviromental l Social l Governance l Cross-cutting
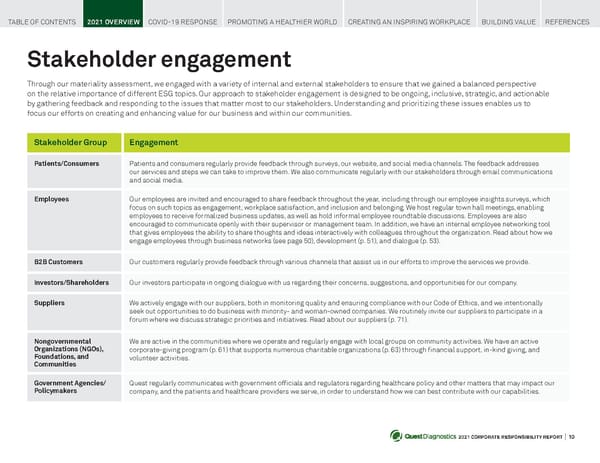
2021 CORPORATE RESPONSIBILITY REPORT I 10 Stakeholder engagement Through our materiality assessment, we engaged with a variety of internal and external stakeholders to ensure that we gained a balanced perspective on the relative importance of different ESG topics. Our approach to stakeholder engagement is designed to be ongoing, inclusive, strategic, and actionable by gathering feedback and responding to the issues that matter most to our stakeholders. Understanding and prioritizing these issues enables us to focus our efforts on creating and enhancing value for our business and within our communities. Stakeholder Group Engagement Patients/Consumers Patients and consumers regularly provide feedback through surveys, our website, and social media channels. The feedback addresses our services and steps we can take to improve them. We also communicate regularly with our stakeholders through email communications and social media. Employees Our employees are invited and encouraged to share feedback throughout the year, including through our employee insights surveys, which focus on such topics as engagement, workplace satisfaction, and inclusion and belonging. We host regular town hall meetings, enabling employees to receive formalized business updates, as well as hold informal employee roundtable discussions. Employees are also encouraged to communicate openly with their supervisor or management team. In addition, we have an internal employee networking tool that gives employees the ability to share thoughts and ideas interactively with colleagues throughout the organization. Read about how we engage employees through business networks (see page 50), development (p. 51), and dialogue (p. 53). B2B Customers Our customers regularly provide feedback through various channels that assist us in our efforts to improve the services we provide. Investors/Shareholders Our investors participate in ongoing dialogue with us regarding their concerns, suggestions, and opportunities for our company. Suppliers We actively engage with our suppliers, both in monitoring quality and ensuring compliance with our Code of Ethics, and we intentionally seek out opportunities to do business with minority- and woman-owned companies. We routinely invite our suppliers to participate in a forum where we discuss strategic priorities and initiatives. Read about our suppliers (p. 71). Nongovernmental Organizations (NGOs), Foundations, and Communities We are active in the communities where we operate and regularly engage with local groups on community activities. We have an active corporate-giving program (p. 61) that supports numerous charitable organizations (p. 63) through financial support, in-kind giving, and volunteer activities. Government Agencies/ Policymakers Quest regularly communicates with government officials and regulators regarding healthcare policy and other matters that may impact our company, and the patients and healthcare providers we serve, in order to understand how we can best contribute with our capabilities. TABLE OF CONTENTS 2021 OVERVIEW COVID-19 RESPONSE PROMOTING A HEALTHIER WORLD CREATING AN INSPIRING WORKPLACE BUILDING VALUE REFERENCES
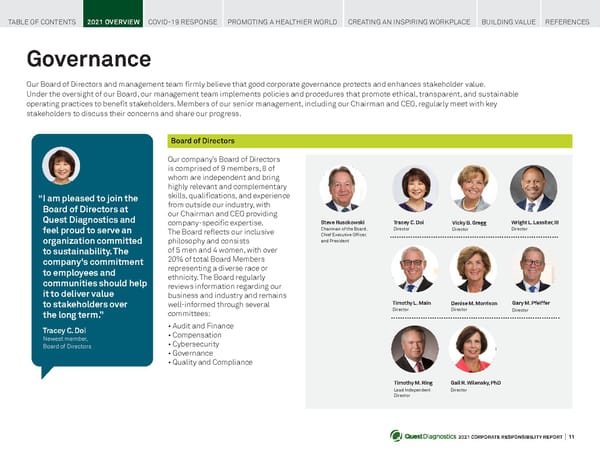
2021 CORPORATE RESPONSIBILITY REPORT I 11 Governance Our Board of Directors and management team firmly believe that good corporate governance protects and enhances stakeholder value. Under the oversight of our Board, our management team implements policies and procedures that promote ethical, transparent, and sustainable operating practices to benefit stakeholders. Members of our senior management, including our Chairman and CEO, regularly meet with key stakeholders to discuss their concerns and share our progress. “I am pleased to join the Board of Directors at Quest Diagnostics and feel proud to serve an organization committed to sustainability. The company's commitment to employees and communities should help it to deliver value to stakeholders over the long term.” Tracey C. Doi Newest member, Board of Directors Board of Directors Our company’s Board of Directors is comprised of 9 members, 8 of whom are independent and bring highly relevant and complementary skills, qualifications, and experience from outside our industry, with our Chairman and CEO providing company-specific expertise. The Board reflects our inclusive philosophy and consists of 5 men and 4 women, with over 20% of total Board Members representing a diverse race or ethnicity. The Board regularly reviews information regarding our business and industry and remains well-informed through several committees: • Audit and Finance • Compensation • Cybersecurity • Governance • Quality and Compliance Steve Rusckowski Chairman of the Board, Chief Executive Officer, and President Tracey C. Doi Director Vicky B. Gregg Director Wright L. Lassiter, III Director Timothy L. Main Director Denise M. Morrison Director Gail R. Wilensky, PhD Director Timothy M. Ring Lead Independent Director Gary M. Pfeiffer Director TABLE OF CONTENTS 2021 OVERVIEW COVID-19 RESPONSE PROMOTING A HEALTHIER WORLD CREATING AN INSPIRING WORKPLACE BUILDING VALUE REFERENCES
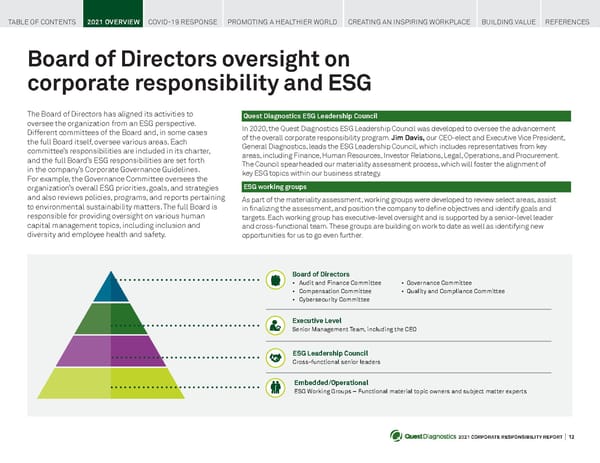
2021 CORPORATE RESPONSIBILITY REPORT I 12 Board of Directors oversight on corporate responsibility and ESG Quest Diagnostics ESG Leadership Council In 2020, the Quest Diagnostics ESG Leadership Council was developed to oversee the advancement of the overall corporate responsibility program. Jim Davis, our CEO-elect and Executive Vice President, General Diagnostics, leads the ESG Leadership Council, which includes representatives from key areas, including Finance, Human Resources, Investor Relations, Legal, Operations, and Procurement. The Council spearheaded our materiality assessment process, which will foster the alignment of key ESG topics within our business strategy. ESG working groups As part of the materiality assessment, working groups were developed to review select areas, assist in finalizing the assessment, and position the company to define objectives and identify goals and targets. Each working group has executive-level oversight and is supported by a senior-level leader and cross-functional team. These groups are building on work to date as well as identifying new opportunities for us to go even further. The Board of Directors has aligned its activities to oversee the organization from an ESG perspective. Different committees of the Board and, in some cases the full Board itself, oversee various areas. Each committee’s responsibilities are included in its charter, and the full Board’s ESG responsibilities are set forth in the company’s Corporate Governance Guidelines. For example, the Governance Committee oversees the organization’s overall ESG priorities, goals, and strategies and also reviews policies, programs, and reports pertaining to environmental sustainability matters. The full Board is responsible for providing oversight on various human capital management topics, including inclusion and diversity and employee health and safety. Board of Directors • Audit and Finance Committee • Governance Committee • Compensation Committee • Quality and Compliance Committee • Cybersecurity Committee Executive Level Senior Management Team, including the CEO ESG Leadership Council Cross-functional senior leaders Embedded/Operational ESG Working Groups – Functional material topic owners and subject matter experts TABLE OF CONTENTS 2021 OVERVIEW COVID-19 RESPONSE PROMOTING A HEALTHIER WORLD CREATING AN INSPIRING WORKPLACE BUILDING VALUE REFERENCES
2021 CORPORATE RESPONSIBILITY REPORT I 13 Awards and honors We are honored to have been recognized by leading business organizations across the country. FORTUNE’s World’s Most Admired Companies Eighth consecutive year Best Place to Work for LGBTQ Equality Scored a perfect 100 on the Human Rights Campaign Foundation’s 2021 Corporate Equality Index (CEI). Fifth consecutive year America’s Best Large Employers of 2021 Forbes magazine World’s Best Employers 2021 Forbes magazine Best Place to Work for Disability Inclusion Named to the 2021 Disability Equality Index (DEI) Best Places to Work for Disability Inclusion by Disability: IN and the American Association of People with Disabilities (AAPD). Fourth consecutive year American Heart Association’s 2021 Workplace Health Achievement Index Awarded Gold status, ranking the company’s workplace health initiative among the best in the nation. Fourth consecutive year Women’s Forum of New York 2021 Corporate Champion for diversification of our Board Presented to Quest Chairman, CEO, and President Steve Rusckowski 2021 Community Quarterback Award United Way of New York City, for the Quest for Health Equity initiative New Jersey Business Hall of Fame ™ Junior Achievement of New Jersey 2021 Healthcare Power 50 NJBIZ.com TABLE OF CONTENTS 2021 OVERVIEW COVID-19 RESPONSE PROMOTING A HEALTHIER WORLD CREATING AN INSPIRING WORKPLACE BUILDING VALUE REFERENCES
2021 CORPORATE RESPONSIBILITY REPORT I 14 As the world’s leading provider of diagnostic information services, Quest stepped up and answered the call to play a central role in the national response to COVID-19. Since the onset of the pandemic in early 2020, our nearly 50,000 employees have been working to meet evolving testing needs and to provide insights into disease trends through research partnerships. These efforts remain critical to enabling safer environments as we reopen the economy and return to schools, routine healthcare, and workplaces—while continuing to acknowledge the crucial role of critical frontline workers who stayed at their posts throughout the emergency. On the following pages, we’ll share key milestones in our continuing COVID-19 response on behalf of our employees, customers, and communities. For up-to-date information on our ongoing COVID-19 efforts, visit QuestDiagnostics.com/COVID-19. COVID-19: Challenges, accomplishments, and opportunities TABLE OF CONTENTS 2021 OVERVIEW COVID-19 RESPONSE PROMOTING A HEALTHIER WORLD CREATING AN INSPIRING WORKPLACE BUILDING VALUE REFERENCES
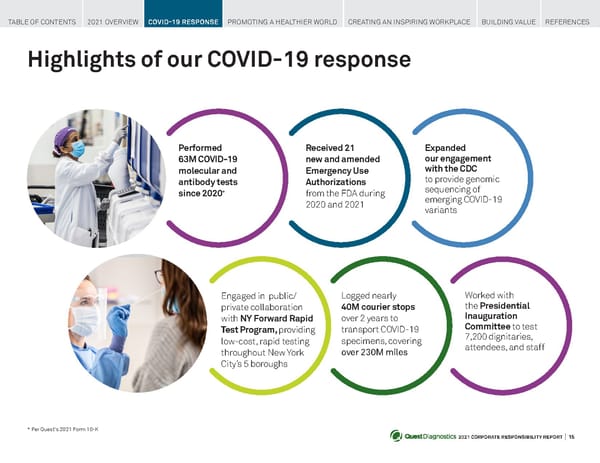
2021 CORPORATE RESPONSIBILITY REPORT I 15 Highlights of our COVID-19 response Received 21 new and amended Emergency Use Authorizations from the FDA during 2020 and 2021 Engaged in public/ private collaboration with NY Forward Rapid Test Program, providing low-cost, rapid testing throughout New York City’s 5 boroughs Worked with the Presidential Inauguration Committee to test 7,200 dignitaries, attendees, and staff Logged nearly 40M courier stops over 2 years to transport COVID-19 specimens, covering over 230M miles Performed 63M COVID-19 molecular and antibody tests since 2020 * Expanded our engagement with the CDC to provide genomic sequencing of emerging COVID-19 variants * Per Quest's 2021 Form 10-K TABLE OF CONTENTS 2021 OVERVIEW COVID-19 RESPONSE PROMOTING A HEALTHIER WORLD CREATING AN INSPIRING WORKPLACE BUILDING VALUE REFERENCES
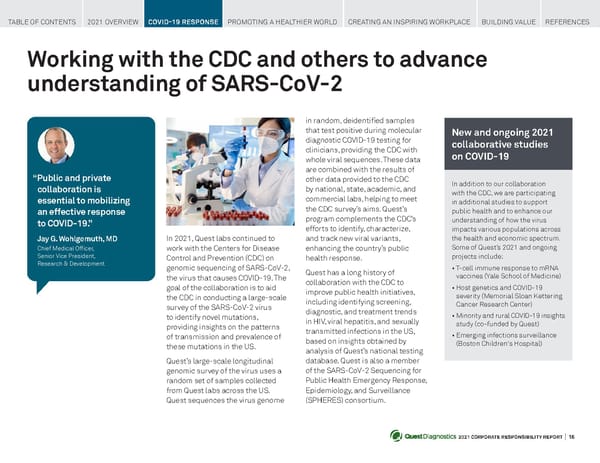
2021 CORPORATE RESPONSIBILITY REPORT I 16 Working with the CDC and others to advance understanding of SARS-CoV-2 In 2021, Quest labs continued to work with the Centers for Disease Control and Prevention (CDC) on genomic sequencing of SARS-CoV-2, the virus that causes COVID-19. The goal of the collaboration is to aid the CDC in conducting a large-scale survey of the SARS-CoV-2 virus to identify novel mutations, providing insights on the patterns of transmission and prevalence of these mutations in the US. Quest’s large-scale longitudinal genomic survey of the virus uses a random set of samples collected from Quest labs across the US. Quest sequences the virus genome “ Public and private collaboration is essential to mobilizing an effective response to COVID-19. ” Jay G. Wohlgemuth, MD Chief Medical Officer, Senior Vice President, Research & Development in random, deidentified samples that test positive during molecular diagnostic COVID-19 testing for clinicians, providing the CDC with whole viral sequences. These data are combined with the results of other data provided to the CDC by national, state, academic, and commercial labs, helping to meet the CDC survey’s aims. Quest’s program complements the CDC’s efforts to identify, characterize, and track new viral variants, enhancing the country’s public health response. Quest has a long history of collaboration with the CDC to improve public health initiatives, including identifying screening, diagnostic, and treatment trends in HIV, viral hepatitis, and sexually transmitted infections in the US, based on insights obtained by analysis of Quest’s national testing database. Quest is also a member of the SARS-CoV-2 Sequencing for Public Health Emergency Response, Epidemiology, and Surveillance (SPHERES) consortium. TABLE OF CONTENTS 2021 OVERVIEW COVID-19 RESPONSE PROMOTING A HEALTHIER WORLD CREATING AN INSPIRING WORKPLACE BUILDING VALUE REFERENCES New and ongoing 2 021 collaborative studies on COVID-19 In addition to our collaboration with the CDC, we are participating in additional studies to support public health and to enhance our understanding of how the virus impacts various populations across the health and economic spectrum. Some of Quest’s 2021 and ongoing projects include: • T-cell immune response to mRNA vaccines (Yale School of Medicine) • Host genetics and COVID-19 severity (Memorial Sloan Kettering Cancer Research Center) • Minority and rural COVID-19 insights study (co-funded by Quest) • Emerging infections surveillance (Boston Children's Hospital)
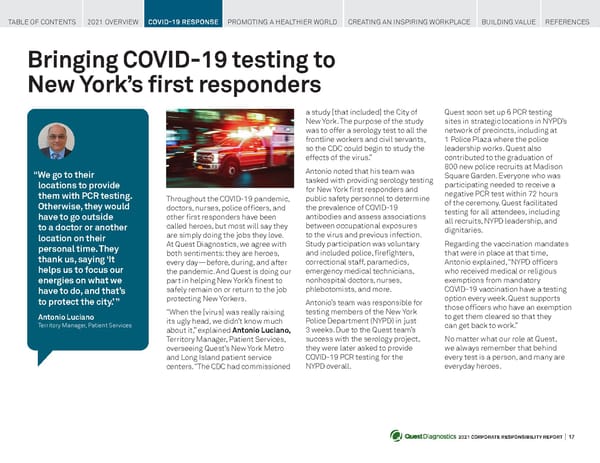
2021 CORPORATE RESPONSIBILITY REPORT I 17 Bringing COVID-19 testing to New York’s first responders Throughout the COVID-19 pandemic, doctors, nurses, police officers, and other first responders have been called heroes, but most will say they are simply doing the jobs they love. At Quest Diagnostics, we agree with both sentiments: they are heroes, every day—before, during, and after the pandemic. And Quest is doing our part in helping New York’s finest to safely remain on or return to the job protecting New Yorkers. “When the [virus] was really raising its ugly head, we didn’t know much about it,” explained Antonio Luciano, Territory Manager, Patient Services, overseeing Quest’s New York Metro and Long Island patient service centers. “The CDC had commissioned a study [that included] the City of New York. The purpose of the study was to offer a serology test to all the frontline workers and civil servants, so the CDC could begin to study the effects of the virus.” Antonio noted that his team was tasked with providing serology testing for New York first responders and public safety personnel to determine the prevalence of COVID-19 antibodies and assess associations between occupational exposures to the virus and previous infection. Study participation was voluntary and included police, firefighters, correctional staff, paramedics, emergency medical technicians, nonhospital doctors, nurses, phlebotomists, and more. Antonio’s team was responsible for testing members of the New York Police Department (NYPD) in just 3 weeks. Due to the Quest team’s success with the serology project, they were later asked to provide COVID-19 PCR testing for the NYPD overall. Quest soon set up 6 PCR testing sites in strategic locations in NYPD’s network of precincts, including at 1 Police Plaza where the police leadership works. Quest also contributed to the graduation of 800 new police recruits at Madison Square Garden. Everyone who was participating needed to receive a negative PCR test within 72 hours of the ceremony. Quest facilitated testing for all attendees, including all recruits, NYPD leadership, and dignitaries. Regarding the vaccination mandates that were in place at that time, Antonio explained, “NYPD officers who received medical or religious exemptions from mandatory COVID-19 vaccination have a testing option every week. Quest supports those officers who have an exemption to get them cleared so that they can get back to work.” No matter what our role at Quest, we always remember that behind every test is a person, and many are everyday heroes. “We go to their locations to provide them with PCR testing. Otherwise, they would have to go outside to a doctor or another location on their personal time. They thank us, saying ‘It helps us to focus our energies on what we have to do, and that’s to protect the city.’ ” Antonio Luciano Territory Manager, Patient Services TABLE OF CONTENTS 2021 OVERVIEW COVID-19 RESPONSE PROMOTING A HEALTHIER WORLD CREATING AN INSPIRING WORKPLACE BUILDING VALUE REFERENCES
2021 CORPORATE RESPONSIBILITY REPORT I 18 Transitioning to life with COVID-19: a new normal Back to recreation Back to school Back to working on-site Many Quest employees are successfully transitioning from working remotely to returning safely to working on-site (p. 19). Read about how Quest helped children across the country return to in-school learning (p. 20). Quest’s innovative new programs and collaborations are getting people back to recreation, including travel, sporting events, and more (p. 21). TABLE OF CONTENTS 2021 OVERVIEW COVID-19 RESPONSE PROMOTING A HEALTHIER WORLD CREATING AN INSPIRING WORKPLACE BUILDING VALUE REFERENCES As COVID-19 transitions from pandemic to endemic, we’re learning to live a “new normal.” Reported levels of COVID-19 vary by region, with most states adjusting masking requirements in public areas. Employees are returning to on-site work, and children are back to in-school learning. Quest proactively established our “ Back to Life ” effort including multiple partnerships and initiatives to help communities safely return to on-site work, school, and recreational activities. In the coming pages, we'll discuss many of our successful endeavors and how they're helping so many to return to all aspects of life.
2021 CORPORATE RESPONSIBILITY REPORT I 19 COVID-19 RESPONSE: BACK TO WORKING ON-SITE Multiple testing options to get—and keep— employees working safely In response to the ongoing COVID-19 public health emergency, Quest added numerous COVID-19 tests to its menu in record time, including PCR molecular testing to confirm active infection, along with influenza and respiratory syncytial virus (RSV); rapid antigen tests; and antibody testing. Our testing offerings now include an at-home COVID-19 test service for private employers or for direct purchase by consumers. Quest’s collaboration with eMed ™ features proctored telehealth appointments through which a trained technician observes proper sample collection, confirms identity, and certifies results reporting. COVID-19 antibody testing to detect antibodies associated with prior or recent COVID-19 infection is providing healthcare professionals with data about ongoing immunity. Quest continues to support increased access to COVID-19 testing by: • Offering new consumer-initiated COVID-19 diagnostic test options for active COVID-19 infection via QuestDirect ™ • Providing return-to-work testing solutions to increase access to COVID-19 testing for multiple large employers including: - New York State (NYS) Employee Testing Program - New York Police Department (NYPD) (p. 17) - Hartford HealthCare to increase testing and capacity in locations across Connecticut Employers across the country are taking advantage of our COVID-19 return-to-work services. Our Employer Population Health program helps employers streamline workforce COVID-19 testing and care for their employees. Offering molecular and/or antibody testing provides employees the knowledge they need about their COVID-19 status and may help employees feel more confident as they return to work. Our molecular tests can detect COVID-19 infection regardless of variant type. QuestDirect ™ , our consumer-initiated testing service, took early steps to increase access to testing in under-resourced communities by “ As a leader in the nation's COVID-19 testing response, Quest Diagnostics is continually spearheading new innovations to broaden access to quality COVID-19 diagnostic insights.” Cathy Doherty Senior Vice President, Regional Businesses making COVID-19 testing available for $0 out-of-pocket. Eligibility for testing includes adults and minors regardless of symptoms or suspected exposure, consistent with updated government guidance on insurance coverage for COVID-19 testing. Quest is believed to be the first national laboratory provider to enable patients—regardless of symptoms or exposure—to request access to COVID-19 diagnostic testing through a consumer-initiated testing site with broadly accessible, observed self-collection, at no cost to individuals. Find out more about QuestDirect (p. 37). TABLE OF CONTENTS 2021 OVERVIEW COVID-19 RESPONSE PROMOTING A HEALTHIER WORLD CREATING AN INSPIRING WORKPLACE BUILDING VALUE REFERENCES
2021 CORPORATE RESPONSIBILITY REPORT I 20 COVID-19 RESPONSE: BACK TO SCHOOL Nationwide COVID-19 testing initiatives to support safer classrooms It’s difficult to overestimate the toll that the COVID-19 pandemic has had on many of our nation’s children—academically, socially, developmentally, and emotionally. Quest Diagnostics recognizes the critical role that daily in-school learning plays in helping our kids to overcome the very real challenges they faced with repeated lockdowns, school closings, and the limitations of remote learning. In our commitment to supporting communities throughout the country, Quest has established multiple initiatives, including: • Quest’s “Back to the Classroom” program to help develop K–12 in-school COVID-19 testing solutions that allow students and staff to return to school safely • Partnerships to further expand testing access and capacity, including collaboration with biotechnology company Ginkgo Bioworks and agreements with multiple state departments of health, including Arizona (through its collaboration with Sonora Quest Laboratories), Texas, Pennsylvania, and more. The programs offer weekly, high-quality, “pod-pooled” molecular (PCR) swab tests to rapidly sample students and staff to reduce the likelihood of asymptomatic spread of COVID-19. Members of pods who test positive are provided with home self-collection kits for testing to determine next steps. • Quest’s Great Midwest Region is partnering with the Battelle Memorial Institute in Ohio to facilitate COVID-19 testing through the US Department of Health and Human Services for millions of Americans in midwestern states, primarily in public and private K-12 schools as well as for underserved populations, such as people who are homeless and those who live in congregate care settings. Quest’s “Back to the Classroom” program as well as additional COVID-19 testing initiatives, are also helping college students, faculty, and staff safely return to and stay on campus. TABLE OF CONTENTS 2021 OVERVIEW COVID-19 RESPONSE PROMOTING A HEALTHIER WORLD CREATING AN INSPIRING WORKPLACE BUILDING VALUE REFERENCES
2021 CORPORATE RESPONSIBILITY REPORT I 21 COVID-19 RESPONSE: BACK TO RECREATION Quest’s initiatives for returning to the “business of play” More than 2 years following the onset of the COVID-19 pandemic, Americans are eager to resume something like normal life again. This not only means returning to work and to school: perhaps just as importantly, it also means returning to recreation. Several innovative partnerships are allowing Quest to help people safely return to the activities they love. Here are a few examples . q “ Quest’s involvement in the Boston Marathon was crucial. Without providing a safe environment for runners, the Boston Athletic Association would not be able to conduct this historic race. My eyes well up with tears when I think about the extraordinary job and effort our Quest Diagnostics team took to operate this testing event. ” Gillian Plummer Director, Product Management, Sports Diagnostics Quest plays key role in the return of the world’s oldest marathon After being canceled for the first time in its 124-year history due to the COVID-19 pandemic in 2020, runners were once again able to participate in the 2021 Boston Marathon. As the virus continued to race across the country with the introduction of new variants, the 125th running of the marathon faced multiple health and safety challenges. As part of the protocols mandated by the Boston Athletic Association (BAA), the 10,000 athletes as well as organizers, volunteers, and staff were all required to show either proof of vaccination or a current negative COVID-19 test within 72 hours of the race. At the request of the BAA, Quest was selected to be the sole on-site testing provider offering COVID-19 testing. To provide this high volume of testing, Quest employees were specially trained to work at the race’s starting point as registration representatives, specimen collection observers, testers, supervisors, and support staff, playing a crucial role in providing a safer environment for runners, staff, and volunteers alike. A safe return to the high seas In mid-March 2020, the CDC issued a “no-sail order” for cruise ships due to the COVID-19 pandemic. It wasn’t until more than a year later, in summer 2021, that the CDC allowed cruise lines to resume operations. Ensuring a safe return to cruise ships required establishing best practices for health and safety. TABLE OF CONTENTS 2021 OVERVIEW COVID-19 RESPONSE PROMOTING A HEALTHIER WORLD CREATING AN INSPIRING WORKPLACE BUILDING VALUE REFERENCES
2021 CORPORATE RESPONSIBILITY REPORT I 22 As part of these efforts, Quest Diagnostics partnered with Carnival Corporation and Royal Caribbean, the 2 largest cruise lines in the US, to make pre-board COVID-19 testing more accessible and convenient for guests, offering the reassurance of a trusted national laboratory provider. Regardless of COVID-19 vaccination status, all cruise passengers must present negative COVID-19 test results 2-3 days before embarking. In establishing their program, Carnival, Royal Caribbean, and Quest understood the importance of testing passengers before they arrived at their ports—thereby avoiding port congestion and the costs and frustration that could result from receiving positive COVID-19 tests at port, preventing guests from being allowed to board. Instead, the Carnival, Royal Caribbean, and Quest testing programs help to streamline pre-cruise preparation. By offering passengers the convenience of receiving quality COVID-19 testing close to home, the program makes testing available at more than 2,200 Quest Diagnostics patient service centers and select Walmart locations, Giant Eagle drive-throughs, and other retail pharmacy testing locations throughout the US. A return to “Tennis Paradise” Referred to as “Tennis Paradise” by the tennis community, the BNP Paribas Tennis Open is a professional men’s and women’s tennis tournament in Indian Wells, CA traditionally held in March. Due to the COVID-19 pandemic, the organizers canceled the 2020 tournament and rescheduled for October 6 to 17, 2021, turning to Quest for assistance. Returning safely to the courts and courtside required a multifaceted effort. Quest employees registered all tournament participants and attendees and collected PCR and antigen samples (resulting in >4,500 samples) from all in attendance, including world-class players, coaches, family members, international media, tournament officials, and even VIP world champion tennis legend Billie Jean King. Quest employees tested Quest’s initiatives for returning to the “business of play” (continued) antigen samples directly on-site and provided results in fewer than 20 minutes. They also sent PCR samples out daily to Quest’s lab in San Juan Capistrano, CA. This was the third world-class tennis event in 2021 for which Quest served as the testing lab for the Association of Tennis Professionals (ATP) and the Women’s Tennis Association (WTA) — as part of its ongoing commitment to form innovative partnerships to enhance health, safety, and well- being in all walks of life. Our continued safe return to all we love As we learn to live with the ongoing challenges of COVID-19 and its endemic presence, Quest will continue to develop innovative partnerships to help us all return safely to the recreational activities that form such an important part of our lives. TABLE OF CONTENTS 2021 OVERVIEW COVID-19 RESPONSE PROMOTING A HEALTHIER WORLD CREATING AN INSPIRING WORKPLACE BUILDING VALUE REFERENCES
2021 CORPORATE RESPONSIBILITY REPORT I 23 Promoting a healthier world As the healthcare industry continues to evolve and new challenges emerge, Quest Diagnostics is well positioned to provide key clinical insights, thought leadership, and expertise. Our researchers dive deeply into our data to identify trends and raise awareness of disease states and health concerns that impact our world. Through dozens of peer-reviewed articles, our Quest Diagnostics Health Trends ® reports, educational seminars, and participation in healthcare leadership organizations, our shared expertise and advanced diagnostics resources are shaping practice and policy toward better health. View the complete series of Health Trends reports. } In addition, as part of Quest’s commitment to fighting healthcare disparities, we collaborate with nonprofits—especially through our $100-million investment in Quest for Health Equity (Q4HE)—to improve access to care through donated services and financial support. Visit the Q4HE website to learn more. } Goal 1 • Promoting a healthier world • Creating an inspiring workplace • Building value TABLE OF CONTENTS 2021 OVERVIEW COVID-19 RESPONSE PROMOTING A HEALTHIER WORLD CREATING AN INSPIRING WORKPLACE BUILDING VALUE REFERENCES
2021 CORPORATE RESPONSIBILITY REPORT I 24 In addition to serving about half of hospitals and physicians and approximately 1 in 3 adults each year in the US, Quest Diagnostics has become a recognized thought leader and innovator in COVID-19 research and services. Our original research and critical insights are highlighting the many unanticipated impacts of the pandemic on public health. Additionally, through Q4HE, we have taken a bold stand in committing to addressing testing access inequities in the short-term and disparities in outcomes into the future. Under our Quest Advanced ® offerings—concentrating initially on Neurology, Oncology, and Women's and Reproductive Health—Quest is focusing on developing a deep understanding of healthcare market trends and developing new high-quality tests and solutions to meet the emerging clinical needs of patients and providers in advanced and precision medicine. We are also playing an important role in the healthcare sphere with: • Peer-reviewed research articles in premier medical journals • Access to on-demand webinars and national conference presentations via our Clinical Education Center • Podcasts on multiple topics by clinical and operational experts • Speaking engagements by Quest executives, physicians, and researchers • Participation in national healthcare leadership groups, such as the College of Healthcare Information Management Executives (CHIME), American Clinical Laboratory Association (ACLA), and others Thought leadership marries insights to influence TABLE OF CONTENTS 2021 OVERVIEW COVID-19 RESPONSE PROMOTING A HEALTHIER WORLD CREATING AN INSPIRING WORKPLACE BUILDING VALUE REFERENCES
2021 CORPORATE RESPONSIBILITY REPORT I 25 ~60% of US adults delayed or skipped some in-person medical treatments or appointments during the pandemic, particularly Hispanic/Latinx adults (67%) as compared to White and Black adults (59% and 58%, respectively). 6 Concerns about exposure to the virus topped the list of reasons why US adults delayed or avoided in-person healthcare (53%), but many also recognize that this has now led to other health issues, including delayed diagnosis or treatment (18% and 23%, respectively) and worsening of symptoms (17%). 6 THOUGHT LEADERSHIP } HEALTH TRENDS Key insights on current and emerging healthcare issues Particularly during the first months of the COVID-19 pandemic, nonemergent ambulatory and outpatient clinic services were limited to preserve healthcare resources for patients who were critically ill with COVID-19. Combined with other restrictions, generalized fear about the risk of contagion, and increased unemployment with loss of healthcare benefits, these limits had multiple unintended consequences, including decreases in screening that have already caused significant delays in diagnoses. As a result, detection and diagnosis are happening at advanced stages rather than during early disease when treatment is most effective. Ultimately, this deferred care may lead to increases in late-stage disease, associated morbidity, and mortality. 5 “ We need to not only resume testing and treatment, but increase them above pre-pandemic levels to identify people who have delayed or skipped healthcare services. For serious and chronic conditions, a screening test is the first, and most critical, step.” Harvey W. Kaufman, MD Senior Medical Director, Head of Health Trends Research The Quest Diagnostics Health Trends ® series of reports are drawn from our billions of data points to provide key insights into current healthcare issues. Health Trends reports in 2020 and 2021have focused on important insights gained during the first years of the COVID-19 pandemic, including identifying significant declines in routine cancer screenings 1 as well as in recommended screenings for Americans at high risk for other serious medical conditions, including hepatitis C (HCV), 2 sexually transmitted infections (STIs), 3 and diabetes management. 4 Impact of pandemic-delayed testing and treatment TABLE OF CONTENTS 2021 OVERVIEW COVID-19 RESPONSE PROMOTING A HEALTHIER WORLD CREATING AN INSPIRING WORKPLACE BUILDING VALUE REFERENCES
2021 CORPORATE RESPONSIBILITY REPORT I 26 “ In the past years, we’ve made so many therapeutic advances in cancer care, but if a cancer isn’t diagnosed, it can’t be treated.” Kristie M. Dolan Vice President and General Manager, Oncology On August 31, 2021, original research from Quest Diagnostics scientists was published in the Journal of the American Medical Association (JAMA) Network Open 1 confirming one of the most dire unintended consequences of mitigation efforts to stop the COVID-19 pandemic: new diagnoses of the 8 most common cancer types in the US sharply declined during most of March 2020 to March 2021, the first year of the pandemic. This included cases of breast, prostate, colorectal, lung, pancreatic, esophageal, cervical, and gastric cancers. After significant decreases in the rate of cancer death from 1991 to 2017, 2 these crucial gains may be lost due to patients’ inability or reluctance to seek care, including regular cancer screenings, because of fear of the COVID-19 virus. In addition, the increased numbers of employees who lost their jobs due to business closures and COVID-19 mandates means a dramatic rise in numbers of Americans who were and may continue to be uninsured and thus even more reluctant to seek healthcare. Without routine screenings, the ability to diagnose early-stage cancers when they are most treatable is greatly reduced. Accordingly, many healthcare providers predict an upcoming wave of patients who were living with undiagnosed cancers during the pandemic who are later diagnosed with advanced cancers, requiring more aggressive treatment and resulting in increased morbidity and mortality. 3 Key insights on current and emerging healthcare issues (continued) A study from Quest Diagnostics and Boston Children's Hospital found that 1 in 2 (50.5%) American children under 6 years of age tested have detectable levels of lead, a toxic metal, in their blood. 4 It is the first study of its size and scale to examine blood lead levels (BLLs) as low as 1.0 μg/dL, which the researchers deemed “detectable” BLL. The researchers found that of the children tested 4 : • 50.5% had a detectable BLL of ≥ 1.0 μg/dL • 1.9% had elevated BLL of ≥ 5.0 ug/dL The research indicates that most American children have been exposed to lead, despite decades of public policy to reduce lead poisoning. A neurotoxin that causes irreversible health effects, including lower IQ, lead is found in many settings, including older homes, water pipes, areas with heavy industry, and some consumer products. “Our Quest analysis finds that while exposure to the highest levels of lead has declined in recent years, most American children are exposed to lead, a substance that, according to the CDC, is not safe for children at any level. Moreover, our analysis finds that kids in areas with the highest rates of poverty are also the most at risk, highlighting the critical role of social disparities in health,” notes Senior Medical Director and Head of Health Trends Research Harvey W. Kaufman, MD . Cancer diagnoses have increased Detectable lead levels in children’s blood TABLE OF CONTENTS 2021 OVERVIEW COVID-19 RESPONSE PROMOTING A HEALTHIER WORLD CREATING AN INSPIRING WORKPLACE BUILDING VALUE REFERENCES
2021 CORPORATE RESPONSIBILITY REPORT I 27 Trends ® 1 1. . The COVID - 19 pandemic worsened the drug crisis and physicians anticipate a continuing rise in overdose deaths 2 2 . . Physicians worry they have missed signs of drug misuse and use disorders during the pandemic and express concerns about telehealth Based on a first-of-its-kind study conducted by Quest Diagnostics, the Health Trends report Drug Misuse in America 2021 1 examines the contributing factors to the significant increase in overdose deaths seen during the pandemic and provides insights on barriers health professionals face in their ability to monitor and intervene with their patients at risk for drug misuse. 1 Key findings from the report include 1 : • The pandemic worsened the drug crisis, and physicians anticipate a continuing rise in overdose deaths • Physicians worry that they have missed signs of drug misuse during the pandemic and express concerns about recognizing signs of drug misuse during telehealth sessions • Physicians fear that illicit fentanyl will claim more lives than prescribed opioids • Despite physician confidence in counseling patients, nearly half of tested patients show drug misuse • Clinical drug testing is deemed critical, but clearer guidelines would help optimize its use “Clinical drug testing gives physicians the ability to uncover insights into problematic drug use before the worst outcomes can occur. [Although] our research shows that physicians overwhelmingly value clinical drug testing in patient management... there remains an unmet need for clear clinical guidelines regarding when and how to test, which tests to use, and the frequency of testing.” Jeffrey Gudin, MD Senior Medical Advisor, Drug Monitoring and Toxicology 1 Health Trends ® Drug Misuse in America 2021 Physician Perspectives and Diagnostic Insights on the Drug Crisis and COVID-19 November 2021 3 3 . . Physicians are prescribing more gabapentin than opioids for chronic pain and worry patients will turn to illicit fentanyl 4 4 . . Despite physician confidence in counseling patients, nearly half of tested patients show drug misuse 5 5. . Clinical drug testing is deemed critical, but clearer guidelines would help optimize its us e Quest, Quest Diagnostics, any associated logos , and all associated Quest Diagnostics registered or unregistered trademarks are the property of Quest Diagnostics. All third-par ty marks— ® and ™— are the property of their respective owners. © 2021 Quest Diagnostics Incorporated. A ll rights reserved. MI10758 11/2021 Key insights on current and emerging healthcare issues (continued) Physicians worry about missing signs of drug misuse and fear fentanyl will be deadlier than opioids TABLE OF CONTENTS 2021 OVERVIEW COVID-19 RESPONSE PROMOTING A HEALTHIER WORLD CREATING AN INSPIRING WORKPLACE BUILDING VALUE REFERENCES
2021 CORPORATE RESPONSIBILITY REPORT I 28 New biomarkers offer pathways to prevention Quest has expanded from our original primary focus on heart disease to a multi-pronged proactive approach that focuses on critical diagnostic insights across the cardiometabolic continuum. This unique interconnected approach ensures that healthcare providers have a complete survey of a patient’s cardiometabolic health and supports earlier preventive intervention. Our Cardiometabolic Center of Excellence ™ at Cleveland HeartLab ® offers clinicians novel, proprietary, specialized cardiometabolic testing, services, and education resources to shine a light on patients with high risk of heart disease and metabolic-associated conditions—aiming to improve outcomes through early identification and intervention for the leading cause of death in the US. Quest contributes novel cardiovascular disease (CVD) biomarker implementation, population health analytics, and a national lab platform as a supporter of One Brave Idea ™ , a research initiative cofounded by the American Heart Association and Verily Life Sciences with significant support from AstraZeneca. One Brave Idea is dedicated to using novel diagnostic techniques to change how CVD, including stroke, is detected, prevented, and treated. Quest is providing financial and in-kind testing support. Our Clinical Education team includes dedicated experts for peer-to-peer clinical support. We help healthcare providers stay on the forefront of care, navigate clinical science and testing, and make insight-driven decisions. The Clinical Education and 4myHeart ® Patient Education teams focus on setting education strategies and supporting our provider and patient customers through one-on-one medical consultations and a range of powerful, clinically relevant online tools and resources. THOUGHT LEADERSHIP } ADVANCED DIAGNOSTICS Improving outcomes for the leading cause of death in the US Addressing racial disparities in women’s heart health In February, as part of our American Heart Month awareness efforts, we were honored to host a webinar with a distinguished keynote speaker: Rachel M. Bond, MD, FACC, a faculty physician in cardiology at the Dignity Health Medical Group, Mercy Gilbert and Medical Director of Women’s Heart Health for Dignity Health Arizona. Dr Bond is a board-certified cardiologist and a member of the advisory board at Quest’s Cardiometabolic Center of Excellence at Cleveland HeartLab, providing her expertise on women’s heart health and racial disparities. Our event ’ s moderator was Trisha Winchester, Senior Manager, Clinical Education, Cleveland HeartLab. Over 500 individuals registered for the event. To coincide with Black History Month, the webinar aimed to examine the impact that social determinants of health play in in CVD. CVD is is the leading cause of death among women in the US with 1 of every 5 deaths of American women due to heart disease. 1,2 Dr Bond discussed current gaps in risk assessment, health equity, and racial disparities in heart health, emphasizing that CVD is deadliest among Black Americans, with mortality rates for Black women nearly 30% higher than for White women. 3 Further, African-Americans have the highest prevalence of total CVD—including coronary artery disease, hypertension, heart failure, and stroke—among all racial and ethnic groups, affecting 60.1% of men and 57.1% of women. 4 TABLE OF CONTENTS 2021 OVERVIEW COVID-19 RESPONSE PROMOTING A HEALTHIER WORLD CREATING AN INSPIRING WORKPLACE BUILDING VALUE REFERENCES
2021 CORPORATE RESPONSIBILITY REPORT I 29 THOUGHT LEADERSHIP } ADVANCED DIAGNOSTICS Disparities in breast cancer mortality and treatment underscore the importance of testing Quest Advanced ™ Oncology provides testing, advanced services, and expert physician consultation across the entire cancer care continuum. Our advanced testing solutions include molecular, genetic, and genomic testing for hematopathology and solid tumors; esoteric tests requiring higher-order skill, expertise, and service; and precision medicine, including FDA-cleared and/or approved companion diagnostics. In addition, we provide expert physician consultation by more than 650 MDs and PhDs. Our advanced oncology services also include a variety of educational opportunities. For National Breast Cancer Awareness month in October, Quest was proud to sponsor Sisters Network Inc.—the nation’s oldest, largest, and only national Black breast cancer survivorship organization in the US—and its first-ever State of Black Breast Cancer Crisis: a National Townhall Virtual Discussion and Call to Action. The townhall featured comments from medical experts, elected officials, and key national leaders, including congressional representatives and the Reverend Al Sharpton, with moderation by CNN National Correspondent Athena Jones. Participants heard experts and advocates discuss one of the most critical health issues facing Black women. The mortality rate for Black women with breast cancer is 41% higher than that of their White counterparts 1 Black women under 35 years of age are diagnosed with breast cancer at twice the rate of White women and die at 3 times the rate 2 Chaunté Lowe, a 4-time Olympian in track and field, patient advocate, and ambassador, also spoke about this topic with the Oncology team during Quest’s annual Accelerate sales conference. Chaunté discussed her experience as a Black breast cancer survivor and worked with the Oncology team throughout the year to raise awareness of the importance of diagnostic testing during a cancer patient’s journey. Chaunté, who was never offered hereditary cancer screenings as part of her initial breast cancer treatment, is now receiving genetic counseling through Quest. “ As an Olympian and as a breast cancer survivor, I’ve learned the importance of following my intuition. If you have a family history of cancer, trust your instincts. Get answers for yourself with hereditary cancer screenings and genetic testing.” Chaunté Lowe 4-time Olympian, patient advocate, and ambassador TABLE OF CONTENTS 2021 OVERVIEW COVID-19 RESPONSE PROMOTING A HEALTHIER WORLD CREATING AN INSPIRING WORKPLACE BUILDING VALUE REFERENCES
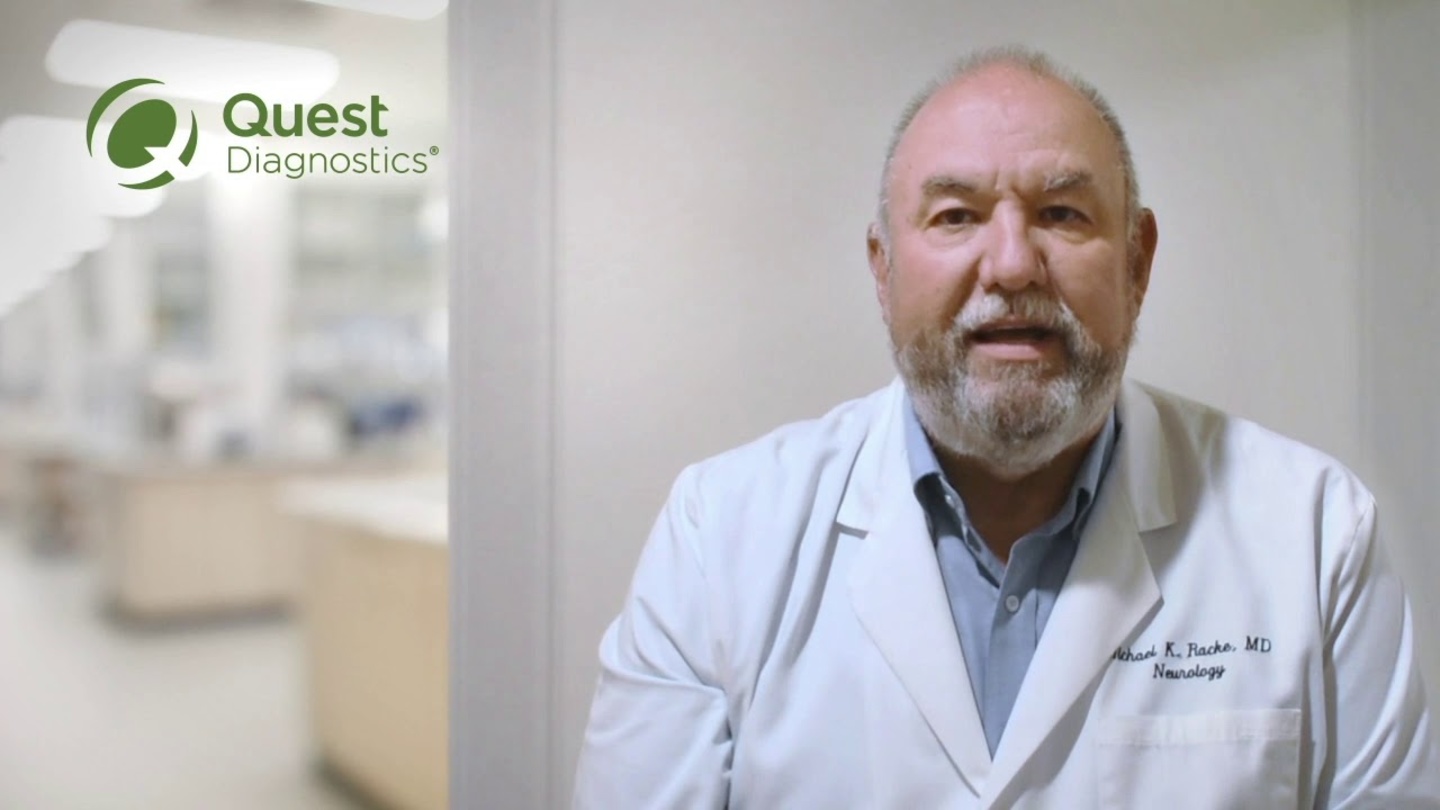
2021 CORPORATE RESPONSIBILITY REPORT I 30 THOUGHT LEADERSHIP } ADVANCED DIAGNOSTICS Expanding the possibilities with Quest Advanced ® Neurology Neurological and psychiatric outcomes in survivors of COVID-19 1 in 3 COVID-19 patients were diagnosed with a neurological or psychiatric disorder within 6 months of infection, per a retrospective cohort study using electronic health records (EHRs) of 236,379 COVID-19 survivors. 1 Undiagnosed conditions due to deferred care are adding further to this crisis. Quest initiatives provide outreach and support for healthcare providers in uncovering undiagnosed conditions with targeted lab testing and education. Quest Advanced ® Neurology offers a complete neurological testing portfolio, including molecular, biochemical, neuroimmunological, cytogenetic, and pharmacogenomic testing for diagnosing neurological conditions. Our broad menu of over 400 neurology tests is powered by 15 distinct methodologies, providing transformative answers. Our 650+ medical experts provide consultation on next steps for physicians’ patients, and we invest in state-of-the-art testing and technology, helping to drive accurate diagnoses for even the most complex cases. Pharmacogenomics testing Pharmacogenomics assesses how a patient’s genes impact their potential response to specific medications and gives healthcare providers additional insights to optimize treatment considerations for better outcomes. We offer one of the most comprehensive test panels available today, the Quest Diagnostics Pharmacogenomics Panel, which provides information on more than 40 genes. Such testing is particularly helpful for patients taking several medications who may otherwise require multiple panels. Physicians receive test results in a comprehensive and easy-to-understand report, which can be used as a reference for patients throughout their lifetimes. Pioneering early Alzheimer’s disease assessment Actively striving to end Alzheimer’s disease (AD), Quest worked to create a new, accessible, and affordable blood-based biomarker test to assess AD risk. The assay allows healthcare providers to establish a baseline and monitor their patients over time using a simple blood sample. Late in 2021, published research confirmed that such assays are as effective as traditional cerebrospinal fluid (CSF) testing and amyloid positron emission tomography (PET) scans in identifying early signs of AD. 2-4 Blood-based biomarker testing may also help identify patients who are candidates for early antibody treatment, 5,6 which may help slow disease progression and improve quality of life. TABLE OF CONTENTS 2021 OVERVIEW COVID-19 RESPONSE PROMOTING A HEALTHIER WORLD CREATING AN INSPIRING WORKPLACE BUILDING VALUE REFERENCES
2021 CORPORATE RESPONSIBILITY REPORT I 31 ADVANCING HEALTH EQUITY } QUEST FOR HEALTH EQUITY (Q4HE) Advancing healthcare equity in underserved communities “ Together, we will leverage our insights, our knowledge, and our collective commitment to help ensure everyone— regardless of income, ethnicity, geography, or demographics— has equal opportunity for better health.” Mandell Jackson Vice President and General Manager, Q4HE The COVID-19 pandemic has had a disproportionate impact on those from certain racial and ethnic groups. This has served to further expose the enduring healthcare disparities that existed long before the pandemic. We continue to engage in meaningful cooperative initiatives to face and help resolve the root causes of the systemic inequities fueling this crisis and work towards impactful solutions. Launched in 2020, Quest for Health Equity, or Q4HE, is an initiative established by Quest Diagnostics and the Quest Diagnostics Foundation focused on taking action to address health disparities across the US. Through education, engagement, empowerment, and access, Q4HE aims to provide access to essential resources for underserved communities. With strong support from Quest Diagnostics leadership, Q4HE draws upon leadership and expertise from across the organization. Because Quest understands that achieving health equity is a marathon, not a sprint, Q4HE is supporting multiple national, regional, and local programs directed at the critical challenges faced by traditionally underserved communities. Following are a few snapshots of Q4HE’s many efforts. Quest mobile unit supports a community COVID-19 testing event in Newark, NJ. Q4HE strategies • COVID-19 testing, vaccinations, and treatment • Funding programs that address the root causes of health inequities • Partnering with organizations focused on creating lasting change for persons in groups that have been historically marginalized, initiating education and outreach efforts, and otherwise enabling better health outcomes TABLE OF CONTENTS 2021 OVERVIEW COVID-19 RESPONSE PROMOTING A HEALTHIER WORLD CREATING AN INSPIRING WORKPLACE BUILDING VALUE REFERENCES
2021 CORPORATE RESPONSIBILITY REPORT I 32 ADVANCING HEALTH EQUITY } Q4HE KEY INITIATIVES } EDUCATION Keeping kids and families healthy and active Q4HE supports local, regional, and state programs to help engage under-resourced communities, providing educational programs to promote lifelong healthy behaviors, including: American Diabetes Association (ADA)— for Project Power: a free, at-home, online experience consisting of lessons and activities for children and their families; helps support youth at risk for type 2 diabetes, promoting healthy habits, nutrition education, increased physical activity, and family involvement Sesame Workshop— serves children and families in rural and urban environments to promote healthy behaviors and child well-being Cooking Matters— supports a Connecticut-based community nutrition, health, and wellness program focused on reducing obesity and its related health risks Healthy NewsWorks (HNW)— empowers elementary and middle-school students to advocate for health literacy through school-based journalism programs Primary Care of Southwest Georgia— provides support for a second school-based clinic and a van to expand health services for rural communities in southwest Georgia The Social and Health Research Center (SAHRC)— facilitates expansion by digitizing the Bienestar/NEEMA Coordinated School Health Program, an evidenced-based curriculum designed to educate and engage children in underserved populations in positive behaviors to reduce the health risks of obesity, diabetes, respiratory ailments, and other predisposing conditions The Green Bronx Machine— expands an innovative program that provides hands-on classroom learning through agriculture. Students and teachers grow vegetables using the plant-cultivation method known as aeroponics in which roots are positioned to hang suspended in the air as nutrients are delivered via a fine mist. The system lends itself to lessons in multiple subjects including science, math, and language arts, and the food grown is used in school nutrition programs “ In collaboration with a growing number of organizations, we’re addressing disparities that historically have made it difficult for underserved communities to access the care and resources they need to experience better health outcomes.” Ruth Clements Vice President and General Manager, Infectious Diseases and Immunology and Leader of Q4HE TABLE OF CONTENTS 2021 OVERVIEW COVID-19 RESPONSE PROMOTING A HEALTHIER WORLD CREATING AN INSPIRING WORKPLACE BUILDING VALUE REFERENCES
2021 CORPORATE RESPONSIBILITY REPORT I 33 ADVANCING HEALTH EQUITY } Q4HE KEY INITIATIVES } ENGAGEMENT Eliminating disparities in healthcare leadership Bluford Healthcare Leadership Institute Quest Diagnostics is collaborating with the Bluford Healthcare Leadership Institute (BHLI), a professional development program focused on eliminating health disparities among minority and vulnerable populations. BHLI supports culturally diverse students nationwide to prepare them for leadership roles in healthcare through an intense professional development program. Upon completing the program, scholars participate in a paid internship at a leading healthcare or partnering organization where they gain firsthand C-suite experience in strategy, planning, and collaboration efforts between the administrative and clinical teams of a healthcare system. American Heart Association HBCU & HSI Scholars In 2021, the Quest Diagnostics Foundation began an aggressive expansion of several key initiatives designed to increase access to healthcare in underserved “ We look forward to a long-term relationship with Quest to help change the trajectory of healthcare disparities.” John W. Bluford III Founder and President, Bluford Healthcare Leadership Institute communities while increasing the ranks of diverse healthcare professionals. Such efforts have included a commitment to the American Heart Association (AHA) toward programs for Black and Hispanic scholars. Since 2015, AHA’s Historically Black Colleges and Universities (HBCU) Scholars Program has been building a more representative future workforce through academic and career mentoring programs that help prepare minority undergraduates for careers in the sciences and healthcare professions. Because opportunities for mentorship and strong social support are factors affecting student success, a vital component of the Scholars Program is a virtual leadership and professional development series to help position students for success beyond graduation. Building on the success of the HBCU program, AHA launched the Hispanic Serving Institutions (HSI) Scholars Program that engages and inspires Hispanic students to pursue careers in medicine and scientific research. Opportunities to move forward * • 84 scholars • 74 mentors • 21 internships at premier healthcare companies • Collaborations: 28 research institutions, 23 HBCUs, 9 HSIs • Program graduates continuing on to pursue advanced degrees or obtain positions in healthcare *2021-2022 school year TABLE OF CONTENTS 2021 OVERVIEW COVID-19 RESPONSE PROMOTING A HEALTHIER WORLD CREATING AN INSPIRING WORKPLACE BUILDING VALUE REFERENCES
2021 CORPORATE RESPONSIBILITY REPORT I 34 ADVANCING HEALTH EQUITY } Q4HE KEY INITIATIVES } ENGAGEMENT Addressing COVID-19 in Black communities: Choose Healthy Life Choose Healthy Life (CHL) is a sustainable, scalable, and transferable approach to address public health disparities and inequities in the Black community by establishing a health workforce in Black churches. Quest Diagnostics became a founding partner and sponsor of the Choose Healthy Life program, providing financial support through the Quest Diagnostics Foundation as well as COVID-19 testing and outreach support, to evolve CHL’s proven model to address the pandemic. “The Quest partnership allows us to confront, in real time, the lack of access many of our neighbors faced with testing. It also demonstrates that faith and science can work together to address our needs.” Reverend Jacques Andre DeGraff New York Chair, CHL; Canaan Baptist Church of Christ, Harlem, NY On Martin Luther King, Jr Day, January 15, 2021— 1 year after the first confirmed case of COVID-19 in the US—the Reverend Al Sharpton and the Reverend Calvin O. Butts III hosted the Choose Healthy Life Black Clergy Conclave, a convening of 100+ Black clergy, America’s leading public health officials, and corporate and scientific leaders. Their goal was to step into the breach and address COVID-19 in the Black community as part of a national mobilization effort to boost testing and health resources. Building on success • Started with 50 churches in 5 cities • Expanded in 2021 to 120 churches in 13 states and the District of Columbia • Close to 60,000 vaccinated in 1,500 events across the country TABLE OF CONTENTS 2021 OVERVIEW COVID-19 RESPONSE PROMOTING A HEALTHIER WORLD CREATING AN INSPIRING WORKPLACE BUILDING VALUE REFERENCES
2021 CORPORATE RESPONSIBILITY REPORT I 35 ADVANCING HEALTH EQUITY } Q4HE KEY INITIATIVES } EMPOWERMENT & ACCESS Q4HE aims to improve healthcare access Community programs Bridge to Health— for programs to improve access to healthcare for underserved communities in New Mexico via 100 community partnerships Presbyterian Medical Services— to implement the New Mexico Diabetes Prevention Action to provide intervention and support services for patients in underserved areas Family Christian Health Center— to support partnerships with the faith-based community to expand awareness and education related to COVID-19 testing and vaccination as well as chronic health-related issues; this center is a federally qualified health center (FQHC) providing care for underserved populations in Illinois American Heart Association— to support efforts to provide evidence-based hypertension resources and COVID-19 Rapid Response grants for FQHCs and community clinics nationwide Long-term care facilities Cedarbrook Senior Care Rehabilitation— for their long-term care facilities that were among the hardest hit by the pandemic; where Q4HE provided twice-weekly COVID-19 PCR testing for 600 staff members and 500 residents at their facility in Pennsylvania Project HOPE— to support COVID-19 testing for this international global health and humanitari an relief organization; Project HOPE dramatically expanded its support services in 93 long-term care facilities, representing around 11,000 residents and more than 5,400 cases of COVID-19 University programs Clark Atlanta University— to develop an online portal where students, faculty, and staff were able to register for free COVID-19 PCR tests; more than 1,000 people received tests and educational resources, enabling them to participate more safely in academic life on campus National Black College Alumni Hall of Fame Foundation, Inc.— for participation in the National Sustainability Summit to help HBCUs identify and address COVID-19 testing needs at their institutions Thanks to a grant from Q4HE, the FQHC Salud Integral en Ia Montaña expanded its range of primary medical care services, successfully opening Puerto Rico’s first post–COVID-19 care clinic, where a growing number of patients with long-COVID symptoms receive critical, tailored care. The clinic provides care for patients in 7 underserved municipalities in Central Puerto Rico with a multidisciplinary team addressing short-, medium-, and long-term health conditions exacerbated by COVID-19 disease complications. Addressing “long COVID” in Puerto Rico Q4HE is supporting various entities to improve access to COVID-19 testing and quality health resources—enabling better health outcomes in underserved groups. TABLE OF CONTENTS 2021 OVERVIEW COVID-19 RESPONSE PROMOTING A HEALTHIER WORLD CREATING AN INSPIRING WORKPLACE BUILDING VALUE REFERENCES “ Scientific evidence reveals that a majority of patients [with] COVID-19 face a variety of ongoing symptoms. In response, we established a team of medical specialists who can help our patients address and overcome these debilitating ailments. With Q4HE’s support, this team is able to provide highly specialized and critical care. ” Dr Nelson Almodóvar Medical Director, Salud Integral en Ia Montaña
2021 CORPORATE RESPONSIBILITY REPORT I 36 CONSUMER-FOCUSED SERVICES Quest HealthConnect ™ : Personalized access to quality healthcare Quest HealthConnect ™ is dedicated to increasing access to quality extended care services that: • Enable health plans and clinical providers to more effectively assess vulnerable patients and close critical gaps in care • Help to increase access to quality healthcare by delivering individualized care options that connect patients where they are—whether at home, in a local Quest patient service center, or another convenient setting • Improve satisfaction among members of healthcare plans, particularly those enrolled in Medicare and managed Medicaid • Facilitate early detection of chronic and acute illness • Enhance member education and their ability to take full advantage of their benefits • Improve overall quality of care Enabled by a national network of trusted, long-standing relationships with medical professionals, Quest HealthConnect provides a personalized approach, often at members’ homes, through an on-site Health Risk Assessment (HRA). HRAs factor in crucial social determinants of health combinations—including housing and transportation, psychosocial factors, access to nutritious food, financial barriers, and access to community services and resources—to help members understand their health risks and take steps to improve their overall health. Health plans use data obtained from the HRAs to: • Coordinate care with physicians who can guide patients in taking appropriate preventive care measures to reduce identified health risks • Help members get ahead of common chronic medical conditions, including cardiovascular disease (CVD), diabetes, and kidney disease In addition to HRAs, Quest HealthConnect offers additional services, including screenings for diabetic retinopathy, diabetes, osteoporosis, and colorectal cancer. TABLE OF CONTENTS 2021 OVERVIEW COVID-19 RESPONSE PROMOTING A HEALTHIER WORLD CREATING AN INSPIRING WORKPLACE BUILDING VALUE REFERENCES
2021 CORPORATE RESPONSIBILITY REPORT I 37 CONSUMER-FOCUSED SERVICES Increasing access to preventive care through QuestDirect ™ QuestDirect ™ helps patients obtain the information they need to support a healthy life by enabling them to conveniently shop online and choose their own lab tests. Licensed professionals from Everly Health and affiliated professional entities provide clinical oversight of lab testing, including ordering selected tests and providing treatment, when appropriate. QuestDirect has launched a new comprehensive preventive care service that adults throughout the US can now access without visiting a doctor’s office. Following 2 years of delayed or disrupted healthcare due to the COVID-19 epidemic, our new offering is intended to increase individuals’ access to healthcare at their convenience. The Basic Health Profile includes many of the same laboratory tests a physician might order during an annual wellness visit, such as a complete blood count, a comprehensive metabolic panel, urinalysis, and cholesterol panel. The expanded Comprehensive Health Profile provides a first-of-its-kind digital engagement telehealth solution, providing a deep dive into an individual’s overall health and wellness. An individual profile combines tests and biometric screenings, including tests for heart, kidney, liver, and bone health; diabetes risk; and other health factors. Testing also includes the collection of key physical measurements and an HRA that captures family medical history and current health and wellness behaviors, such as mental health, stress levels, amount of physical activity, and diet. Combined with the individual’s diagnostic test results, the metrics provide a personalized risk assessment. The “Health Quotient Score,” a unique numerical representation developed by Quest, provides a result from 1 to 100. The higher the score, the better the person’s health. Results can be discussed through an included virtual doctor’s visit or shared with the person’s healthcare practitioner via Quest’s secure, online patient portal, MyQuest ® . People can use their initial Health Quotient Score as their baseline and then track results over time to assess progress against their health goals. Licensed physicians oversee all lab testing based on the information the person provided to Quest and are available to discuss any of the lab results. These physicians may also provide treatment for certain conditions, in some states, and recommend further medical follow-up. “The pandemic has accelerated trends already underway, from telehealth to retail healthcare delivery, and especially around digital engagement. Customers now expect to interact digitally with healthcare companies in the same way they're accustomed to working with other service brands. As a result, we're continuing to make significant investments to make sure we can deliver a seamless, contemporary digital experience for all our customers.” Richard Adams Vice President and General Manager, Consumer-initiated Testing TABLE OF CONTENTS 2021 OVERVIEW COVID-19 RESPONSE PROMOTING A HEALTHIER WORLD CREATING AN INSPIRING WORKPLACE BUILDING VALUE REFERENCES
2021 CORPORATE RESPONSIBILITY REPORT I 38 The experience, expertise, and passion that our nearly 50,000 employees bring to Quest every day are what set us apart. We prioritize creating an environment where employees feel welcomed, included, valued, and challenged to grow. This fuels a culture of innovation and progress, benefiting stakeholders. On our journey to create a high-performing and inclusive culture, we invest in the development and well-being of our employees through training, mentoring, coaching, and counseling to ensure they have a safe place to share feedback and learn new skills. Creating an inspiring workplace Goal 2 • Promoting a healthier world • Creating an inspiring workplace • Building value TABLE OF CONTENTS 2021 OVERVIEW COVID-19 RESPONSE PROMOTING A HEALTHIER WORLD CREATING AN INSPIRING WORKPLACE BUILDING VALUE REFERENCES
2021 CORPORATE RESPONSIBILITY REPORT I 39 Our equitable compensation program Our compensation programs are designed to attract, retain, and motivate a wide variety of employees and to help drive the execution of our business objectives and strategic goals. Our competitive base pay reflects several factors, including individual roles and responsibilities, skills, experience, and performance. We also have designed our compensation programs to align with market compensation (in the relevant geography, as appropriate) based on robust market benchmarking. Beyond salary, Quest’s compensation package includes variable pay, other forms of financial recognition, and a comprehensive benefits offering, including 401K, paid time off, workplace flexibility, remote work options, and healthcare coverage. We also compensate nonexempt employees with overtime pay and pay shift differentials when appropriate. Identifying, hiring, and managing talent Our ability to evolve, expand, and develop world-class innovations relies on a culture that respects all employees and supports their contributions. Quest’s Talent Acquisition team proactively sources talented candidates with unique skills, backgrounds, experiences, and expertise from multiple ethnicities, ages, and cultures to fill open positions. We work to identify and recruit people whose strong skill sets and perspectives represent our company. When Quest hires or promotes from within, we consider each candidate’s qualifications and experience, as well as market-based information, as we strive to be externally competitive and internally equitable. Quest uses narrow role-based salary ranges for new hires and continuing employees alike. Our Human Resources function oversees our annual talent review process so that performance reviews are fair, well-documented, and unbiased. A STRONG FOUNDATION Our culture rests on equity in compensation and opportunity “ Being an employer of of choice is about the entire package—the right fit, competitive compensation and relevant benefits, and a culture that values and celebrates diversity.” Noreen M. Farrell Vice President, Rewards and Analytics As an organization, we are committed to fostering an inclusive workplace that welcomes new perspectives, complementary experiences, and diverse expertise. We know that these attributes strengthen our ability to surpass our customers’ and our communities’ expectations. That commitment includes providing all our employees with equitable compensation and development opportunities. TABLE OF CONTENTS 2021 OVERVIEW COVID-19 RESPONSE PROMOTING A HEALTHIER WORLD CREATING AN INSPIRING WORKPLACE BUILDING VALUE REFERENCES
2021 CORPORATE RESPONSIBILITY REPORT I 40 Quest Diagnostics prioritizes diversity across the entire talent lifecycle. Our commitment to an inclusive culture and diverse workforce begins with our “CTC Framework,” developed in 2020. Our 3 pillars of Culture, Talent, and Communities ensure our approach is well balanced across our priorities. We support our employees throughout their careers at Quest, from onboarding, through performance, development, and career progression, and we identify opportunities for action. We celebrate the different ethnicities, ages, cultures, and lifestyles that make up our workforce. As the marketplace becomes increasingly global, our ability to meet the needs of all of our stakeholders is enhanced by our demonstrated commitment to diversity that mirrors the communities where we live and work every day. A STRONG FOUNDATION Creating opportunities for excellence Group Female Male Asian Black Hispanic Other people of color * All people of color White Executive/Senior Managers 42.6% 57.4% 13.0% 4.6% 3.8% 2.3% 23.7% 76.3% First/Mid-Level Managers & Professionals 60.9% 39.1% 14.4% 10.9% 8.7% 3.1% 37.1% 62.9% Technicians 81.9% 18.1% 15.9% 25.2% 19.2% 3.6% 63.9% 36.1% Sales 60.9% 39.1% 4.3% 8.1% 12.9% 1.5% 26.8% 73.2% All other roles 64.4% 35.6% 12.1% 26.2% 16.1% 3.4% 57.8% 42.2% Total 71.8% 28.2% 14.0% 22.8% 16.2% 3.5% 56.5% 43.5% Equal Employment Opportunity (EEO)-1 data *Other people of color/2 or more races • Data reflect our US employee population; 97.5% of Quest’s employee population is US-based • Data exclude employees who did not elect to disclose their race/ethnicity • The EEOC defines EEO-1 job categories based on employee skill level, knowledge, and responsibilities • Executive/Senior Managers include individuals who plan, direct, and formulate policies, set strategy, and provide the overall direction of the company • First-/Mid-Level Managers and Professionals include individuals who serve as managers, including those who oversee and direct the delivery of products, services, or functions at group, regional, or divisional levels of organizations • Technicians include jobs that require specific skills to be applied in the work environment; examples include medical technicians, engineering technicians, and technology professionals TABLE OF CONTENTS 2021 OVERVIEW COVID-19 RESPONSE PROMOTING A HEALTHIER WORLD CREATING AN INSPIRING WORKPLACE BUILDING VALUE REFERENCES “ We are committed to promoting an inclusive culture and strive to be a place where all employees feel supported and inspired to bring their whole selves to work. Bringing your authentic self to work helps create a sense of belonging, builds trust, and fosters a more collaborative environment.” Cecilia K. McKenney Senior Vice President and Chief Human Resources Officer
2021 CORPORATE RESPONSIBILITY REPORT I 41 A STRONG FOUNDATION Workforce demographics At Quest Diagnostics, variety in skills and experiences is one of our competitive advantages. As part of our commitment to inclusion and diversity, we continue to provide new views of the diversity of our workforce. Quest is proud to continue our journey to provide more transparency in our reporting. TABLE OF CONTENTS 2021 OVERVIEW COVID-19 RESPONSE PROMOTING A HEALTHIER WORLD CREATING AN INSPIRING WORKPLACE BUILDING VALUE REFERENCES Total workforce breakdown by age Group American Indian Asian Black/African - American Hispanic/ Latino Pacific Islander Other people of color * All people of color White All Management 0.4% 11.5% 11.3% 8.4% 0.5% 2.2% 34.3% 65.7% Senior Management 0.4% 13.1% 4.6% 3.8% 0.1% 1.7% 23.7% 76.3% Junior Management 0.6% 12.2% 19.6% 12.5% 0.7% 2.6% 48.2% 51.8% Revenue-Generating Management 0.4% 2.1% 7.7% 5.5% 0.4% 1.3% 17.4% 82.6% All STEM Roles 0.5% 22.7% 14.6% 11.5% 0.5% 2.2% 52.0% 48.0% Select workforce breakdown by race and ethnicity Select workforce breakdown by gender Male Key Female 29 + 71 + M 31 + 69 + M 60 + 40 + M 42 + 58 + M 53 + 47 + M All STEM a Roles Revenue- Generating Management Junior Management Senior Management All Management 20-29 (14.2%) Key 30-39 (22.7%) 40-49 (23.4%) 50-59 (23.5%) 60-69 (14.1%) 70+ (2.1%) • Data reflect our US employee population; 97.5% of Quest’s employee population is US-based • Data exclude employees who did not elect to disclose their race/ethnicity • Senior management includes individuals who plan, direct, and formulate policies, set strategy, and provide the overall direction of the company • Junior management refers to front-line managers and supervisors; these individuals are responsible for directing and executing the daily operational objectives of the company • Revenue-generating functions refer to management roles in departments such as sales, or that contribute directly to the output of products or services • STEM functions require the knowledge of STEM concepts in their daily responsibilities Female: 59.4% Male: 40.6% Female: 42.6% Male: 57.4% Female: 69.5% Male: 30.5% Female: 47.2% Male: 52.8% Female: 70.7% Male: 29.3% 13 + 23 + 23 + 24 + 14 + 3 + M Total Workforce * Other people of color/2 or more races a Science, Technology, Engineering, and Mathematics (STEM)
2021 CORPORATE RESPONSIBILITY REPORT I 42 Workforce new hire American Indian Asian Black/African- American Hispanic/ Latino Pacific Islander Other people of color* All people of color White Female 0.7% 5.9% 24.5% 15.6% 0.3% 0.7% 47.7% 27.0% Male 0.1% 3.1% 6.3% 5.0% 0.2% 0.2% 14.9% 10.4% Female Male 74.7% 25.3% Workforce demographics (continued) • Data reflect our US employee population; 97.5% of Quest’s employee population is US-based • Data exclude employees who did not elect to disclose their gender or race/ethnicity “ We work actively, every day, to make sure our values are authentically reflected in our workforce and culture. Extraordinary results start with extraordinary goals.” Ebony D. David Executive Director and Human Resources Business Partner, Corporate Social Responsibility and Inclusion and Diversity *Other people of color/2 or more races We demonstrate our commitment to inclusion and diversity through our results in external hiring at all levels. We strive to provide a balanced slate of qualified candidates to our hiring managers. We engage agencies to assist us in identifying talent from a range of racial and ethnic backgrounds in addition to women, Veterans, and people with disabilities. Lastly, we are expanding our reach to diverse talent in our early career/university hiring by collaborating with various colleges/ universities throughout our footprint to create a pipeline of diverse talent in our entry-level roles. TABLE OF CONTENTS 2021 OVERVIEW COVID-19 RESPONSE PROMOTING A HEALTHIER WORLD CREATING AN INSPIRING WORKPLACE BUILDING VALUE REFERENCES
2021 CORPORATE RESPONSIBILITY REPORT I 43 EMPLOYEE WELL-BEING Benefits that support wellness and prevention Quest’s commitment to helping achieve improved health outcomes extends to the health and well-being of all members of our Quest family. Every year, Quest works to enhance the healthcare benefits we offer to consistently provide employees access to high-quality, affordable healthcare that meets their and their family’s needs. We recognize that not only is such access critical, it’s also deeply personal. We therefore offer benefits for who our employees are, wherever they are in their own unique journey. We introduced changes that reflect our employees’ feedback about what they need to achieve balance—healthy in body and mind, at work, at home, and in life in general. Recognizing the need to support a “whole person” approach is more important than ever, particularly in light of the challenges brought on by the COVID-19 pandemic over the last 2 years. Quest’s goal is to help our employees achieve that critical balance for optimal physical and mental health through our health and wellness benefits. Virtual health solutions through Blueprint for Wellness ® Quest’s Blueprint for Wellness ® population healthcare solution for employers uses biometric wellness screenings combined with services that connect employees to the care they need for health improvement. As a large, self-insured employer with nearly 50,000 employees, Quest provides Blueprint for Wellness as an employee benefit that includes spouses and partners. Individuals donate a blood specimen for comprehensive testing, and key measurements are taken, including weight, height, blood pressure, and waist and/or hip circumference. The tests conducted for each participant let participants and their doctors know about conditions that may be developing, like pre-diabetes and diabetes, high cholesterol, kidney disease, and metabolic syndrome. These can often be successfully treated or reduced before they become more difficult and expensive to address. Quest offers innovative and proven programs that engage employees and family members in improving their health (see examples below). healthy MINDS: A refreshed approach to employee mental well-being Quest continues to prioritize how we support employees’ emotional health through offering and expanding access to high-quality, affordable mental health resources and providers. We do so under the banner of healthy MINDS, our refreshed approach to supporting employees’ mental well-being, aimed at helping colleagues feel safe and empowered to seek support. Prevent Science-based Omada health management program to prevent type 2 diabetes Manage Onduo program (new in 2021) for optimal management of diabetes; app-based Reverse Virta (new in 2021) provider-led, clinically proven, app-based, nutritional intervention and coaching Virtual solutions help employees and family members achieve better health. TABLE OF CONTENTS 2021 OVERVIEW COVID-19 RESPONSE PROMOTING A HEALTHIER WORLD CREATING AN INSPIRING WORKPLACE BUILDING VALUE REFERENCES
2021 CORPORATE RESPONSIBILITY REPORT I 44 EMPLOYEE WELL-BEING Safely working together While office-based employees worked remotely during the pandemic, the majority of our nearly 50,000 colleagues were literally on the front lines in 2021, continuing to work at our lab facilities, in logistics and transport, and in our patient service centers. Safety protocols had to be updated continually as conditions evolved. Early in the pandemic, Quest assembled a cross- functional taskforce with representatives from the company’s Medical, Human Resources, Environmental Health and Safety, Facilities, Legal, and Communications teams to assemble policies and procedures. Continuing to protect the safety of those on-site, and ultimately returning our administrative employees back to our facilities, is informed by 4 core principles: safety, agility, unity, and business continuity. Multiple measures were implemented—including testing and contact tracing procedures, masking and personal protective equipment (PPE) requirements, occupancy limits, increased cleaning, on-site vaccination events (see sidebar), social distancing, and other mitigation efforts—to help us navigate the pandemic. As a result of our combined efforts, we have been able to keep workplace transmission low. As part of our efforts, we provided all colleagues with a digital “playbook” that clearly communicates our framework and procedures for working together safely. The playbook stresses that it is incumbent upon all of us to adhere to these guidelines to keep one another safe and healthy on-site and in our homes. These efforts have allowed Quest to maintain and expand services when our communities needed us most. Returning to working safely on-site The health and safety of our workforce has been our top priority while navigating the COVID-19 pandemic. We closely monitored pandemic trends and current CDC guidance. Fortunately, we were able to plan for and determine a safe, phased, and flexible return-to-office process that began mid-March 2022. “ When the COVID-19 pandemic began to roar across our country, we all had to reimagine nearly every aspect of our lives, including how we work and collaborate while continuing to fulfill the needs of our patients, customers, and communities. Safety is, and always has been, our primary concern.” Steven E. Goldberg, MD Vice President, Medical Affairs and Population Health Quest took multiple steps to make COVID-19 vaccinations available to all Quest colleagues: • Albertsons’ vaccination events: Wood Dale, IL; Houston and Lewisville, TX; Baltimore, MD; as well as private appointments across the country • Local partnerships: RANN Pharmacy near our Horsham lab and Collegeville PD offices; Managed Health Solutions at our Atlanta, GA lab; the Denver Department of Health at our Denver, CO facility; and mPathy in Marlborough, MA • Vaccination clinics: St. Louis, MO; Pittsburgh, PA; and Lenexa, KS labs, by our own Employer Population Health division TABLE OF CONTENTS 2021 OVERVIEW COVID-19 RESPONSE PROMOTING A HEALTHIER WORLD CREATING AN INSPIRING WORKPLACE BUILDING VALUE REFERENCES
2021 CORPORATE RESPONSIBILITY REPORT I 45 EMPLOYEE WELL-BEING New tests yield actionable insights “ With the knowledge from pharmacogenomics, we were able to get my medication therapy to a very good point, without the negative side effects. It’s made a big difference for me, my lifestyle, and how I feel on a daily basis.” Sara Brown Director, Commercial Operations Employer Population Health Tailoring treatment to the individual Quest collaborated with Coriell Life Sciences to offer select medical plan members pharmacogenomics testing services indicating how specific genes and their variations impact a person’s response to medications. This testing provides actionable clinical recommendations and medication management plans specific to and customized for each patient. This voluntary no-cost DNA testing program analyzes an individual’s DNA via an at-home saliva collection kit that is tested by Quest. Test results are analyzed to assess whether the patient’s current medications are most effective for that individual. Employees receive a thorough report, outlining the results and providing recommendations that they can discuss with their doctors. The results can improve medication effectiveness and safety, reduce adverse effects, and help find the right medication and dosage. An employee ’s story Sara Brown, Director, Commercial Operations, Employer Population Health, found that she was experiencing increasing flare-ups while taking several prescriptions for her rheumatoid arthritis. She sent in a sample of her DNA to have it analyzed and then worked with her physician and pharmacist to adjust her medication plan based on the results of the pharmacogenomic testing results. TABLE OF CONTENTS 2021 OVERVIEW COVID-19 RESPONSE PROMOTING A HEALTHIER WORLD CREATING AN INSPIRING WORKPLACE BUILDING VALUE REFERENCES Quest employees are among the first to benefit from newly developed testing. COVID-19 testing for Quest employees Quest offered COVID-19 serology testing to all employees as a no-cost, voluntary option. We offered both spike protein and nucleocapsid antibody testing (ie, testing to detect antibodies to specific virus spike proteins and to the nucleocapsid protein of the COVID-19 virus) as part of this innovative program as we were learning more about the virus and best practices for mitigating infection and transmission. Approximately 80% of Quest Blueprint for Wellness participants opted in for testing. Serology tests detect antibodies made when an individual has been infected with the virus that causes COVID-19 or vaccinated. Serology testing indicates whether an individual has previously been infected, but does not determine whether one is actively infected with or has recovered from the virus. Serology testing is appropriate for individuals who are asymptomatic to determine whether they have been infected. Those who elect to participate should continue to adhere to safety guidelines, regardless of result. COVID-19 antibody testing is free for all Quest employees through our special Employee Testing Program. This is regardless of whether employees are on the Quest medical plan.
2021 CORPORATE RESPONSIBILITY REPORT I 46 Welcoming our Director, Inclusion and Diversity Desyra Highsmith Holcomb recently joined Quest as Director, Inclusion and Diversity (I&D). This central New Jersey native and Rutgers graduate came to us from RWJBarnabas Health, where she was Director of Diversity and Inclusion, HR Strategic Initiatives. Core to Desyra’s role is working with Quest leaders to establish and implement I&D priorities and goals throughout the business. She leads the ongoing development and implementation of our inclusion and diversity strategies that are critical to our business, in partnership with executive, business, regional, and Human Resources leadership. Desyra serves as a leader in the development of effective strategies, practices, and policies to facilitate a more inclusive environment that benefits our business, colleagues, communities, and all additional stakeholders. In addition, she acts as an advisor to the Quest Inclusion and Diversity Council (QIDC). Fostering our culture At Quest Diagnostics, I&D is woven into who we are and what we do. We consistently invite new perspectives and embrace new experiences, which helps us to create an inclusive and empathetic workplace where our employees feel like they belong. In 2020, we developed our CTC framework to help formalize our approach to I&D across the entire talent lifecycle. We continue to leverage and renew our focus on the CTC model to further strengthen Quest’s culture of trust, collaboration, and belonging at all levels. Creating community Our 2021 score of 100 on the Human Rights Campaign Foundation’s 2021 Corporate Equality Index—our fifth consecutive year earning the highest possible score— reflects that Quest fosters a safe and supportive workplace for all employees regardless of identity. Core to our approach of nurturing an inclusive and diverse workplace is our commitment to Everyday Equity, a strategy that embodies our commitment to instill equity practices in everything we do at Quest Diagnostics. Among our key initiatives in 2021, we introduced company-wide trainings on how to recognize and overcome unconscious bias and develop stronger allyship behaviors across the organization, empowering employees to speak up for others and practice inclusive behaviors. INCLUSION & DIVERSITY Bringing our whole selves to work “Every day, we weave an I&D perspective into what we do and not as an afterthought. We consider I&D in how we develop and deliver services, interact on teams, and recognize contributions—and the list goes on. I&D means so much more than race. It's about creating an environment where every single person feels like they are considered, valued, and welcomed. We're all included in that journey.” Desyra Highsmith Holcomb Director, Inclusion and Diversity Culture What leaders say and do, the stories we share, and the principles we live by Talent How we identify, hire, develop, and listen to top diverse talent Communities How we incorporate diverse insights for the benefit of our clients and communities TABLE OF CONTENTS 2021 OVERVIEW COVID-19 RESPONSE PROMOTING A HEALTHIER WORLD CREATING AN INSPIRING WORKPLACE BUILDING VALUE REFERENCES
2021 CORPORATE RESPONSIBILITY REPORT I 47 INCLUSION & DIVERSITY Our I&D learning journey Employees responded favorably in 2020 to opportunities to talk about how racism and other biases continue to impact our society, leading to the introduction of a new training series in 2021. Introduced by Executive Director and Human Resources Business Partner Ebony David, the series is meant to deepen awareness of implicit and unconscious bias in our work and interpersonal relationships. The first module was designed to develop a common understanding of diversity, equity, and inclusion among all employees, encourage self-reflection, and initiate meaningful conversations about how I&D shows up at Quest. Module 2 spotlighted how understanding and addressing unconscious bias is crucial for supporting a collaborative work environment, building strong relationships, and breaking down barriers and stigmas. This module included a welcome message from 2 of our Employee Business Network leaders, Koko Adeniran, past co-chair of African-American Business Leaders EBN, and Madhuri Korimilli, co-chair of Pan-Asian Leaders EBN. The third module in the series aimed to unpack what allyship means at Quest, providing real-life scenarios to empower our employees to feel comfortable speaking up for others and practicing inclusive behaviors. This module also featured a personal welcome message from CEO-elect Jim Davis reflecting on how allyship has impacted his professional and personal life. “ These trainings were awesome! They reminded me not only to be professional, but also to be an ally and speak up when the opportunity arises. ” “ These I&D trainings continue to push me to become a better human being and colleague at Quest. ” We released additional resources for leaders to get conversations started within their teams around these topics and offered these modules in Spanish to reach our Quest colleagues in Puerto Rico and Mexico. These trainings are helping to continue to embed I&D as a critical part of our company culture. Continuing “The Conversation” In 2020, we engaged with our leaders on how to address racism, biases, and inequities. Part of our approach included “The Conversation,” a 2-hour virtual training for senior leaders, and “Real Talk” for Human Resources leaders. These trainings help improve understanding of how racism and privilege may appear at work, align leadership actions to support a culture of inclusion, and empower leaders to communicate their authentic view of the importance of I&D at Quest. In 2021, Quest leaders participated in these critical trainings, including ~300 in “The Conversation” and ~80 in “Real Talk.” The trainings concluded with a call to action outlining several recommendations to keep Quest leaders accountable for continuing this work, stressing that “accountability is the only way to achieve sustainability.” TABLE OF CONTENTS 2021 OVERVIEW COVID-19 RESPONSE PROMOTING A HEALTHIER WORLD CREATING AN INSPIRING WORKPLACE BUILDING VALUE REFERENCES
2021 CORPORATE RESPONSIBILITY REPORT I 48 INCLUSION & DIVERSITY Inclusion and Diversity Council inspires new and ongoing initiatives Founded in 2021, the Quest Inclusion and Diversity Council (QIDC) is critical in informing and driving our I&D strategy. The QIDC is comprised of 18 diverse senior leaders from across the business, which helps to ensure alignment and integration between our I&D strategy and overall Quest strategic priorities. The QIDC is responsible for sponsoring proactive and impactful I&D initiatives, providing perspectives on social issues, identifying new opportunities to enhance Quest’s current I&D programming, and communicating our progress and priorities out to the rest of the organization. “Integrating different perspectives from employees with different backgrounds, experiences, talents, and capabilities is a key business imperative,” explains “People genuinely want to understand. It’s a journey and it’s an important journey, but it won’t be immediate. You have my personal commitment to have these types of forums on a more frequent basis to help move the conversation forward.” Karthik Kuppasamy, PhD Vice President and General Manager, Northeast Region, and Co-chair of the QIDC, speaking before an African-American Business Leaders EBN Forum Cathy Doherty, Senior Vice President, Regional Businesses, Regional Businesses, and co-chair of the QIDC. “Diversity enables us to gain critical insights into problem-solving, enhance creativity and innovation, extend market outreach, minimize turnover, strengthen leadership and teamwork, and enhance regulatory compliance. Diversity is what gives us strength at Quest.” Celebrating a culture of inclusion The addition of Diversity Day to our annual paid holiday calendar is an important milestone on our I&D journey. Employees are empowered to take their Diversity Day on a date that is meaningful to them, in addition to holidays already observed by Quest. Approximately 18,000 Quest employees took advantage of Diversity Day in 2021. Quest supports gender parity Since 2015, Quest Diagnostics has been a proud founding member of the Healthcare Business Women’s Association Gender Parity Collaborative, a group of healthcare and life sciences companies dedicated to developing and committing to action to promote women in the workplace and accelerate gender compensation parity. “Inclusion inspires innovation, a key company value at Quest Diagnostics," says Cecilia K. McKenney, Senior Vice President and Chief Human Resources Officer. “The Collaborative provides a great laboratory for ideas to germinate and be exchanged to accelerate gender parity in all the member companies.” TABLE OF CONTENTS 2021 OVERVIEW COVID-19 RESPONSE PROMOTING A HEALTHIER WORLD CREATING AN INSPIRING WORKPLACE BUILDING VALUE REFERENCES
2021 CORPORATE RESPONSIBILITY REPORT I 49 INCLUSION & DIVERSITY Inclusion in action: Clifton and West Hills labs Grace Dominguez’s departmental mural celebrating inclusion and diversity at Quest’s West Hills, CA Lab West Hills lab creates a tapestry of welcome Colleagues at Quest Diagnostics in West Hills, CA also developed initiatives based on their unique perspectives to celebrate one another’s diversity of cultures and ideas. Each employee customized artistic handprints to represent themselves and their lives, helping colleagues get to know one another on a more personal level. Of 120 employees on-site, 100 have participated—with new employees continuing to contribute. The West Hills Specimen Management department proudly displays a mural entitled, “Diversity: Accomplishment has no color.” The mural shows a world map with photos of employees’ faces posted on their countries of origin, as well as characters around the map wearing traditional cultural attire. “ There’s always common ground... We all strive to feel needed, wanted, and welcomed... When I was presented with this opportunity to celebrate inclusion and diversity, I accepted the challenge...to show respect and celebrate all my coworkers.” Grace Dominguez Specimen Processing Trainer The display of flags at the Clifton lab celebrates the diversity of experience and heritage among Quest ’ s employees “ The flags represent the diversity we have in the East Region and the important commitment we have made to building an inclusive environment for everyone.” Miguel A. Aldana Director, Lab Operations, East Region Quest proudly fosters an inclusive workplace where all of our colleagues feel supported to bring their whole selves to work. Leaders and employees at many of our lab facilities have worked together to develop initiatives to celebrate inclusion and diversity through sharing their diverse backgrounds, nationalities, traditions, and observances. Following are some examples of how personnel in our labs—one in New Jersey and another across the country in California—created initiatives together, showing inclusion in action. Quest’s newest lab reflects many cultures and heritages Our new 250,000-square-foot flagship lab in Clifton, NJ, one of the largest globally, is equipped with a mother’s room, nondenominational prayer room, and all-gendered bathrooms. On a suggestion by VP Santiago Galvez, Clifton employees rallied to make the space their own with a display of national flags depicting the 20+ countries represented by the colleagues who work on-site. TABLE OF CONTENTS 2021 OVERVIEW COVID-19 RESPONSE PROMOTING A HEALTHIER WORLD CREATING AN INSPIRING WORKPLACE BUILDING VALUE REFERENCES
2021 CORPORATE RESPONSIBILITY REPORT I 50 Pride EBN celebrated 20 years of programming, advocacy, and education. As the first of our EBNs, Pride has provided a model for other groups and has contributed incalculably to openness and inclusion at Quest. This year’s activities included raising $20,000 for The Trevor Project. Caregivers EBN was re-established to provide a support system, access to information, and impactful webinars featuring guest speakers like Elizabeth Miller, founder of Happy Healthy Caregiver. Pan-Asian Leaders EBN (PAL) was welcomed in early 2021, established with the goals of providing development opportunities, breaking down harmful cultural stereotypes, and educating our organization on impactful allyship. African-American Business Leaders EBN (ABL) helped to facilitate dialogue around race through their Thrive Newsletter. Their “Silver Lining Edition,” released in May, focused on Quest’s fully realized commitment to I&D. DiverseAbilities EBN continued to strengthen their Mental Health Awareness subteam and partnered with other EBNs on joint programs to expand mental health awareness. Plans are underway for the launch of a Cancer Awareness Connection subteam in 2022. INCLUSION & DIVERSITY Employee Business Networks reflect and drive Quest values Our Employee Business Networks (EBNs) are integral to how we develop, celebrate, and uplift our diverse colleagues here at Quest Diagnostics. Our EBNs are company-sponsored, employee-driven networks open to all employees; they serve as a platform to participate in networking, advocacy, leadership and skills development, and community engagement. Our first EBN reached a milestone 20th anniversary, and the establishment of 2 additional groups in 2021 brings the number of EBNs to 10. Caregivers Em ployee Busi ness N etwo rk Hispanic/Latino EBN (HLEBN) offered a variety of programs and activities, including a celebration of National Hispanic Heritage month in September/ October. QuestCAN EBN provided opportunities throughout the year for all Quest employees to lend their time and talents in our local communities. Veterans EBN produced a Veterans Day video of Quest veterans sharing their perspectives on the value of serving their country, and continued to create discussion, referral, and support opportunities for veterans and their families. Women in Leadership EBN (WIL) held their annual membership conference and sponsored mentoring, health and wellness programs, and charity drives. Young Professionals EBN, or YoPro, continued to sponsor activities, including a virtual leadership development conference. TABLE OF CONTENTS 2021 OVERVIEW COVID-19 RESPONSE PROMOTING A HEALTHIER WORLD CREATING AN INSPIRING WORKPLACE BUILDING VALUE REFERENCES
2021 CORPORATE RESPONSIBILITY REPORT I 51 At Quest, we believe building upon the talent of our employees on their learning and development journey is crucial to creating an inspiring and engaging workplace. Our goal is to address the learning needs of employees at different stages in their careers at Quest, while supporting our company’s vision, values, and business imperatives. We do this by: • Delivering development opportunities that enhance knowledge, develop skills, and enrich the organization. These include instructor-led programs, bootcamps, learning content, webinars, and articles. • Creating, promoting, and fostering an organizational culture that values development, diversity, and growth opportunities for all employees. • Providing each individual employee and the organization with tools to respond effectively to customer needs as well as current and future demands for service. With increased online learning content, launch of our mobile app, new leadership development programs, and new enterprise-wide I&D trainings and people-leader modules, our training activities dramatically increased in 2021. 24 training hours per employee, on average 1 , 147 , 200 total training hours enterprise-wide New features EMPower employee development Our learning management system, EMPower, is one of the critical tools our employees use to access opportunities to learn and grow at Quest. New features were added this year. Playlists Each of these short, easy-to-absorb curations of videos in EMPower addresses a single theme, such as critical thinking or communication, and is designed to bring learning content directly to our employees and leaders to help them boost their skills and personal development. To date, there are about 70 active playlists available in EMPower with over 2,800 Quest employee followers. Learning channels We established learning channels in EMPower to help employees quickly and easily access impactful learning content. Each channel contains carefully curated content that is easy to engage with and share. In 2021, we released a communication channel and a personal effectiveness channel, with new channels being released every quarter. EMPower Learn mobile app We put learning directly into the hands of our frontline employees by introducing the EMPower Learn mobile app to provide easier access to our learning content. New in 2021, this app offers the option to take trainings on mobile devices, giving employees the opportunity to tailor their learning experience to their preferred learning medium. The new app attracted 1,629 users in only a few weeks. LEARNING & DEVELOPMENT Our holistic approach to learning and development “Growing the capabilities of our workforce is critical to our success. Employees have access to relevant learning content in a variety of formats, including a new mobile app. To develop leadership, we’ve re-launched our frontline leader program, LQSM Core, targeting communication, coaching, customer focus, emotional intelligence, QMS, and many other skills essential for us to perform at our best.” Bradford C. Lerman, PsyD Senior Director, Learning and Leadership Development TABLE OF CONTENTS 2021 OVERVIEW COVID-19 RESPONSE PROMOTING A HEALTHIER WORLD CREATING AN INSPIRING WORKPLACE BUILDING VALUE REFERENCES
2021 CORPORATE RESPONSIBILITY REPORT I 52 Quest Diagnostics is dedicated to providing accessible and robust learning opportunities for our frontline people leaders, as well as supporting all employees in pursuing higher education and advanced certifications. Leadership development To better equip our leaders with the skills they need to inspire, motivate, and succeed, we launched LQSMCore, a year-long leadership development experience for supervisors and managers, focused on communication, coaching, developing others, inclusion, and change leadership. 433 leaders in 21 cohorts Manager essentials In mid-November 2021, we introduced a new 6-month curriculum for new supervisors and managers focusing on skills critical for first-time people leaders and effective navigation of Quest systems. Through EMPower, newly hired or promoted first-time people leaders engage in a curriculum that helps them to develop competencies within topics like diversity, equity and inclusion, recognition and engagement, performance management, finance and operational skills, and more. 209 supervisors and managers enrolled in the first 6 weeks LEARNING & DEVELOPMENT Investing in our people “ Being able to collaborate with leaders from various functional backgrounds has helped me to inspire innovation as a supervisor. LQSMCore provided me with a renewed sense of what it means to be a people leader at Quest Diagnostics. ” Asia Hill Supervisor, Lean Supply LQSMCore participant Education assistance Quest Diagnostics Education Assistance Program provides opportunities for employees to pursue college-level education and professional certifications to enhance their skills and further their professional and career development. Through the program, full-time employees may be reimbursed 100% for eligible tuition expenses up to the annual reimbursement limit of $5,250. $3.5 M for tuition reimbursement Pathology Leadership Program In 2020, we introduced our Pathology Leadership Program, a 6- to 8-week program created to equip our pathologists with the leadership skills necessary to develop themselves and others. In 2021, 25 additional pathologists graduated from this program, with some graduates subsequently being promoted into new leadership roles. Quest Leadership Assessment With the goal of providing insight and action planning on leadership competencies, skills, and attributes, we introduced an assessment program for supervisors through senior managers. In 2021, almost 2200 Quest leaders participated in the QLA. TABLE OF CONTENTS 2021 OVERVIEW COVID-19 RESPONSE PROMOTING A HEALTHIER WORLD CREATING AN INSPIRING WORKPLACE BUILDING VALUE REFERENCES
2021 CORPORATE RESPONSIBILITY REPORT I 53 EMPLOYEE ENGAGEMENT & RECOGNITION Employees are sharing, and we’re listening We continue to enhance our strategy for gathering employee feedback by making it easier and more convenient for employees to respond to surveys, increasing the percentage of employees who provide complete responses, and focusing on timely subject areas that are meaningful to employees. Rather than sending lengthy annual questionnaires, Quest now periodically sends shorter “pulse” surveys throughout the year addressing specific themes. This enables “continuous listening” to capture employee input. Establishing an action plan based on such feedback helps to: • Build a proactive, agile culture of real-time, ongoing, meaningful feedback • Drive ongoing conversations about performance, priorities, opportunities, and growth • Achieve a consistently high-performing organization, committed employees, and a sense of well-being and belonging among all those in the organization Empowering managers We’ve also shifted the focus of the surveys: managers are now responsible for owning the data, having productive conversations with employees regarding the results, and coordinating action planning. Quest encourages managers to use the ACT framework to Acknowledge where employees are; Collaborate on where the team wants to go; and Take 1 step forward, identifying 1 change to focus on in coming weeks, and setting a progress check-in date. Our revamped Employee Insights Survey is administered by Glint. We work with Glint to ensure that the questions we pose to employees are scientifically based, tested, and validated. We also link the insights captured and results tracked via the surveys to important outcomes, including performance, productivity, employee turnover, and customer experience. Glint’s People Science team helps us measure against similar companies in our industry using healthcare benchmarks, which include companies from the healthcare sector as well as curated industry panels, where the statistical power represents ~50M survey participants. A manager's guide to the survey provides helpful tips for using the survey data most effectively, such as, having short, regular conversations with their teams about implementing positive changes. Quest managers agree that obtaining real-time and continuous employee feedback enables Quest to adapt questions, reflect major challenges and concerns, and assess employees’ evolving needs. Our new survey approaches and strategies continue to be well-received by employees, with many expressing that the surveys show Quest’s genuine interest in obtaining honest employee feedback and taking positive, constructive action. Month Topic Responses January Employee support and well-being 25,419 June Ethics, compliance, and belonging 26,816 October Authenticity, acceptance, and equal opportunity; manager trust tied to inclusion and equity 27,838 Let your voice be heard. March 15–29, 2022 TABLE OF CONTENTS 2021 OVERVIEW COVID-19 RESPONSE PROMOTING A HEALTHIER WORLD CREATING AN INSPIRING WORKPLACE BUILDING VALUE REFERENCES
2021 CORPORATE RESPONSIBILITY REPORT I 54 EMPLOYEE ENGAGEMENT & RECOGNITION Supporting and recognizing all Quest employees The 2021 “High 5” initiative To recognize Quest employees’ extraordinary commitment to empowering better health for the patients, customers, and communities we serve, Steve Rusckowski, Quest’s Chairman, CEO, and President, announced the 2021 “High 5” initiative: “While I can’t give you a real ‘High 5,’ I’ll do the next best thing: share 5 significant actions we’re taking to support and recognize you as we approach the end of the year.” 1) Pandemic Response Payment This nontaxable payment was provided for employees at the Director level and below— including ~47,500 colleagues—to offset elevated expenses incurred during the COVID-19 pandemic. The payments were $500 for full-time employees and $250 for part-time and per diem colleagues as well as most new hires who joined Quest after October 1. The Pandemic Response Payments, totaling over $20M, were made in December. 2) Paid Time Off (PTO) payout Everyone needs time off to recharge, but that has been a particular challenge during the pandemic. This payout in February 2022 ensured that colleagues did not lose any earned PTO due to an inability to take PTO in 2021. to thank our 30,000 dedicated lab professionals for their invaluable contributions and their unflagging commitment to putting patients first. We always regard our lab employees as true, everyday heroes—but even more so now that they have been at the heart of Quest's COVID-19 response. “Lab professionals have been front-line heroes throughout the pandemic,” said Doug Hamilton, Executive Director of National Laboratory Operations, Quest Diagnostics. “The lab teams have demonstrated tremendous flexibility and agility by shifting to help and assist wherever needed.” Quest facilities across the nation planned celebrations to show their appreciation for lab professionals’ critical contributions every day. Activities included grab-and-go lunches, recognition cards, and a focus on showcasing the professional journey of some of these special colleagues. 3) $15/hour minimum pay Ensuring that everyone at Quest is paid at or above $15 per hour base pay is the right thing to do and makes us more competitive. Effective as of November 7, 2021, Quest increased the hourly rate for the small number of employees who were below $15/hour. 4) Annual Incentive Plan (AIP) payout Thanks to all Quest employees, 2021 proved to be another year of strong financial performance. Quest recognized employee performance through our annual bonus program—which is a program that many competitors either do not offer or canceled due to financial challenges. The AIP was paid to employees in March 2022. 5) Employee gift All employees received Quest-branded gear delivered right to their doors as a special thank-you to help ring in 2022. Celebrating Quest’s front-line workers in the age of COVID-19 Every year, there is a week-long celebration of lab employees, including laboratory professionals and pathologists, for their incredible work all year. National Medical Laboratory Professionals Week took place in April, giving us the opportunity TABLE OF CONTENTS 2021 OVERVIEW COVID-19 RESPONSE PROMOTING A HEALTHIER WORLD CREATING AN INSPIRING WORKPLACE BUILDING VALUE REFERENCES
2021 CORPORATE RESPONSIBILITY REPORT I 55 EMPLOYEE ENGAGEMENT & RECOGNITION RecognitionQuest: a culture of appreciation, celebration, and rewards Ensuring a sense of belonging and connection in the workplace requires fostering a culture that includes both recognition and appreciation—as we do with our recognition programs. Recognition Quest RecognitionQuest, an internal platform, enables us to maintain a culture where all Quest colleagues can regularly Appreciate, Celebrate, and Reward one another by: • Openly valuing positive everyday actions and spotlighting “above and beyond” contributions • Enabling employees to think more broadly about recognition and about who they can recognize and how, including peer-to-peer Through RecognitionQuest, employees post messages and award recognition points to their colleagues, which can then be redeemed for meaningful prizes in a reward catalog, including merchandise or gift cards, or donated to our Employee Relief Fund or another nonprofit of choice. RecognitionQuest also provides colleagues with a simple, effective way to congratulate their colleagues on significant milestones, such as creating service anniversary and custom celebration eCards for promotions, certifications, retirements, new hires, and other special occasions. Small Gestures Big Impact Small Gestures Big Impact (SGBI) is a RecognitionQuest program that allows employees to show appreciation for colleagues' efforts in a way that values and recognizes everyone’s contributions toward fulfilling our goals. SGBI also allows us to differentiate between recognition and appreciation. The former focuses on an individual’s past performance, commends what they did and how they achieved their results, and is most impactful when it comes from the top. In contrast, appreciation acknowledges an individual’s inherent value as a human being and puts the spotlight on an individual versus a business. Research shows that employees who feel valued, cared about, and appreciated obtain several benefits, including significantly increased productivity, decreased stress, and increased collaboration. Bottom line: organizations that understand the difference between recognition and appreciation experience higher performance and enhanced employee well-being. 1 In 2021, Quest provided SGBI program trainings to a core team of leaders and then established 19 Champion teams in a “train the trainer” approach. Champion team members went on to train and roll out the SGBI program and its principles to more than 2,100 Quest leaders from January to April 2021. Quest colleagues now show their appreciation for employee excellence in the following categories: • Collaboration • Caught in the act (of excellence) • Leadership • Celebrate • Innovation In celebration of all our employees and their contributions to making Quest a wonderful place to work: 25,346 employees recognized their colleagues 45,426 received at least 1 recognition from their colleagues 90,008 acknowledged or “boosted” recognitions by other colleagues TABLE OF CONTENTS 2021 OVERVIEW COVID-19 RESPONSE PROMOTING A HEALTHIER WORLD CREATING AN INSPIRING WORKPLACE BUILDING VALUE REFERENCES
2021 CORPORATE RESPONSIBILITY REPORT I 56 EMPLOYEE ENGAGEMENT & RECOGNITION Accolades awarded to our colleagues In 2021, our Quest colleagues received multiple honors recognizing their critical work. This included distinguished awards to forensic toxicologist Dr Barry Sample and pathologist Dr Kari Hooper. Barry Sample, PhD, Employer Solutions Senior Director of Science and Technology, received the National Drug and Alcohol Screening Association (NDASA) Lifetime Achievement Award. The award was presented in St. Louis during the NDASA Annual Conference in May 2021, with Quest as a major sponsor. The Lifetime Achievement Award celebrates Barry's dedication to promoting public safety and drug-free workplaces and communities through education and excellence in drug screening services. Officially retired as of January 2022, Barry will continue as Senior Science Consultant for Employer Solutions. A board-certified forensic toxicologist, Barry worked for Quest Diagnostics for more than 30 years, starting in 1991 as laboratory director. Under his direction, the Atlanta laboratory, which was accredited by the International Olympic Committee, provided the doping control services for the 1996 Centennial Olympic Games. In 2000, Barry transitioned to leading science and technology initiatives where he was responsible for new testing, informatics, and technology development, and the Quest Diagnostics Drug Testing Index. Barry is a regional commissioner and an inspector for the College of American Pathologists Forensic Drug Testing laboratory accreditation program, and serves as a member of the Department of Health and Human Services Drug Testing Advisory Board. He is a lecturer and has co-authored numerous presentations and publications addressing drug analysis, athletic drug testing, and toxicology. Kari Hooper, MD, Director of Hematopathology at AmeriPath, was named Woman of the Year by the Leukemia and Lymphoma Society (LLS) of Oklahoma. LLS is a global leader, funding life-saving blood cancer research across the world, and providing free information and supportive resources. Kari was nominated by her colleague, Oncology Genomic Account Executive Christina Lohmeyer. With Christina as team captain, Kari and her teammates together raised more than $62,000 for LLS. “I looked into their mission, and I was all in,” Kari explained. "Not only do they give money toward advancing research, but they know it's important to support patients at a micro, local level. When they called my name, I couldn't help but feel proud for my whole team." "On a personal level,” she added, “I spend much of my time at work diagnosing blood cancers, but I don't often meet the patients affected by these diagnoses. I saw this fundraising effort as a tangible way I could contribute to their path back to health.” Barry Sample, PhD Kari Hooper, MD TABLE OF CONTENTS 2021 OVERVIEW COVID-19 RESPONSE PROMOTING A HEALTHIER WORLD CREATING AN INSPIRING WORKPLACE BUILDING VALUE REFERENCES
2021 CORPORATE RESPONSIBILITY REPORT I 57 As a leading provider of diagnostic information services, we are a crucial part of the healthcare ecosystem. With many, if not most, healthcare decisions informed by diagnostic testing, physicians and patients rely on our services in order to make better healthcare decisions. We continue to develop data-driven strategies and programs to increase quality, affordability, and access to our services while building long-term, sustainable value for all our stakeholders. We continue to increase our capacity, while reducing our environmental footprint, from our new, state-of-the-art laboratory in Clifton, NJ to our logistics and operations. In support of our employees and communities, we provide resources for nonprofit organizations through corporate giving, strategic collaborations, and sharing our expertise through volunteerism. We are committed to strong, ethical governance with oversight from a diverse Board of Directors. To learn more about our governance programs, please refer to our 2022 Proxy Statement in the Investor Relations section of our website at QuestDiagnostics.com. Building value Goal 3 • Promoting a healthier world • Creating an inspiring workplace • Building value TABLE OF CONTENTS 2021 OVERVIEW COVID-19 RESPONSE PROMOTING A HEALTHIER WORLD CREATING AN INSPIRING WORKPLACE BUILDING VALUE REFERENCES
2021 CORPORATE RESPONSIBILITY REPORT I 58 In January, Quest Diagnostics began testing and, in July, completed integration of our northeast regional operations into a 250,000–square- foot next-generation lab facility in Clifton, NJ. The Clifton laboratory is now one of the largest medical laboratories globally. • Featuring extensive automation to perform 300,000+ diagnostic tests per day with exceptional accuracy, quality, and efficiency • Serving more than 40 million people per year in 7 states across the Northeast • Offering increased productivity, higher medical quality, and larger capacity to meet current and future regional demands • Conforming to Quest’s Sustainability Policy to reduce environmental impact • Seeking LEED (Leadership in Energy and Environmental Design) -equivalent certification— a prestigious rating system for healthy, highly efficient, and cost-saving green buildings— expected to be granted in 2022. EXPANDING CAPACITY State-of-the-art lab opens in Clifton, NJ In addition to faster, high-quality test processing, this unique facility represents a more than $250- million commitment to its customers and community, providing more than 1,000 jobs and serving as an economic stimulus for New Jersey. In an automated setting, these jobs offer employees skill-building opportunities and the ability to laser-focus on high-value work providing diagnostic insights. “COVID-19 clearly demonstrated the need for accurate diagnostic testing, and this lab is testament to the fact that Quest has heard that call and answered. This is truly a first-class facility.” Phil Murphy Governor, State of New Jersey TABLE OF CONTENTS 2021 OVERVIEW COVID-19 RESPONSE PROMOTING A HEALTHIER WORLD CREATING AN INSPIRING WORKPLACE BUILDING VALUE REFERENCES
2021 CORPORATE RESPONSIBILITY REPORT I 59 State-of-the-art lab opens in Clifton, NJ (continued) Designing a fit-to-purpose, employee- centric new regional headquarters and leaving the East Region's previous home of Teterboro was not an easy venture, particularly during a global pandemic, with a worldwide shortage of materials and resources. The design for the facility fosters a culture of innovation through collaboration, with seamless indoor/ outdoor connectivity, light-filled workstations, generous mixed-use social spaces, and the oculus mezzanine, which offers an intimate view of lab operations without interrupting floor activity. With an eye toward future needs, the Clifton lab facility can expand to meet increased testing demand. “ Together, we overcame every obstacle and found solutions to every challenge. The countless contributions and diverse talents of our Clifton and East Region workforce over more than 2 years have made this new lab possible. ” Santiago Galvez Interim Vice President, Operations, East Region TABLE OF CONTENTS 2021 OVERVIEW COVID-19 RESPONSE PROMOTING A HEALTHIER WORLD CREATING AN INSPIRING WORKPLACE BUILDING VALUE REFERENCES
2021 CORPORATE RESPONSIBILITY REPORT I 60 EXPANDING CAPACITY Quest collaborations on the cutting edge We enter into collaborations to broaden access to key tools and insights that can improve outcomes for patients. These important relationships expand resources and access to innovative technologies. GRAIL Galleri ® multi-cancer early detection blood test By providing specimen collection assistance for this test, we are helping patients receive broader access to a unique solution with potentially life-saving implications, as early detection is crucial to optimize outcomes. Zora Bioscience Ceramide-analysis technology Using technology licensed from Zora, we will be developing a test service identifying risk in patients with stable coronary heart disease and acute coronary syndrome independent of LDL-cholesterol status. Patients at highest risk for CVD-related death will be able to work with their healthcare team on more aggressive preventive measures. Biocept Target Selector ™ Next-Generation Sequencing (NGS) Lung Panel Based on technologies from Biocept and ThermoFisher Scientific, this collaboration will provide access to this liquid biopsy test to more patients nationwide. The panel provides physicians with therapeutic options for patients with non–small cell lung cancer and enables Quest to provide crucial insights in tissue biopsy in a less invasive manner. Agilent Technologies Inc. Early breast cancer Ki-67 companion diagnostic As part of our long-standing precision medicine collaboration with organizations like Agilent, we added testing that identifies whether patients with early breast cancer have the Ki-67 protein in malignant tumor cells. The test helps confirm whether a patient with a specific “triple positive” breast cancer with high risk of recurrence may benefit from treatment with standard endocrine therapy plus abemaciclib, an immunotherapy checkpoint inhibitor offered by Eli Lilly and Company as Verzenio. It is the sole FDA-approved drug in this class for these patients. Working with Paige to improve cancer diagnosis with artificial intelligence In May, Quest announced a collaboration with Paige, a New York-based company with machine-learning expertise in pathology diagnostic data. Visual inspection of tumor tissue using a microscope to detect cancer can be revolutionized by artificial intelligence (AI)–enabled computational pathology. By identifying known patterns in tissue that characterize disease, as well as identifying new markers, AI-assisted digital pathology enables deeper examination and easier collaboration. The project combines Quest's leadership in pathology and national scale with Paige's leading AI-based software capabilities. In September, the FDA authorized the first use of Paige’s AI tools for assistance in diagnosing prostate cancer. Quest Diagnostics began using Paige Prostate in October. TABLE OF CONTENTS 2021 OVERVIEW COVID-19 RESPONSE PROMOTING A HEALTHIER WORLD CREATING AN INSPIRING WORKPLACE BUILDING VALUE REFERENCES
2021 CORPORATE RESPONSIBILITY REPORT I 61 CORPORATE GIVING & COMMUNITY ENGAGEMENT Wherever we are, Quest is part of the community Matching funds $ 475K ~ 800K donated or discounted test requisitions Employee volunteer hours 2 7 K+ Employee Relief Fund grants 300+ $ 1 5M + in corporate giving and Q4HE grants TABLE OF CONTENTS 2021 OVERVIEW COVID-19 RESPONSE PROMOTING A HEALTHIER WORLD CREATING AN INSPIRING WORKPLACE BUILDING VALUE REFERENCES The corporate giving program at Quest captures the passion and commitment of our employees, leadership, and business partners to make lasting, meaningful contributions in the communities where we live and operate. We believe that a strategic and targeted approach to giving enables us to focus our resources to support identified needs in the most effective and impactful way.
2021 CORPORATE RESPONSIBILITY REPORT I 62 Wherever we are, Quest is part of the community (continued) TABLE OF CONTENTS 2021 OVERVIEW COVID-19 RESPONSE PROMOTING A HEALTHIER WORLD CREATING AN INSPIRING WORKPLACE BUILDING VALUE REFERENCES Donated or discounted testing We are committed to providing clinical laboratory services regardless of patients’ ability to pay. Through our various patient assistance programs and Quest for Health Equity (Q4HE), we tailor solutions based on individual circumstances and may adjust some or all laboratory charges. In 2021, we provided ~800K donated or discounted test requisitions, at a cost of approximately $13M Matching gifts and volunteering The Quest Diagnostics matching gifts and volunteering programs are designed to support organizations with a primary focus on healthcare, health disparities, and social determinants of health; accredited educational institutions; and organizations that promote diversity, equity, and inclusion. Our program matches $1 for every $1 contributed by Quest employees to eligible organizations, up to $2,500 per employee per year. Contributed $475K in matching funds to 600+ nonprofits Volunteered more than 27K hours Employee Relief Fund At Quest Diagnostics, we take pride in our ability to support our employees during unforeseen circumstances. The Quest Diagnostics Employee Relief Fund serves as an opportunity for employees to support one another during financial hardships that result from federally declared emergencies, such as the COVID-19 pandemic and other natural disasters. Quest matches $1 for every $1 contributed to the Fund by Quest employees. More than 300 grants were approved in 2021, representing $268K in support for employees Community engagement Through local, national, and international partnerships, Quest offers employees several ways to participate in community engagement throughout the year. Some of the programs through which we give back include: Season of Giving campaign: In 2020, Quest introduced the Season of Giving campaign, which offered employees a double-match opportunity for donations made as part of the Giving Tuesday global movement. In 2021, the campaign expanded to feature nearly 30 volunteer opportunities through various nonprofit partnerships across each region. This campaign offered employees flexibility to give back in a way that is meaningful to them, from food, clothing, and toy drives to cash donations to nonprofits aligned with Quest's strategic giving. Supporting COVID-19 relief efforts in India: To support colleagues, their families, and the broader community in India during the COVID-19 surge, Quest partnered with Vibha, a US-based nonprofit organization with the mission to ensure that underprivileged children attain their right to health, education, and opportunity. Vibha established Ray of Light, an initiative focused on COVID-19 relief efforts in India to set up modular bed hospitals, procure oxygen concentrators, personal protective equipment (PPE), and establish vaccine clinics. Through Quest employee donations and corporate matching funds, more than $30,000 was donated to these relief efforts.
2021 CORPORATE RESPONSIBILITY REPORT I 63 CORPORATE GIVING AND COMMUNITY ENGAGEMENT Memberships, sponsorships, and affiliations Quest also collaborates with a large network of nonprofit organizations, professional associations, and civic and economic groups that share our commitment to educating, empowering, and strengthening diverse communities. These groups, along with many others, help us to engage authentically with customers and promote an inclusive workplace: • American Cancer Society • American College of Healthcare Executives • American Diabetes Association • American Heart Association • The Arnold P. Gold Foundation • Asian Pacific American Institute for Congressional Studies • California Clinical Lab Association • CEO Roundtable on Cancer • Chief Executives for Corporate Purpose • Choose Healthy Life • Commerce and Industry Association of NJ (CIANJ) • Community Solutions • Congressional Black Caucus Foundation • Congressional Hispanic Caucus Institute • Connecticut Health Council • Healthcare Businesswomen’s Association • Junior Achievement (JA) Worldwide • March of Dimes • Meadowlands Chamber of Commerce • National AIDS Memorial • National Association of Community Health Centers • National Colorectal Cancer Roundtable • National LGBT Chamber of Commerce • National Minority Quality Forum • New Jersey Health Care Quality Institute • Newark Regional Business Partnership • Partnership to End Addiction • Project Hope • The Trevor Project • Valley Industry Commerce Association Quest collaborates with additional organizations through our Q4HE initiatives. For more details, please see pages 31-35 . TABLE OF CONTENTS 2021 OVERVIEW COVID-19 RESPONSE PROMOTING A HEALTHIER WORLD CREATING AN INSPIRING WORKPLACE BUILDING VALUE REFERENCES
2021 CORPORATE RESPONSIBILITY REPORT I 64 STEWARDSHIP Environmental sustainability drives operational excellence The COVID-19 pandemic had a dramatic impact on our operations, including our testing mix, which affected our environmental metrics. As Quest transitions to the post-pandemic period, we anticipate that there will be additional impacts and we will remain focused on sustainability considerations. Key elements driving our environmental sustainability program • Pollution prevention: We will minimize waste in our operations through process improvements and focused recycling efforts • Energy efficiency, sourcing and use: We will include renewable energy in our sourcing of energy when cost-effective and feasible. We will use energy efficiently and make efforts to improve efficiency through technology and innovation • Fleet conservation: We will utilize technology to improve our ground fleet efficiency, thereby reducing carbon fuel use and associated greenhouse gas emissions (GHG) • Strategic sourcing: We will take environmental impact into consideration when making decisions about the materials and services we purchase in order to reduce consumption of natural resources and decrease waste and emissions Our Environment, Health, and Safety (EHS) department leads the development of our strategic environmental plans and GreenQuest, working closely with regional teams to identify opportunities for improvements and to lead local projects. We maintain programs to monitor the environmental impacts at our major laboratories and audit environmental management. We train key staff in environmental management, covering handling of chemicals, pathogens, and waste reduction, and include localized training in the specifics of each facility. We continue to pursue ISO 14001 and ISO 22301 certifications in 2022 for our San Juan Capistrano laboratory, and we are also pursuing LEED-equivalent certification for our new Clifton laboratory. Climate action In 2021, we started the process of analyzing climate risks and opportunities for our business based on the recommendations of the Task Force for Climate Related Financial Disclosures. We created teams to review our climate risks and opportunities, as well as our water use and waste. We also initiated efforts to improve measurement of our GHG emissions, with a focus on Scopes 1 and 2. Data in the following tables include estimates. US EIA’s Commercial Building Energy Consumption Surveys (CBECS) data and EPA’s Emissions & Generation Resource Integrated Database (eGrid) were used to estimate utility usage and related emissions factors for small locations when not available from other sources. These data cover 100% of our operations in North America and Latin America. Table 1: GHG Emissions (Metric tons CO2-e per 1M test requisitions) Measure 2021 a Scope 1 CO2e 1,095.9 Scope 2 CO2e 487.3 Scope 3 b 113,886.0 a ERM Certification and Verification Services (ERM CVS) conducted independent third-party assurance of year 2021 Scope 1 and 2 greenhouse gas emissions data. See the Independent Assurance Statement by ERM CVS here . b Scope 3 emissions include only Purchased Goods & Services, Fuel & Energy Related Activities, Upstream Transportation & Distribution, Waste Generated in Operations, Business Travel, and Employee Commuting. TABLE OF CONTENTS 2021 OVERVIEW COVID-19 RESPONSE PROMOTING A HEALTHIER WORLD CREATING AN INSPIRING WORKPLACE BUILDING VALUE REFERENCES
2021 CORPORATE RESPONSIBILITY REPORT I 65 Environmental s ustainability drives operational excellence (continued) Table 2: Scope 1 GHG Emissions Disaggregated (Metric Tons CO2-e) Measure 2021 Mobile Fuels 70,385 Facility Fuels 17,735 Refrigerants a 137,329 Process Emissions 6,974 Dry Ice 6,487 Total Scope 1 Emissions (Metric Tons CO2-e) 238,910 a Refrigerants were calculated for the largest facilities, primarily labs, using the GHG Protocol’s basic and advanced screening method. The screen covered 22% of Quest’s total footprint by square footage, and 38% of Quest’s lab square footage. Remaining refrigerant data were estimated based on the results of this screen. Emissions were based on IPCC, 2019 Refinement to the 2006 IPCC Guidelines for National Greenhouse Gas Inventories (2019), Volume 3: Industrial Processes and Product Use, Table 7.9. Table 3: Scope 2 GHG Emissions Disaggregated (Metric Tons CO2-e) 2021 Measure Location-based Market-based Purchased Electricity 103,421 105,129 Steam & Chilled Water 2,819 2,819 Total Scope 2 Emissions (Metric Tons CO2-e) 106,240 107,948 Table 4: Scope 3 GHG Emissions Disaggregated (Metric Tons CO2-e) Measure 2021 Purchased Goods & Services 21,217,938 Fuel & Energy Related Activities 61,424 Upstream Transportation & Distribution 3,393,762 Waste Generated in Operations 18,224 Business Travel 9,726 Employee Commuting 126,082 Total Scope 3 Emissions (Metric Tons CO2-e) 24,827,156 To date, our efforts to reduce our GHG emissions have included energy efficiency measures at our facilities, such as laboratory testing platform consolidations, LED lighting retrofits, purchase of green power, and route optimization, including the following key accomplishments in 2021: • Completed the consolidation of the majority of our East Region lab operations into our Clifton, NJ lab • LED lighting retrofits which we believe will reduce our overall electricity consumption by 59% in our Marlborough cytology lab • Reduction of 1.2M miles in driving through route optimization projects for our fleet, which we believe will result in reduction of 424 metric tons of CO2 emissions • Quest continues to qualify for the EPA’s Green Power Partnership by exceeding 7% renewable energy use. Fleet conservation is another key aspect of our efforts to reduce GHG emissions, which we estimate resulted in a reduction of 1.8 billion pounds of CO2 and the elimination of more than 1,100 surplus vehicles in the last 15 years. Electric vehicles We are considering electric vehicles for our fleet. In 2021, we began the development of an electric vehicle pilot project. At our lab in Clifton, NJ, we installed charging stations in the public area of the garage. We are building out charging infrastructure at out Marlborough, MA lab and plan to begin infrastructure design and construction at remaining pilot locations. A Gold Rating in India Our office facilities in India achieved a Gold Rating from the India Green Building Council, which encourages green concepts and techniques to address national priorities in India. The rating considers site and facility management, water efficiency, energy efficiency, health and comfort, and innovation. TABLE OF CONTENTS 2021 OVERVIEW COVID-19 RESPONSE PROMOTING A HEALTHIER WORLD CREATING AN INSPIRING WORKPLACE BUILDING VALUE REFERENCES
2021 CORPORATE RESPONSIBILITY REPORT I 66 • At the Las Vegas facility, a 310 linear-foot planter was removed to reduce water used to maintain plants, which we estimate will save 164,250 gallons of water • At Cleveland HeartLab, all toilets are now fitted with water-saving flushers • In the Dallas lab facility, all urinals were replaced with flushless units Occupational health and safety The Quest Diagnostics EHS team believes our critical business objectives include workplace safety; the health of our em ployees, contractors, and others working in our facilities; and the protection of the environment. We are committed to proactively managing workplace safety to eliminate risks and hazards as well as ensure regulatory compliance. In 2021, we invested in safety data management software which will allow us to improve performance, gain insight, and drive compliance. Our safety management system aligns with ISO 45001 and ANSI Z10 elements by: • Creating regional/business unit strategic plans that review current metrics, evaluate and develop EHS programs, identify opportunities to reduce workplace injuries, address trends, mitigate risks, generate action plans for identified risks and professional development of our EHS professionals • Periodically conducting internal audits at all facilities • Encouraging employee engagement in safety committees • Requiring employees to review and acknowledge job hazard analyses • Providing monthly job-specific safety training to employees through the company’s learning management system Waste reduction Quest works with suppliers to find products and processes that can minimize waste across our operations. In 2021, several of our facilities completed new waste management projects which we believe reduced hazardous waste or landfill waste, such as: • Our Las Vegas facility eliminated pH wastewater disposal, thus reducing hazardous waste generation by 285,000 lbs • At our West Hills, CA and Sacramento, CA labs, all paperwork was required to be recycled, reducing our future annual landfill waste by 210,000 lbs • Cleveland HeartLab ™ began recycling and reusing Styrofoam shipping containers • Specimen cup and stool container redesigns, among other changes, reduced Quest’s plastic waste by 105 tons in 2021, for a total of 407 tons saved since the project initiated in 2018 • Reduced the amount of paper waste in our PSCs by an additional 270 tons in 2021, for a total of 546 tons saved since the project initiated in 2018 Environmental s ustainability drives operational excellence (continued) Table 5: Waste by Type (Metric tons per 1M test requisitions) Measure 2021 General Waste 89.7 Biohazardous Waste 49.8 Chemical Waste 5.2 Recycling 45.8 Water reduction Our facilities continue to look for creative ways to reduce water consumption. Overall, in 2021, we reduced our water consumption by 16%. • In California, several of our logistics hubs transitioned to waterless fleet vehicle washing, which we estimate will save 32,490 gallons of water per year Table 6: Water Consumption (1,000 m3 ) per 1M test requisitions Measure 2021 Water Consumption 3.28 TABLE OF CONTENTS 2021 OVERVIEW COVID-19 RESPONSE PROMOTING A HEALTHIER WORLD CREATING AN INSPIRING WORKPLACE BUILDING VALUE REFERENCES
2021 CORPORATE RESPONSIBILITY REPORT I 67 Quest’s vision is to empower better health through diagnostic insights. Our ability to achieve that vision is dependent on one of our key values, integrity. We strive to operate ethically, honestly, and responsibly, in accordance with our Code of Ethics. Our commitment to ethical business conduct We are committed to adhering to all applicable laws and regulations in our work as a healthcare leader. We have a clear strategy to maintain a culture of compliance and integrity at Quest that engages all our employees and emphasizes the importance of ethical behavior through our policies, training, assessments, and reporting practices. Policies Quest’s Code of Ethics is critical to our success, empowering us with the roadmap we need to earn and maintain the trust of our patients, customers, shareholders, and colleagues. Our Code is not merely a set of rules—it defines our approach to making good decisions no matter what our role is and creates a shared sense of pride among all of us. Our Code and compliance policies apply to all employees, subsidiaries, vendors, contractors, suppliers, interns, business partners, and representatives who work on our behalf. We expect the best from ourselves and one another, including a commitment to Quest’s core values of leadership, integrity, quality, innovation, collaboration, and accountability. We expect one another to ask questions and take action if something isn’t right. Employees who have concerns are encouraged to share them with their manager; a representative from our Human Resources, Compliance, or Legal departments; or confidentially or anonymously through our hotline or online inquiry form. Training We look to our managers and supervisors to always promote our Code and model the right behaviors. This includes creating an open-door environment, making it clear that any form of retaliation is unacceptable when an employee raises concerns, ensuring employees are properly trained, and being fully present to offer guidance and support. All full-time, part-time, and contract employees are required to complete training upon hire as well as on an ongoing, annual basis. The training topics include compliance, fraud, and abuse; privacy; corruption; bribery; and our Code of Ethics. Select employees are also trained on compliance with the Foreign Corrupt Protection Act (FCPA). Our compliance training program is reviewed as part of our internal audit process, with select segments overseen by our Legal department. Risk assessment The best way to assess compliance risks—and the capacity to effectively address those risks—is to do so consistently and continuously throughout the year. We expect all employees to identify any compliance issues within their areas of responsibility. The company engages in an annual risk assessment specific to compliance, assessing and categorizing compliance risks regarding severity and the level of mitigation required. The Compliance Risk Assessment is conducted at the direction of counsel and is an element of the enterprise risk management (ERM) program. Integrity: a fundamental value TABLE OF CONTENTS 2021 OVERVIEW COVID-19 RESPONSE PROMOTING A HEALTHIER WORLD CREATING AN INSPIRING WORKPLACE BUILDING VALUE REFERENCES
2021 CORPORATE RESPONSIBILITY REPORT I 68 Integrity: a fundamental value (continued) Enterprise risk management begins with awareness We maintain an enterprise risk management (ERM) program overseen by our Board of Directors and driven by our C-suite executives that is designed to promote risk awareness throughout the company’s key business, operations, and support functions. Our program, which is integrated with the company’s governance, performance management, and internal control frameworks, entails a formal continuous process that identifies, assesses, mitigates, and manages the risks from both internal and external conditions that could significantly impact the company and influence its business strategy and performance. The program is based on the most recent framework issued by the Committee of Sponsoring Organizations of the Treadway Commission (COSO) and focuses on operational, financial, legal, compliance, and strategic risk. As part of the program, together with our Board of Directors, we routinely assess our enterprise-level risks, emerging risk factors, overall company-level risk tolerance, and the effectiveness of our risk management, as well as monitor the progress of and resources applied to risk mitigation. In addition, we continue to strengthen the alignment of our ERM program with our key environmental, social, and governance (ESG) areas of focus. Reporting process We routinely communicate with employees on how to confidentially report a violation of the Code and take all reports of violations extremely seriously. Reports are investigated by the Compliance, Human Resources, and/or Legal departments, as appropriate. If the investigation reveals a violation of a compliance policy, the Compliance department oversees any necessary corrective action including discipline up to and including termination. The corrective action taken is dictated by the type of issue involved, based on the circumstances and facts gathered during the investigative process, and consistent with written disciplinary guidelines. Our Senior Vice President of Compliance provides oversight on the program and reports directly to our CEO. Our commitment to human rights We are committed to protecting human rights across our operations, including our supply chain. We’re proud to share our human rights policy, and we believe that protecting and supporting human rights is our fundamental responsibility as an employer. We comply with all applicable employment and human rights laws and regulations where we have operations to ensure alignment with our values. • We provide fair and equitable wages, benefits, and other conditions of employment in accordance with local laws and regulations. • We do not allow child labor in our operations. • We do not use or engage in any form of coerced, indentured, or prison labor. • We provide a safe and healthy work setting, including PPE and the tools to work safely. • We promote a workplace that is free of discrimination and harassment and prohibit threats or abuse. • We embrace diversity in the workforce and supplier base, create an environment that promotes diverse opinions and equal opportunity, and operate in a way that treats all people with respect and dignity. TABLE OF CONTENTS 2021 OVERVIEW COVID-19 RESPONSE PROMOTING A HEALTHIER WORLD CREATING AN INSPIRING WORKPLACE BUILDING VALUE REFERENCES
2021 CORPORATE RESPONSIBILITY REPORT I 69 At Quest, we know that the strength and resilience of our cybersecurity and data privacy oversight and preparedness are critical in maintaining the trust of our customers, partners, employees, shareholders, and other stakeholders. Governance practices We have robust governance practices with respect to cybersecurity and data privacy. Our Board of Directors oversees and is regularly engaged in our cybersecurity and data privacy efforts. The Board’s Cybersecurity Committee, which consists solely of independent directors, oversees the company’s cybersecurity policies, plans, programs, practices, and risks related to cybersecurity and data security. The Board’s Audit and Finance Committee, which is responsible for overseeing our enterprise risk management program, receives updates regarding cybersecurity at least annually. The Board’s Quality and Compliance Committee oversees and receives regular updates on data privacy. Management is responsible for cybersecurity, data privacy, and related risks, including through committees consisting of senior officers of the company (eg, our Senior Vice President and Chief Information and Digital Officer; our Vice President, Chief Information Security Officer; our Senior Vice President, General Counsel; and our Senior Vice President, Compliance). The Board regularly receives briefings and updates on cybersecurity, data privacy, and related risks from each of the responsible committees and management. Data privacy and security Quest maintains comprehensive controls and oversight related to data privacy and security laws and regulations as well as our contractual obligations. As a company operating in a highly regulated industry, we are subject to extensive data privacy and security laws and regulations, including, but not limited to, the Health Insurance Portability and Accountability Act (HIPAA), various state privacy laws, and the General Data Protection Regulation (GDPR). In addition, as many of our customers are heavily regulated, we are subject to numerous contractual requirements relating to cybersecurity and data privacy. We meet our breach reporting and notification obligations by notifying affected individuals, regulatory authorities, and other entities as required by law. Management is responsible for compliance with these laws, regulations, and requirements and regularly evaluates the information technology (IT) security and data privacy programs. As discussed above, the Board provides oversight. Data security incidents are reflected in our financial statements in accordance with accounting standards. Quest maintains a comprehensive, enterprise-wide, cybersecurity program and an extensive data privacy program, both of which are designed to secure our facilities and information systems as well as protect data throughout its lifecycle. Examples • Our HIPAA Notice of Privacy Practices, Privacy Notice, and Cookie Notice, all available on our website , include information about our data use, data disclosure, and privacy practices. Cybersecurity and data privacy are high-level priorities “All employees have a duty to report potential or suspected violations of company policy or the law, including those involving data privacy, and we provide confidential channels to do so. This is how we safeguard our integrity and support a culture of trust and accountability.” Gabrielle Wolfson Senior Vice President and Chief Information and Digital Officer TABLE OF CONTENTS 2021 OVERVIEW COVID-19 RESPONSE PROMOTING A HEALTHIER WORLD CREATING AN INSPIRING WORKPLACE BUILDING VALUE REFERENCES
2021 CORPORATE RESPONSIBILITY REPORT I 70 Cybersecurity and data privacy are highest-level priorities (continued) • Our data privacy program is supported by a comprehensive set of policies and procedures that describe appropriate uses of data and the administrative, technical, and physical safeguards we have in place to protect the privacy and confidentiality of the information with which we are entrusted. We adhere to HIPAA’s minimum necessary standard, which requires that we limit the use or disclosure of protected health information (PHI) to only what is necessary to accomplish the intended purpose of a particular use, disclosure, or request. We have a well- established program to receive, investigate, and respond to privacy complaints. As set forth in our Code of Ethics, all employees have a duty to report potential or suspected violations of company policy or the law, including those involving data privacy. When a breach occurs, we take corrective action to address the breach and implement proactive measures to help reduce the risk of future breaches. • Our cybersecurity program incorporates standards, processes, and activities over best practice domains, such as governance, access controls, facility and data protection, IT systems and data transmission security, threat intelligence and incident response, third-party risk management, disaster recovery, and vulnerability management. • At our facilities, we employ strong physical security measures, including limiting access to authorized employees, requiring visitors to be escorted at all times, utilizing environmental security controls, and maintaining secured storage areas for confidential information. • Our Strategic Threat and Intelligence Center manages our threat landscape and uses a variety of security technology and threat intelligence tools designed to detect, prevent, block, analyze, and respond to cybersecurity threats. • We have a well-established incident response program that is reviewed and tested annually. • Due to the constantly changing nature of technologies and security concerns, we regularly conduct audits and risk assessments and review our security and privacy policies and procedures. • Our cybersecurity program is based on the National Institute of Standards and Technology’s NIST 800 Special Publication Information Security standard. The cybersecurity program is aligned with the company’s ERM function. • We educate employees through cybersecurity awareness and data privacy training programs at least annually. Our training activities are designed to educate employees on important subjects (eg, protecting patient privacy; ensuring safe data storage and transit; and recognizing potential cybersecurity attacks) and to build awareness about cybersecurity and data privacy risks (eg, through security awareness challenges, alerts, and simulated phishing campaigns). We also conduct training exercises to simulate emergent threats and scenarios that could arise from potential cybersecurity attacks and data breaches, improving the effectiveness of our incident response and business restoration procedures. • We maintain programs designed to assess and address the security and data privacy risks of our suppliers, outsourcing partners (including with respect to revenue cycle management), potential acquisition targets, and other business partners (both at the beginning of a relationship and on an ongoing basis, as appropriate, based on risk). It is our policy to enter business associate agreements with vendors that obtain, maintain, use, or disclose PHI on our behalf; these vendors agree to safeguard the PHI as required by HIPAA. We also have policies and procedures in place that govern data transfers to third parties, including appropriate methods and controls, such as standard contractual requirements. • Our cybersecurity program and policies are aligned with appropriate, widely recognized standards, such as NIST, PCI, the Payment Card Industry (PCI) Data Security Standard, the System and Organization Controls for Service Organizations 2 (SOC 2), ISO 9001:2015 and ISO 15189, and Sarbanes-Oxley. • We are a participating member of the Health Information Sharing and Analysis Center (H-ISAC), a health-industry forum focused on cyber and physical security threats. • We have engaged with US intelligence and law enforcement agencies to make faster, more informed security decisions to identify, respond to, mitigate, and prevent cybersecurity threats. • We carry insurance for cyber-related incidents and breaches at industry-standard levels. The policy, including types and amounts of coverage, are reviewed annually. For more information on our board committees, including the Cybersecurity Committee, please refer to our 2022 Proxy Statement. For more information on risks relating to cybersecurity and how we mitigate such risks, please refer to our 2021 Annual Report on Form 10-K. TABLE OF CONTENTS 2021 OVERVIEW COVID-19 RESPONSE PROMOTING A HEALTHIER WORLD CREATING AN INSPIRING WORKPLACE BUILDING VALUE REFERENCES •
2021 CORPORATE RESPONSIBILITY REPORT I 71 Driving supplier excellence and innovation through collaboration At Quest, we rely on our suppliers to deliver the resources we need to achieve our mission and goals, and supplier relationships continue to play an essential role in our response to the COVID-19 pandemic. Through strategic partnerships and the agility of our global supply chain, Quest was able to respond quickly to the worldwide health crisis and take proactive measures to provide critical testing services to customers and communities across the nation. We also leveraged our supply network to secure new resources, including international and diverse suppliers for large volumes of collection supplies and PPE. We then successfully and efficiently distributed these critical materials to clients and labs through our regional fulfillment centers. Supplier scientific and engineering advancements play a key role in Quest’s ability to bring meaningful improvement to people’s lives, fill gaps in care, and provide better testing solutions. In recent projects, suppliers made major contributions. • Launching a less intrusive liver disease monitoring solution • Developing a new women’s health testing solution that makes it easier to diagnose bacterial infections • Collaborating to deliver diabetic retinal imaging services for patient screening in designated patient service centers as part of a diabetes management program To drive operational excellence, we remain focused on improving our operational quality and service, and reducing costs to increase productivity. We’re not immune to the current inflationary environment, but by tightly managing our operations, we expect productivity improvements to help offset these pressures. Our Procurement team continues to work with our strategic suppliers to mitigate potential price increases and improve productivity through our long-term relationships. To date, the team has effectively managed challenges in our global supply chain. We also look to our suppliers to deliver innovation to help us lower the overall cost of testing and improve quality. Supply chain risk management We are committed to maintaining a sustainable supply chain that embodies the ethics and culture of Quest Diagnostics to ensure the health, safety, and well-being of our patients, clients, and operations by: • Assessing all sourcing opportunities for product and service risk • Qualifying suppliers using a set of tools appropriate to risk level, including screenings, ratings, self-assessments, and on-site audits • Performing detailed audits on-site by our global sourcing team • Using third-party monitoring services for 24/7 coverage, updates, and alerts on suppliers in the highest-risk tier • Monitoring supplier performance in quality, delivery, and service; tracking complaints and problems; and assessing and reporting on supplier performance trends with multidimensional supplier scorecards • Conducting periodic supplier self-assessment surveys and on-site surveillance audits of risk-prioritized suppliers • Maintaining third-party cybersecurity and data privacy protection programs as part of IT security risk management Adherence to our Supplier Code of Conduct Quest has a Supplier Code of Conduct that governs our expectations of supplier behavior. • Following ethical policies, procedures, and standards in all business practices • Complying with all legal and regulatory requirements • Upholding environmental, health, and safety practices • Safeguarding labor and human rights • Protecting data and intellectual property • Reporting questionable behavior TABLE OF CONTENTS 2021 OVERVIEW COVID-19 RESPONSE PROMOTING A HEALTHIER WORLD CREATING AN INSPIRING WORKPLACE BUILDING VALUE REFERENCES
2021 CORPORATE RESPONSIBILITY REPORT I 72 All contracted suppliers must: • Acknowledge receipt and review of the Supplier Code of Conduct in writing • Complete required supplier self-assessment surveys, upon onboarding and periodically • Comply with monthly regulatory screening of every supplier • Expect that any supplier—and their representatives and personnel— whose conduct proves unlawful or inconsistent with the Code of Conduct or any Quest policy is subject to immediate removal Partnering for the planet We are partnering with several suppliers who share our commitment to making the planet greener. Together, we’re working to develop and deploy innovative solutions to: • Reduce waste in the supply chain, including reducing reliance on air freight • Eliminate wasteful exterior packaging materials • Validate reuse of plastic consumables that historically have been single-use items Quest’s waste management suppliers are helping us assess “waste to energy” and on-site medical waste sterilization systems. Quest is planning to convert 2 major lab facilities to zero landfill waste management and anticipates completing conversion in 2023. Quest’s commitment to supplier diversity Quest has purchased more than $1B in goods and services over the past 3 years from US small and diverse businesses. In 2021, Quest spent over $400M with these suppliers, and we plan to grow our small business and diverse supplier spend to greater than $500M annually by 2025. We are committed to: • Strengthening our small and diverse business communities through our actions and membership with the National Minority Supplier Development Council (NMSDC), the Health Care Industry Group (HCIG), and the National LGBT Chamber of Commerce (NGLCC) Corporate Advisory Council • Satisfying customer requirements for increased spend with small and diverse suppliers Driving supplier excellence and innovation through collaboration (continued) • Contributing to the overall economic growth and expansion of our markets • Identifying small and diverse businesses to provide services and event support for Quest for Health Equity (Q4HE) Supply chain ESG initiatives An initiative is in progress to enhance the tracking and reporting of the ESG maturity of our supply base. We expect to deploy our enhanced solution in 2022 as our next step in improving and reporting on the social and environmental impact of our supply chain. A virtual “sit-down” with suppliers strengthens partnerships Every 2 years, Quest welcomes our suppliers to a forum where we can discuss our strategy and how we can serve one another better. Our 2021 Supplier Forum was the first time we held the event virtually, and nearly 300 people joined us. During the forum, Jim Davis , CEO-elect and Executive Vice President, General Diagnostics, thanked participating suppliers for their herculean efforts since the beginning of the pandemic. “From the bottom of our hearts, thanks to those who helped us scale our COVID-19 capacity, whether it was molecular testing, serology testing, or sequencing variants,” Jim said. “Thanks also to those who are supporting our base business. We couldn’t do what we do without you.” Vice President and Chief Procurement Officer Tom Plungis, noted, “It’s important for us to sit down with our suppliers to let them know where we’re going and listen to how they can help us. Our suppliers appreciate the time with Steve Rusckowski [Quest Chairman, CEO, and President] and Jim to discuss our strategy, and we always get great ideas to help us accelerate growth and drive operational excellence. With the event being virtual, a record number of people were able to share their ideas. We can’t go it alone, and our suppliers appreciate the efforts we make to take them on the journey with us.” TABLE OF CONTENTS 2021 OVERVIEW COVID-19 RESPONSE PROMOTING A HEALTHIER WORLD CREATING AN INSPIRING WORKPLACE BUILDING VALUE REFERENCES
2021 CORPORATE RESPONSIBILITY REPORT I 73 SASB Sustainability Accounting Standards Index Quest Diagnostics has issued its first Sustainability Accounting Standards Board (SASB) Index for the period 2021. We are classified under SASB’s Health Care Delivery Industry Standard. In addition to reporting on metrics for that industry where applicable (see Tables 1 and 2), we are reporting on select metrics from other industry-specific SASB standards we believe are relevant to our operations (see Table 3). Our decision to disclose additional metrics is based on our assessment of ESG topics that matter to our investors and other stakeholders. ERM Certification and Verification Services (ERM CVS) conducted independent third-party assurance of year 2021 Scope 1 and 2 greenhouse gas emissions data. See the Independent Assurance Statement by ERM CVS here . SASB Code Metric Response Energy Management HC-DY-130a.1 (1) Total energy consumed (2) Percentage grid electricity (3) Percentage renewable (1) 2,476,076 gigajoules (2) 43.97% (3) 2.64% Waste Management HC-DY-150a.1 Total amount of medical waste, percentage (a) incinerated, (b) recycled or treated, and (c) landfilled In 2021, Quest had 10,860 metric tons of medical waste, all of which is treated. HC-DY-150a.2 Total amount of: (1) hazardous and (2) non-hazardous pharmaceutical waste, percentage (a) incinerated, (b) recycled or treated, and (c) landfilled In 2021, Quest did not produce pharmaceutical waste. Patient Privacy & Electronic Health Records HC-DY-230a.1 Percentage of patient records that are Electronic Health Records (EHR) that meet "meaningful use" requirements A ll Quest Diagnostics lab results can be utilized by lab customers in a way that meets the EHR meaningful use requirements. Quest Diagnostics EHR system is listed on the Certified Health IT Product List . HC-DY-230a.2 Description of policies and practices to secure customers’ protected health information (PHI) records and other personally identifiable information (PII) See 2021 Corporate Responsibility Report, pages 69 and 70. Table 1: Health Care Delivery Industry Standard Accounting Metrics TABLE OF CONTENTS 2021 OVERVIEW COVID-19 RESPONSE PROMOTING A HEALTHIER WORLD CREATING AN INSPIRING WORKPLACE BUILDING VALUE REFERENCES
2021 CORPORATE RESPONSIBILITY REPORT I 74 SASB Code Metric Response HC-DY-230a.3 ( 1) Number of data breaches, (2) percentage involving (a) personally identifiable information (PII) only and (b) protected health information (PHI), (3) number of customers affected in each category, (a) PII only and (b) PHI Not reported HC-DY-230a.4 Total amount of monetary losses because of legal proceedings associated with data security and privacy When public disclosure criteria are met, monetary losses as a result of legal proceedings associated with data security and privacy are included in Quest Diagnostics Annual Report on Form 10-K. Access for Low-Income Patients HC-DY-240a.1 Discussion of strategy to manage the mix of patient insurance status Quest Diagnostics is committed to providing service to all patients, including those who have commercial or government insurance or are uninsured. Through our Patient Assistance Program, we tailor solutions for uninsured or underinsured patients based on individual circumstances. HC-DY-240a.2 Amount of Medicare Disproportionate Share Hospital (DSH) adjust ment payments received Not applicable – Quest Diagnostics does not operate hospitals. Quality of Care & Patient Satisfaction HC-DY-250a.1 Average Hospital Value-Based Purchasing Total Performance Score and domain score, across all facilities Not applicable – Quest Diagnostics does not operate hospitals. HC-DY-250a.2 Number of Serious Reportable Events (SREs) as defined by the National Quality Forum (NQF) Not applicable – Quest Diagnostics does not operate hospitals. HC-DY-250a.3 Hospital-Acquired Condition (HAC) Score per hospital Not applicable – Quest Diagnostics does not operate hospitals. HC-DY-250a.4 Excess readmission ratio per hospital Not applicable – Quest Diagnostics does not operate hospitals. HC-DY-250a.5 Magnitude of readmissions payment adjustment as part of the Hospital Readmissions Reduction Program (HRRP) Not applicable – Quest Diagnostics does not operate hospitals. Management of Controlled Substances HC-DY-260a.1 Description of policies and practices to manage the number of prescriptions issued for controlled substances Not applicable – Quest Diagnostics does not issue prescriptions for controlled substances. Table 1: Health Care Delivery Industry Standard Accounting Metrics (Continued) TABLE OF CONTENTS 2021 OVERVIEW COVID-19 RESPONSE PROMOTING A HEALTHIER WORLD CREATING AN INSPIRING WORKPLACE BUILDING VALUE REFERENCES
2021 CORPORATE RESPONSIBILITY REPORT I 75 SASB Code Metric Response HC-DY-260a.2 Percentage of controlled substance prescriptions written for which a prescription drug monitoring program (PDMP) database was queried Not applicable – Quest Diagnostics does not issue prescriptions for controlled substances. HC-DY-270a.1 Description of policies or initiatives to ensure that patients are adequately informed about price before undergoing a procedure Quest Diagnostics aims to be as transparent as possible about the pricing of its services. Pricing is publicly available online for all tests (currently approximately 50) offered by QuestDirect ® , our consumer-facing offering that enables individuals to select and purchase laboratory testing from Quest Diagnostics. Many patients who use Quest Diagnostics patient service centers for testing can take advantage of our Real Time Estimation initiative to understand the cost of their lab tests before they are tested (not available for all patients). HC-DY-270a.2 Discussion of how pricing information for services is made publicly available See response to HC-DY-270a.1. HC-DY-270a.3 Number of the entity’s 25 most common services for which pricing is publicly available, percentage of total services performed (by volume) that these represent The tests (currently approximately 50) offered by QuestDirect, our consumer-facing offering that enables individuals to select and purchase laboratory testing from Quest Diagnostics, represent less than 5% by volume of our total services. Employee Health & Safety HC-DY-320a.1 (1) Total recordable incident rate (TRIR) and (2) days away, restricted, or transferred (DART) rate (1) 2.07 (2) 0.56 Employee Recruitment, Development & Retention HC-DY-330a.1 (1) Voluntary and (2) involuntary turnover rate for: (a) physicians, (b) non-physician health care practitioners, and (c) all other employees Voluntary Turnover Rate (%) Involuntary Turnover Rate (%) Physicians 10.9% Not disclosed Non-physician health care practitioners Not applicable Not applicable All other employees 24.2% Not disclosed HC-DY-330a.2 Description of talent recruitment and retention efforts for healthcare practitioners See 2021 Corporate Responsibility Report, page 52. Table 1: Health Care Delivery Industry Standard Accounting Metrics (Continued) TABLE OF CONTENTS 2021 OVERVIEW COVID-19 RESPONSE PROMOTING A HEALTHIER WORLD CREATING AN INSPIRING WORKPLACE BUILDING VALUE REFERENCES
2021 CORPORATE RESPONSIBILITY REPORT I 76 SASB Code Metric Response Climate Change Impacts on Human Health & Infrastructure HC-DY-450a.1 Description of policies and practices to address: (1) the physical risks due to an increased frequency and intensity of extreme weather events and (2) changes in the morbidity and mortality rates of illnesses and diseases associated with climate change Quest Diagnostics maintains a business continuity program to prepare for and respond to risks to our physical infrastructure and assets presented by extreme weather events and natural disasters, whether as a result of climate change or otherwise. The program covers our critical US facilities, including laboratory operations and offices, and addresses the full range of issues, including remediation of power interruptions. The company’s Board of Directors receives annual updates on the program. Quest Diagnostics is beginning to develop policies and practices to address the risks and opportunities presented by changes in the prevalence, geographic location, and severity of diseases that may be impacted by climate change (eg, changing patient testing capacity needs or disease profiles that require new testing). HC-DY-450a.2 Percentage of healthcare facilities that comply with the Centers for Medicare and Medicaid Services (CMS) Emergency Preparedness Rule Quest Diagnostics provides diagnostic information services and does not maintain healthcare facilities subject to the CMS Emergency Preparedness Rule. Fraud & Unnecessary Procedures HC-DY-510a.1 Total amount of monetary losses because of legal proceedings associated with Medicare and Medicaid fraud under the False Claims Act When public disclosure criteria are met, monetary losses as a result of legal proceedings under the False Claims Act are included in the Quest Diagnostics Annual Report on Form 10-K. Table 1: Health Care Delivery Industry Standard Accounting Metrics (Continued) SASB Code Metrics Response HC-DY-000.A Number of (1) facilities and (2) beds, by type Not applicable – Quest Diagnostics does not operate hospitals. HC-DY-000.B Number of (1) inpatient admissions and (2) outpatient visits Not applicable – Quest Diagnostics does not operate hospitals. Table 2: Health Care Delivery Industry Inventory Metrics TABLE OF CONTENTS 2021 OVERVIEW COVID-19 RESPONSE PROMOTING A HEALTHIER WORLD CREATING AN INSPIRING WORKPLACE BUILDING VALUE REFERENCES
2021 CORPORATE RESPONSIBILITY REPORT I 77 SASB Code Metrics Response Medical Equipment & Supplies Industry Standard } Business Ethics HC-BP-510a.2 Description of code of ethics governing interactions with healthcare professionals Quest Diagnostics maintains a Code of Ethics applicable to all employees. The Code applies to all employee activity, including interactions with healthcare professionals. HC-BP-510a.1 Total amount of monetary losses as a result of legal proceedings associated with bribery or corruption When public disclosure criteria are met, monetary losses as a result of legal proceedings associated with bribery and corruption are included in the Quest Diagnostics Annual Report on Form 10-K. Medical Equipment & Supplies Industry Standard } Ethical Marketing HC-BP-270a.1 Total amount of monetary losses because of legal proceedings associated with false marketing claims When public disclosure criteria are met, monetary losses as a result of legal proceedings associated with false marketing claims are included in the Quest Diagnostics Annual Report on Form 10-K. Health Care Distributors Industry Standard HC-DI-510a.1 Description of efforts to minimize conflicts of interest and unethical business practices Quest Diagnostics maintains a Code of Ethics applicable to all employees and all employee activity. Quest Diagnostics also maintains a Conflict of Interest Policy applicable to all employees. The Policy applies to all employee activity that may cause or create the appearance of a conflict of interest. Table 3: Additional Accounting Metrics TABLE OF CONTENTS 2021 OVERVIEW COVID-19 RESPONSE PROMOTING A HEALTHIER WORLD CREATING AN INSPIRING WORKPLACE BUILDING VALUE REFERENCES
2021 CORPORATE RESPONSIBILITY REPORT I 78 Our annual Corporate Responsibility Report focuses on environmental, social and governance (ESG) topics. Data in this Report are as of December 31, 2021 or covers the period from January 1, 2021 to December 31, 2021, unless otherwise indicated. In some instances, we also provide information as of a date in 2022 to provide more up-to-date information to our stakeholders. When we use the terms “Quest,” “Quest Diagnostics,” “company,” “we,” “us,” or “our” in this Report, we mean Quest Diagnostics Incorporated and its subsidiaries, on a consolidated basis, unless we state, or the context implies, otherwise. The report does not include companies in which Quest Diagnostics has an investment. The Quest Diagnostics Foundation is a separate entity. This Report is an important source of Quest Diagnostics annual ESG disclosures. For additional and complementary ESG information about Quest Diagnostics, please refer to the disclosures on the Quest Diagnostics Corporate Responsibility website and in our periodic reports and proxy statements filed with US Securities and Exchange Commission (SEC), which also are available on our investor relations webpages . New this year, our Report includes reporting aligned with the Sustainability Accounting Standards Board (SASB) standards. As we navigate the evolving space of ESG frameworks, standards and guidelines, we have prioritized disclosures that allow us to most effectively communicate with our stakeholders. We will continue to evaluate the available frameworks, standards, and guidelines and, in the future, our ESG disclosures may evolve. Materiality, as used in this Report and in our Materiality Assessment process, is different than the definition of materiality applicable to our reports and other filings with the SEC as set forth under the securities or other laws of the United States or other jurisdictions or as may be applicable to our consolidated financial statements. The inclusion of information in this Report should not be construed as a characterization by us that the information is material under the securities laws or material as it relates to our consolidated financial statements. ERM Certification and Verification Services (ERM CVS) conducted independent third-party assurance of year 2021 Scope 1 and 2 greenhouse gas emissions data. See the Independent Assurance Statement by ERM CVS here . This Report includes forward-looking statements. Forward-looking statements include all statements that do not relate solely to historical or current facts and can be identified by the use of words such as “may,” “believe,” “will,” “expect,” “project,” “estimate,” “anticipate,” “plan,” or “continue.” These forward- looking statements are based on our current plans and expectations and are subject to a number of risks and uncertainties that could cause our plans and expectations, including actual results, to differ materially from the forward-looking statements. Actual results may differ from those set forth in the forward-looking statements due to a variety of reasons, including, but not limited to, impacts of the COVID-19 pandemic and measures taken in response, adverse results from pending or future government investigations, lawsuits or private actions, the competitive environment, the complexity of billing, reimbursement and revenue recognition for clinical laboratory testing, changes in government regulations, changing relationships with customers, payers, suppliers or strategic partners, changes in developing standards and certifications, the cost and availability of renewable energy and carbon offset and carbon removal projects, energy attribute certificates and green buildings, the availability and cost of alternatives to current technologies, power and transportation sources and waste treatment and recycling systems, and changes in economic or business conditions and the company’s ability to grow, improve its financial performance and execute on its strategies. A further description of these and other risks and uncertainties can be found in the company’s most recent Annual Report on Form 10-K and in any of the company’s subsequently filed Quarterly Reports on Form 10-Q and Current Reports on Form 8-K, including those discussed in the “Business,” “Risk Factors,” Cautionary Factors that May Affect Future Results,” and “Management’s Discussion and Analysis of Financial Condition and Results of Operations” section of those reports. You are cautioned not to unduly rely on such forward-looking statements when evaluating the information presented in this Report, which speak only as of the date on which they are made. We undertake no obligation to update or revise any forward-looking statements. Contact us: We welcome your questions or feedback on this Report. Please contact the Quest Diagnostics Corporate Responsibility Team at [email protected] . About this report TABLE OF CONTENTS 2021 OVERVIEW COVID-19 RESPONSE PROMOTING A HEALTHIER WORLD CREATING AN INSPIRING WORKPLACE BUILDING VALUE REFERENCES
2021 CORPORATE RESPONSIBILITY REPORT I 79 References Page 25 1. Kaufman HW, Chen Z, Niles J, Radcliff J, Fesko YA. Changes in the number of US patients with newly identified cancer before and during the coronavirus disease 2019 (COVID-19) pandemic. JAMA Netw Open. 2020;3:e2017267. doi:10.1001/jamanetworkopen.2021.25681 2. Kaufman HW, Bull-Otterson L, Meyer WA, et al. Decreases in hepatitis C testing and treatment during the COVID-19 pandemic. Am J Prev Med. 2021;61(3):369-376. doi:10.1016/j.amepre.2021.03.011 3. Pinto CN, Niles JK, Kaufman HW, et al. Impact of the COVID-19 pandemic on chlamydia and gonorrhea screening in the U.S. Am J Prev Med. 2021;61(3):386-393. doi:10.1016/j.amepre.2021.03.009 4. Fragala MS, Kaufman HW, Meigs JB, et al. Consequences of the COVID-19 pandemic: reduced hemoglobin A1c diabetes monitoring. Popul Health Manag. 2021;24(1):8-9. doi:10.1089/pop.2020.0134 5. Cavallo J. How delays in screening and early cancer diagnosis amid the COVID-19 pandemic may result in increased cancer mortality: a conversation with NCI Director Norman E. ‘Ned’ Sharpless, MD. The ASCO Post. September 10, 2020. Accessed April 22, 2021. https://ascopost.com/issues/september-10-2020/how-delays-in- screening-and-early-cancer-diagnosis-amid-the-covid-19-pandemic-may-result-in-increased-cancer-mortality/ 6. Harris Poll of 2,050 US adults. November 10-12, 2020. Data on file. Quest Diagnostics, 2020. Page 26 1. Kaufman HW, Chen Z, Niles JK, Fesko YA. Changes in newly identified cancer among US patients from before COVID-19 through the first full year of the pandemic. JAMA Netw Open. 2021;4(8):e2125681. doi:10.1001/jamanetworkopen.2021.25681 2. Risk of dying from cancer continues to drop at an accelerated pace. American Cancer Society website. Published January 12, 2022. Accessed May 1, 2022. https://www.cancer.org/latest-news/facts-and- figures-2022.html 3. Cavallo J. How delays in screening and early cancer diagnosis amid the COVID-19 pandemic may result in increased cancer mortality: a conversation with NCI Director Norman E. ‘Ned’ Sharpless, MD. The ASCO Post. September 10, 2020. Accessed April 22, 2021. https://ascopost.com/issues/september-10-2020/how- delays-in-screening-and-early-cancer-diagnosis-amid-the-covid-19-pandemic-may-result-in-increased- cancer-mortality/ 4. Hauptman M, Niles JK, Gudin J, Kaufman HW. Individual- and community-level factors associated with detectable and elevated blood lead levels in US children: results from a national clinical laboratory. JAMA Pediatr. 2021;175(12):1252-1260. doi:10.1001/jamapediatrics.2021.3518 Page 27 1. Harris Poll of 505 primary care physicians. August 12-19, 2021. Data on file. Quest Diagnostics, 2021. 2. Kaufman HW, Gudin J, et al. Drug Misuse in America 2021: Physician Perspectives and Diagnostic Insights on the Drug Crisis and COVID-19. November 2021. Quest Diagnostics Health Trends® . Quest Diagnostics. Page 28 1. Centers for Disease Control and Prevention, National Center for Health Statistics. Underlying Cause of Death 1999-2017 on CDC WONDER Online Database, released December 2018. Data are from the Multiple Cause of Death Files, 1999-2017, as compiled from data provided by the 57 vital statistics jurisdictions through the Vital Statistics Cooperative Program. Reviewed March 2, 2022. Accessed March 31, 2022. 2. Mosca L, Benjamin EJ, Berra K, et al. Effectiveness-based guidelines for the prevention of cardiovascular disease in women—2011 update: A guideline from the American Heart Association. Circulation. 2011;123:1–20. Accessed May 1, 2022. https://www.cdc.gov/dhdsp/pubs/docs/science_in_brief_cvd_women.pdf 3. Rosamond WD, Chambless LE, Heiss G, et al. Twenty-two–year trends in incidence of myocardial infarction, coronary heart disease mortality, and case fatality in 4 US communities, 1987–2008. Circulation. 2012;125:1848–1857. 4. Virani SS, Alonso A, Benjamin EJ, et al. Heart disease and stroke statistics—2020 update: a report from the American Heart Association. Circulation. 2020;141(9); e139-e596. doi:10.1161/CIR.0000000000000757 Page 29 1. Richardson LC, Henley SJ, Miller JW, et al. Patterns and trends in age-specific black-white differences in breast cancer incidence and mortality – United States, 1999–2014. MMWR. 2016;65:1093–1098. doi:10. 15585/mmwr.mm6540a1 2. Shavers VL, Harlan LC, Stevens JL. Racial/ethnic variation in clinical presentation, treatment, and survival among breast cancer patients under age 35. Cancer. 2003;97(1):134-147. doi:10.1002/cncr.11051 Page 30 1. Taquet M, Geddes JR, Husain M, Luciano S, Harrison PJ. 6-month neurological and psychiatric outcomes in 236,379 survivors of COVID-19: a retrospective cohort study using electronic health records. Lance Psychiatry. 2021;8(5):416-427. Doi:10.1016/S2215-0366(21)00084-5. https://www.sciencedirect.com/science/article/pii/ S2215036621000845 2. Alzheimer’s Association. 2021 Alzheimer’s disease facts and figures. Accessed December 7, 2021. https://www.alz.org/media/Docments/alzheimers-facts-and-figure.pdf 3. Li Y, Schindler SE, Bollinger J, et al. Validation of plasma amyloid- β 42/40 for detecting Alzheimer disease amyloid plaques. Neurology. Online ahead of print, December 14, 2021. doi:10.1212/WNL.0000000000013211 4. Data on file. Quest Diagnostics, 2022. 5. Burnham SC, Fandos N, Fowler C, et al. Longitudinal evaluation of the natural history of amyloid- β in plasma and brain. Brain Commun. 2020;2(1)fcaa041. doi:10.1093/braincomms/fcaa041 6. Cummings J, Lee G, Zhong K, et al. Alzheimer’s disease drug development pipeline: 2021. Alzheimers Dement (N Y). 2021;7(1):e12179. doi:10.1002/trc2.12179 Page 55 1. McKenna K. High employee morale decreases turnover. [Re: Achievers Workforce Institute 2022 Engagement and Retention Report. ] Business News Daily (online). Updated April 15, 2022. https://www.businessnewsdaily.com/15272-employee-experience-engagement.html TABLE OF CONTENTS 2021 OVERVIEW COVID-19 RESPONSE PROMOTING A HEALTHIER WORLD CREATING AN INSPIRING WORKPLACE BUILDING VALUE REFERENCES