MetLife Sustainability Report

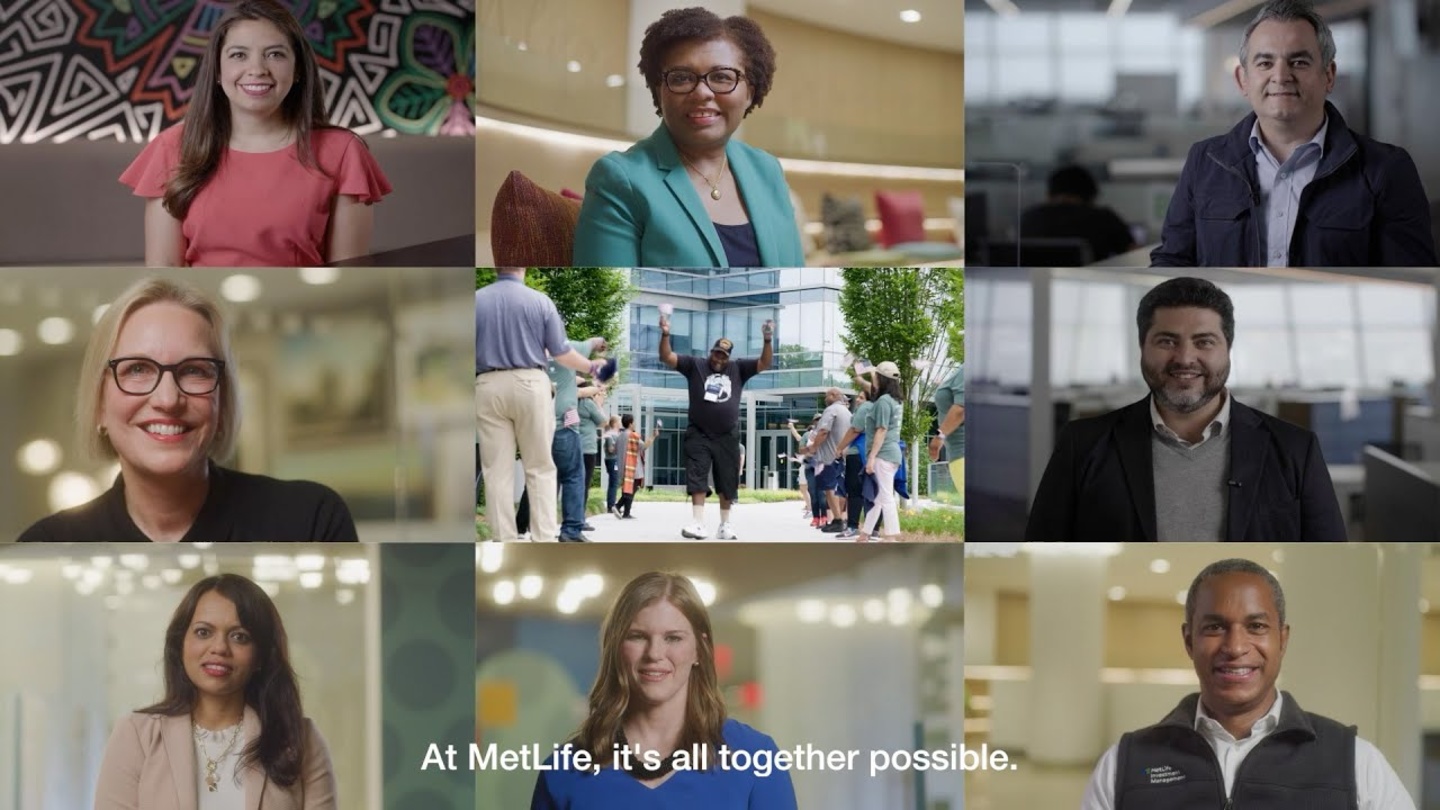
Table of Contents 2 About 40 Creating Value as MetLife an Investor GO TO SECTION > GO TO SECTION > 6 Sustainability 54 For the at MetLife Environment GO TO SECTION > GO TO SECTION > 12 For Our 64 For Our Workforce Communities GO TO SECTION > GO TO SECTION > 26 For Our 76 Managing Customers Responsibly GO TO SECTION > GO TO SECTION > 88 Appendix GO TO SECTION >
Sustainability For Our For Our Creating Value For the For Our Managing Appendix at MetLife Workforce Customers as an Investor Environment Communities Responsibly Always with you, $ building a more 40+ 669 confident future. global markets billion served total assets under Living our purpose is how MetLife contributes management1, 2 to a more confident future as an employer, an investor and a provider of financial solutions and expertise. It’s at the heart of our virtuous circle of serving our people, our communities, our customers and our shareholders. ~43,000 ABOUT METLIFE MetLife Inc. and its subsidiaries and affiliates employees (MetLife), has helped generations of people around the world protect their families and finances. We are one of the world’s leading financial services companies, providing insurance, annuities, employee benefits $ and asset management to our individual 82 and institutional customers. MetLife has operations in more than 40 markets globally billion+ 154 and holds leading positions in the United States, Japan, Latin America, Asia, Europe in responsible years of operation and the Middle East. We are committed to 1, 2 building a more confident future for all of investments our stakeholders—employees, customers, shareholders and the communities we serve. 1. SEE CREATING VALUE AS AN INVESTOR AND RESPONSIBLE INVESTMENTS FOR MORE DETAILED INFORMATION ON METLIFE INVESTMENT MANAGEMENT'S (MIM) ASSETS UNDER MANAGEMENT (AUM) AND RESPONSIBLE INVESTMENTS. 2. AT ESTIMATED FAIR VALUE AS OF 12/31/2021. 2021 SUSTAINABILITY REPORT 2
Sustainability For Our For Our Creating Value For the For Our Managing Appendix at MetLife Workforce Customers as an Investor Environment Communities Responsibly Next Horizon Strategy MetLife’s Next Horizon strategy is designed to accelerate resource allocation to the highest value opportunities and to promote sustainable competitive differentiation. Delivering on our Next Horizon strategy involves providing solutions that anticipate and meet our customers’ evolving needs and enable our teams to effectively do their jobs, which has resulted in exceptional investment returns, expense discipline and topline growth. The pillars of our Next Horizon strategy are threefold: Focus Generate strong free cash flow by deploying capital and resources to the highest value opportunities Simplify Simplify our business to deliver operational efficiency and an outstanding customer experience Differentiate Drive competitive advantage through our brand, scale, talent and innovation 2021 SUSTAINABILITY REPORT 3
Sustainability For Our For Our Creating Value For the For Our Managing Appendix at MetLife Workforce Customers as an Investor Environment Communities Responsibly Letter from Our CEO While much has changed throughout MetLife’s of sustainability, we’ve charted an ambitious history, one constant has been our focus on path forward and are holding ourselves the future. accountable by tracking and reporting As a global insurer, MetLife exists to protect our progress along the way. people, businesses and communities from unexpected challenges, to sustain them in NET ZERO BY 2050 times of need and to help them move forward confidently. Our liabilities are a promise to MetLife has made the commitment to pay, helping to sustain people as they rebuild. achieve net zero greenhouse gas (GHG) And our assets promote job creation, emissions for our global operations and economic growth and financial stability. general account investment portfolio by 2050 or sooner. At the very heart of our commitment to sustainability is MetLife’s purpose: Always OUR 2030 CLIMATE GOALS with you, building a more confident future. As we look out at the horizon, we see Our net zero commitment builds upon our inequities running deep, underserved existing 2030 Climate Goals aimed at reducing communities requiring innovative ways the environmental impact of MetLife’s global to drive long-term economic growth and the operations and supply chain, while leveraging risks associated with climate change our investments, products and services to continuing to mount. It is difficult to drive innovative climate solutions. Specific overstate how crucial sustainability will goals include maintaining carbon neutrality be in building a more confident future annually, which we’ve done since becoming for generations to come. the first U.S.-based insurer to achieve that status in 2016; reducing our location-based This is why we’re deploying the full strength emissions by an additional 30%; originating of our people, products, services and $20 billion in new green investments; and investments to be a greater force for good planting 5 million trees. in the world. To ensure we’re making meaningful impact across multiple dimensions 2021 SUSTAINABILITY REPORT 4
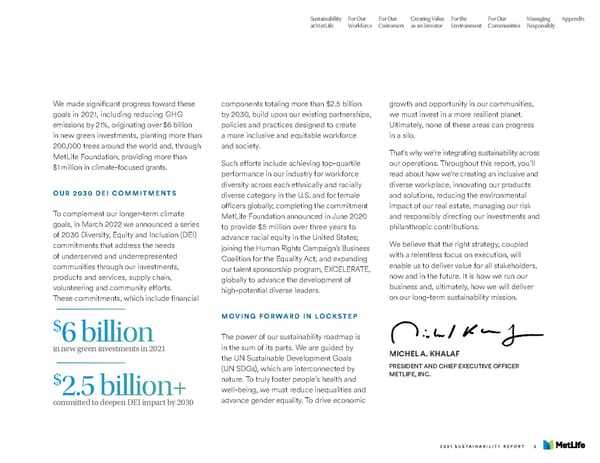
Sustainability For Our For Our Creating Value For the For Our Managing Appendix at MetLife Workforce Customers as an Investor Environment Communities Responsibly We made significant progress toward these components totaling more than $2.5 billion growth and opportunity in our communities, goals in 2021, including reducing GHG by 2030, build upon our existing partnerships, we must invest in a more resilient planet. emissions by 21%, originating over $6 billion policies and practices designed to create Ultimately, none of these areas can progress in new green investments, planting more than a more inclusive and equitable workforce in a silo. 200,000 trees around the world and, through and society. That’s why we’re integrating sustainability across MetLife Foundation, providing more than Such efforts include achieving top-quartile our operations. Throughout this report, you’ll $1 million in climate-focused grants. performance in our industry for workforce read about how we’re creating an inclusive and diversity across each ethnically and racially diverse workplace, innovating our products OUR 2030 DEI COMMITMENTS diverse category in the U.S. and for female and solutions, reducing the environmental officers globally; completing the commitment impact of our real estate, managing our risk To complement our longer-term climate MetLife Foundation announced in June 2020 and responsibly directing our investments and goals, in March 2022 we announced a series to provide $5 million over three years to philanthropic contributions. of 2030 Diversity, Equity and Inclusion (DEI) advance racial equity in the United States; commitments that address the needs joining the Human Rights Campaign’s Business We believe that the right strategy, coupled of underserved and underrepresented Coalition for the Equality Act; and expanding with a relentless focus on execution, will communities through our investments, our talent sponsorship program, EXCELERATE, enable us to deliver value for all stakeholders, products and services, supply chain, globally to advance the development of now and in the future. It is how we run our volunteering and community efforts. high-potential diverse leaders. business and, ultimately, how we will deliver These commitments, which include financial on our long-term sustainability mission. $ MOVING FORWARD IN LOCKSTEP 6 billion The power of our sustainability roadmap is in new green investments in 2021 in the sum of its parts. We are guided by MICHEL A. KHALAF the UN Sustainable Development Goals (UN SDGs), which are interconnected by PRESIDENT AND CHIEF EXECUTIVE OFFICER $ nature. To truly foster people’s health and METLIFE, INC. 2.5 billion+ well-being, we must reduce inequalities and committed to deepen DEI impact by 2030 advance gender equality. To drive economic 2021 SUSTAINABILITY REPORT 5
Sustainability For Our For Our Creating Value For the For Our Managing Appendix at MetLife Workforce Customers as an Investor Environment Communities Responsibly Sustainability at MetLife OUR APPROACH AND GOVERNANCE UN SDGs SUSTAINABILITY GOALS AND PROGRESS 2021 SUSTAINABILITY REPORT 6
Sustainability For Our For Our Creating Value For the For Our Managing Appendix at MetLife Workforce Customers as an Investor Environment Communities Responsibly Our Approach The Board oversees the assessment and management of various ESG matters, including Sustainability at MetLife means living our ESG risks, risks associated with the enterprise purpose—Always with you, building a more investment portfolio and policies concerning confident future—for the long term. We are climate change. MetLife’s management adapting to meet the needs of a rapidly provides regular updates to the full Board changing world and we are strengthening our and its committees on various ESG matters, commitment to address critical challenges including DEI, climate action, philanthropy, such as climate change, gender and racial responsible investments and regular updates inequity, and disadvantaged communities. on cybersecurity and privacy. The oversight of certain ESG matters falls within the Sustainability is central to our business responsibilities of various Board committees. strategy and directs every aspect of our ESG performance is reflected in aspects of operations. With the UN SDGs as our guide, executive officer performance assessments, we are deploying the full strength of our which impacts their total compensation. people, products, services and investments In addition to oversight by the Board to be a greater force for good in the world. It’s and its committees, MetLife has a robust what inspired us in the past, fuels our strategy management-level risk oversight structure. today and will set us apart in the future. MetLife’s leaders prioritize sustainability, and it is part of their annual performance objectives Governance through a shared sustainability goal for MetLife’s executive leadership team. In addition, all Monitoring and managing environmental, employees are responsible for living MetLife’s social and governance (ESG) issues, including purpose and driving progress toward MetLife’s those involving DEI, is fully integrated into all sustainability commitments. MetLife’s risk parts of MetLife’s operations and management. and control framework operates under a Recognizing the increased importance of ‘‘Three Lines of Defense’’ model where each ESG matters to both MetLife’s business and employee is responsible for risk management. stakeholders, MetLife's Board of Directors ESG risks, including climate risks, are within (Board) in 2021 enhanced its framework for the purview of multiple senior management oversight of ESG strategy and execution to committees, as they underpin all aspects of ensure that MetLife’s sustainability efforts are risk management at MetLife. coordinated across all parts of the enterprise. 2021 SUSTAINABILITY REPORT 7
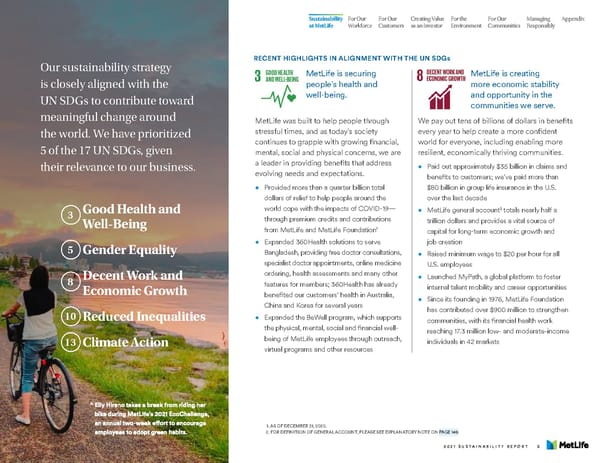
Sustainability For Our For Our Creating Value For the For Our Managing Appendix at MetLife Workforce Customers as an Investor Environment Communities Responsibly RECENT HIGHLIGHTS IN ALIGNMENT WITH THE UN SDGs Our sustainability strategy MetLife is securing MetLife is creating is closely aligned with the people’s health and more economic stability UN SDGs to contribute toward well-being. and opportunity in the communities we serve. meaningful change around MetLife was built to help people through We pay out tens of billions of dollars in benefits the world. We have prioritized stressful times, and as today’s society every year to help create a more confident 5 of the 17 UN SDGs, given continues to grapple with growing financial, world for everyone, including enabling more mental, social and physical concerns, we are resilient, economically thriving communities. their relevance to our business. a leader in providing benefits that address • Paid out approximately $35 billion in claims and evolving needs and expectations. benefits to customers; we’ve paid more than • Provided more than a quarter billion total $80 billion in group life insurance in the U.S. dollars of relief to help people around the over the last decade 3 G ood Health and world cope with the impacts of COVID-19— • MetLife general account2 totals nearly half a Well-Being through premium credits and contributions trillion dollars and provides a vital source of 1 from MetLife and MetLife Foundation capital for long-term economic growth and 5 Gender Equality • Expanded 360Health solutions to serve job creation Bangladesh, providing free doctor consultations, • Raised minimum wage to $20 per hour for all specialist doctor appointments, online medicine U.S. employees D ecent Work and ordering, health assessments and many other • Launched MyPath, a global platform to foster 8 Economic Growth features for members; 360Health has already internal talent mobility and career opportunities benefited our customers’ health in Australia, • Since its founding in 1976, MetLife Foundation China and Korea for several years has contributed over $900 million to strengthen 10 Reduced Inequalities • Expanded the BeWell program, which supports communities, with its financial health work the physical, mental, social and financial well- reaching 17.3 million low- and moderate-income 13 Climate Action being of MetLife employees through outreach, individuals in 42 markets virtual programs and other resources 1. AS OF DECEMBER 31, 2020. 2. FOR DEFINITION OF GENERAL ACCOUNT, PLEASE SEE EXPLANATORY NOTE ON PAGE 149. 2021 SUSTAINABILITY REPORT 8
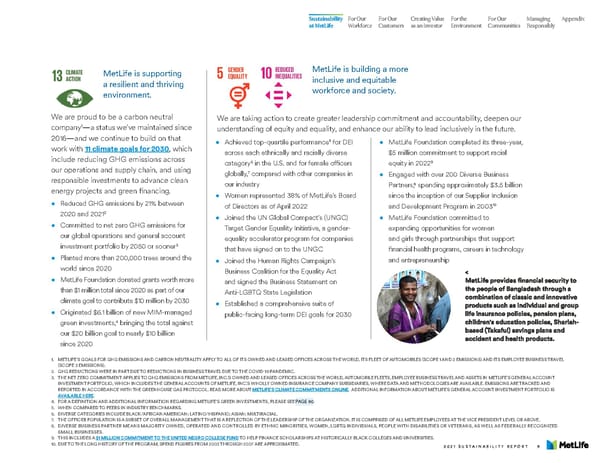
Sustainability For Our For Our Creating Value For the For Our Managing Appendix at MetLife Workforce Customers as an Investor Environment Communities Responsibly MetLife is supporting MetLife is building a more a resilient and thriving inclusive and equitable environment. workforce and society. We are proud to be a carbon neutral We are taking action to create greater leadership commitment and accountability, deepen our 1 company—a status we’ve maintained since understanding of equity and equality, and enhance our ability to lead inclusively in the future. 2016—and we continue to build on that 5 work with 11 climate goals for 2030, which • Achieved top-quartile performance for DEI • MetLife Foundation completed its three-year, include reducing GHG emissions across across each ethnically and racially diverse $5 million commitment to support racial 6 9 our operations and supply chain, and using category in the U.S. and for female officers equity in 2022 7 responsible investments to advance clean globally, compared with other companies in • Engaged with over 200 Diverse Business energy projects and green financing. our industry Partners,8 spending approximately $3.5 billion • Women represented 38% of MetLife’s Board since the inception of our Supplier Inclusion • Reduced GHG emissions by 21% between of Directors as of April 2022 and Development Program in 200310 2020 and 20212 • Joined the UN Global Compact’s (UNGC) • MetLife Foundation committed to • Committed to net zero GHG emissions for Target Gender Equality Initiative, a gender- expanding opportunities for women our global operations and general account equality accelerator program for companies and girls through partnerships that support investment portfolio by 2050 or sooner3 that have signed on to the UNGC financial health programs, careers in technology • Planted more than 200,000 trees around the • Joined the Human Rights Campaign’s and entrepreneurship world since 2020 Business Coalition for the Equality Act • MetLife Foundation donated grants worth more and signed the Business Statement on than $1 million total since 2020 as part of our Anti-LGBTQ State Legislation climate goal to contribute $10 million by 2030 • Established a comprehensive suite of • Originated $6.1 billion of new MIM-managed public-facing long-term DEI goals for 2030 4 green investments, bringing the total against our $20 billion goal to nearly $10 billion since 2020 1. METLIFE’S GOALS FOR GHG EMISSIONS AND CARBON NEUTRALITY APPLY TO ALL OF ITS OWNED AND LEASED OFFICES ACROSS THE WORLD, ITS FLEET OF AUTOMOBILES (SCOPE 1 AND 2 EMISSIONS) AND ITS EMPLOYEE BUSINESS TRAVEL (SCOPE 3 EMISSIONS). 2. GHG REDUCTIONS WERE IN PART DUE TO REDUCTIONS IN BUSINESS TRAVEL DUE TO THE COVID-19 PANDEMIC. 3. THE NET ZERO COMMITMENT APPLIES TO GHG EMISSIONS FROM METLIFE, INC.’S OWNED AND LEASED OFFICES ACROSS THE WORLD, AUTOMOBILE FLEETS, EMPLOYEE BUSINESS TRAVEL AND ASSETS IN METLIFE’S GENERAL ACCOUNT INVESTMENT PORTFOLIO, WHICH INCLUDES THE GENERAL ACCOUNTS OF METLIFE, INC.’S WHOLLY OWNED INSURANCE COMPANY SUBSIDIARIES, WHERE DATA AND METHODOLOGIES ARE AVAILABLE. EMISSIONS ARE TRACKED AND REPORTED IN ACCORDANCE WITH THE GREENHOUSE GAS PROTOCOL. READ MORE ABOUT METLIFE’S CLIMATE COMMITMENTS ONLINE. ADDITIONAL INFORMATION ABOUT METLIFE’S GENERAL ACCOUNT INVESTMENT PORTFOLIO IS AVAILABLE HERE. 4. FOR A DEFINITION AND ADDITIONAL INFORMATION REGARDING METLIFE’S GREEN INVESTMENTS, PLEASE SEE PAGE 90. 5. WHEN COMPARED TO PEERS IN INDUSTRY BENCHMARKS. 6. DIVERSE CATEGORIES INCLUDE BLACK/AFRICAN AMERICAN; LATINO/HISPANIC; ASIAN; MULTIRACIAL. 7. THE OFFICER POPULATION IS A SUBSET OF OVERALL MANAGEMENT THAT IS A REFLECTION OF THE LEADERSHIP OF THE ORGANIZATION. IT IS COMPRISED OF ALL METLIFE EMPLOYEES AT THE VICE PRESIDENT LEVEL OR ABOVE. 8. DIVERSE BUSINESS PARTNER MEANS MAJORITY OWNED, OPERATED AND CONTROLLED BY ETHNIC MINORITIES, WOMEN, LGBTQ INDIVIDUALS, PEOPLE WITH DISABILITIES OR VETERANS, AS WELL AS FEDERALLY RECOGNIZED SMALL BUSINESSES. 9. THIS INCLUDES A $1 MILLION COMMITMENT TO THE UNITED NEGRO COLLEGE FUND TO HELP FINANCE SCHOLARSHIPS AT HISTORICALLY BLACK COLLEGES AND UNIVERSITIES. 10. DUE TO THE LONG HISTORY OF THE PROGRAM, SPEND FIGURES FROM 2003 THROUGH 2007 ARE APPROXIMATED. 2021 SUSTAINABILITY REPORT 9
Sustainability For Our For Our Creating Value For the For Our Managing Appendix at MetLife Workforce Customers as an Investor Environment Communities Responsibly Our 2030 2030 Climate Goals Sustainability Commit $5 million to develop products and Engage and educate 50,000 stakeholders on 3 Commitments partnerships that drive climate solutions environmental stewardship annually N ew unit-linked funds launched; and More than 108,000 engaged or educated incorporated environmental content 1 MetLife’s 2030 climate goals were into Upwise™ MetLife Foundation committed to granting established in 2020, making 2021 the first $10 million to environmental causes year we are reporting progress against Originate $20 billion of new MIM-managed 2 More than $1 million total granted them. We recently announced 2030 DEI green investments from 2020 to 2030 since 2020 goals designed to address the needs of N early $10 billion originated in since the underserved and underrepresented 2020 or 50% of total goal Maintain carbon neutrality annually for our through our investments, products and global offices, fleet and business travel services, supply chain, volunteering Power all MIM-managed and -controlled real estate investments with 100% Achieved carbon neutrality again in 2021, and community efforts. We will report renewable electricity the sixth consecutive year of maintaining 4 progress against these goals in future this status sustainability reports. 25% achie ved as of year-end 2021 Achieve green or healthy building certification Originate $500 million of new MetLife for 40% of our global office portfolio impact investments, with 25% allocated to climate change priorities 43% achieved as of year-end 2021 Originated $77 million since 2020 with Plant 5 million trees prioritizing areas vulnerable $32 million, or more than 40%, allocated to natural disasters to climate change priorities Planted more than 200,000 trees since 2020 1. LEARN MORE ABOUT OUR CLIMATE GOALS. Reduce location-based GHG emissions 2. FOR A DEFINITION AND ADDITIONAL INFORMATION REGARDING by 30% from 2019 to 2030 Mobilize 100 suppliers to set a GHG emissions METLIFE’S GREEN INVESTMENTS, PLEASE SEE PAGE 90. reduction target by 2025 3. WE DEFINE “ENGAGE AND EDUCATE” TO INCLUDE ATTENDING AN IN-PERSON OR VIRTUAL METLIFE EVENT RELATED TO R educed GHG emissions by 21% ENVIRONMENTAL STEWARDSHIP, TAKING A MEASURABLE ACTION between 2020 and 2021 70 suppliers have set absolute targets AS A RESULT OF METLIFE’S COMMUNICATIONS OR PARTICIPATING reported through CDP in 2021 IN AN ACTIVITY THROUGH A NONPROFIT SPONSORED BY METLIFE. IT DOES NOT INCLUDE THE NUMBER OF COMMUNICATIONS SENT, VIEWS ON OUR WEBSITE OR IMPRESSIONS ON SOCIAL MEDIA. SOME STAKEHOLDERS MAY HAVE PARTICIPATED IN MORE THAN ONE ACTIVITY AND COULD BE DOUBLE COUNTED. 4. METLIFE’S GOALS FOR GHG EMISSIONS AND CARBON NEUTRALITY APPLY TO ALL OF ITS OWNED AND LEASED OFFICES ACROSS THE WORLD, ITS FLEET OF AUTOMOBILES (SCOPE 1 AND 2 EMISSIONS), AND ITS EMPLOYEE BUSINESS TRAVEL (SCOPE 3 EMISSIONS). 2021 SUSTAINABILITY REPORT 10
Sustainability For Our For Our Creating Value For the For Our Managing Appendix at MetLife Workforce Customers as an Investor Environment Communities Responsibly Investments Diverse Suppliers Originate $1 billion in investments that Reach $5 billion in spend advance firms owned with diverse suppliers by women, minorities and annually report the and disabled persons. economic impact. Workforce MetLife Diversity Foundation Funding Continue to advance workforce diversity by MetLife Foundation consistently achieving top has committed quartile positioning across $150 million in funding each ethnically and racially to support underserved diverse category in the U.S. 2030 DEI 1 and underrepresented and of female officers globally. Commitments communities. Enhance transparency of the link between top quartile Addressing the needs of the underserved positioning and executive and underrepresented through a mix of leadership performance. investments, products and services, supply chain, volunteering and community efforts. Volunteer Solutions Hours and Insights Commit 800,000 employee Provide solutions and volunteer hours with a insights to address the focus on DEI/underserved needs of the underserved. Research communities. Support research that advances understanding 1. LEARN MORE ABOUT OUR DEI GOALS. of DEI issues. 2021 SUSTAINABILITY REPORT 11
Sustainability For Our For Our Creating Value For the For Our Managing Appendix at MetLife Workforce Customers as an Investor Environment Communities Responsibly For Our Workforce OUR APPROACH AND GOVERNANCE HIGHLIGHTS CULTURE: TALENT, TRUST AND DIALOGUE GLOBAL DIVERSITY, EQUITY AND INCLUSION TALENT AND SKILL DEVELOPMENT HOLISTIC WELL-BEING 2021 SUSTAINABILITY REPORT 12
Sustainability For Our For Our Creating Value For the For Our Managing Appendix at MetLife Workforce Customers as an Investor Environment Communities Responsibly Our Approach Governance At MetLife, we not only look to develop It all starts with our talent PURPOSE, POTENTIAL leading human resources (HR) practices; AND PERFORMANCE we also believe in the contribution and Three profound statements capture the potential of everyone—that with opportunity, Our DEI commitments are story of what energizes our workforce, people soar. MetLife’s people are paramount. aligned to our purpose accelerates us forward and sustains As such, the Chief Human Resources our performance. Officer (CHRO) reports directly to the CEO and plays the critical role of driving • We are united through a shared purpose— MetLife’s human capital strategy along with We invest in development Always with you, building a more regularly consulting with and updating confident future. MetLife’s Board of Directors on our human • We are propelled by a bold commitment capital priorities. Those priorities include We recognize the great work of to establish a purpose-driven, inclusive talent access and mobility, culture, DEI, individuals, teams and each other culture that energizes employees to holistic well-being, total rewards and other make a difference. factors that impact the readiness of the organization to fuel future business needs. • We are empowered by the promise of We aim to create overarching our EVP, “All Together Possible.” conditions so individuals can When we live our purpose, manifest our personally flourish potential and deliver on our promises, meaningful performance follows. Our talent ecosystem—the policies, programs and initiatives—make a significant impact and drive MetLife and our people forward. Some are groundbreaking, some game- changing; all allow us to bring the right resources to our people, our customers and our communities at the right time. 2021 SUSTAINABILITY REPORT 13
HighlightsHighlights Sustainability For Our For Our Creating Value For the For Our Managing Appendix at MetLife Workforce Customers as an Investor Environment Communities Responsibly Reached 52% Established women within MetLife’s Developed our global 2030 global workforce, and maintained Future Work DEI goals and commitments benchmarked top quartile strategy in 2022 representation for ethnically and 1 2 racially diverse officers in the U.S. and female officers globally Launched Joined the Human Expanded our MyPath Rights Campaign’s sponsorship program, Business EXCELERATE, in the U.S., a talent marketplace Coalition for to foster internal talent globally to advance the mobility, learning and career the Equality development of high-potential development opportunities Act diverse leaders 1. DIVERSE CATEGORIES INCLUDE BLACK/AFRICAN AMERICAN; LATINO/HISPANIC; ASIAN; MULTIRACIAL. 2. THE OFFICER POPULATION IS A SUBSET OF OVERALL MANAGEMENT THAT IS A REFLECTION OF THE LEADERSHIP OF THE ORGANIZATION. IT IS COMPRISED OF ALL METLIFE EMPLOYEES AT THE VICE PRESIDENT LEVEL OR ABOVE. 2021 SUSTAINABILITY REPORT 14
Sustainability For Our For Our Creating Value For the For Our Managing Appendix at MetLife Workforce Customers as an Investor Environment Communities Responsibly Culture: Talent, Trust and Dialogue IT ALL STARTS WITH OUR TALENT We know that when our people grow, we grow as a company. That’s why we stand firmly behind every employee with support and development that meets their individual needs. We recognize that these needs are changing, and that is why we continually look at contemporary talent practices and how our ecosystem unleashes our ability to access and engage talented employees. TRUST STRENGTHENS WITH OPEN DIALOGUE, WHERE ALL VOICES MATTER The work of building our purpose-driven, inclusive culture starts with trust. Trust permits us, as a team, to be curious, forthcoming, open, imaginative, confident and inclusive. We accelerate building trust and open dialogue through: • Global networks where executive and senior leaders across the organization connect to further shape and align to the strategy, build capabilities and provide voice and feedback on how we operate, our culture and our future; • Let’s Talk Live! monthly, CEO-driven global town halls where information is shared with all employees, questions are asked and all are answered; and • MyVoice, MetLife’s powerful employee survey and listening program that amplifies the voice of our employees and informs action-oriented solutions. ALL IS POSSIBLE WHEN WE WORK TOGETHER Trust and open dialogue allow us to create a world where all is possible when we work together. At MetLife, we are driven by winning together through collaboration and aligned goals and objectives. Guided by empathy to treat one another with respect and care, we work to make positive differences in the lives of our customers and communities, all underpinned by embracing change to grow our business in the right way. 2021 SUSTAINABILITY REPORT 15
Sustainability For Our For Our Creating Value For the For Our Managing Appendix at MetLife Workforce Customers as an Investor Environment Communities Responsibly 1 2021 MYVOICE BY THE NUMBERS 83% 84% response rate of survey respondents answered favorably to “The work that I do at MetLife is meaningful to me.” ~93,000 comments; every single comment is 75% read and a feedback session is held with the CEO and CHRO of survey respondents answered favorably to “I believe meaningful action will be taken as a result of this survey.”—11 points 78% over benchmark of survey respondents answered favorably to “How happy are you working at MetLife?” 1. SEE APPENDIX FOR ADDITIONAL RELEVANT METRICS RELATED TO ATTRACTION AND RETENTION: HIRES AND TERMS, HIRE RATE AND TERMINATION RATE BY GENDER, ETHNICITY AND AGE. 2021 SUSTAINABILITY REPORT 16
Sustainability For Our For Our Creating Value For the For Our Managing Appendix at MetLife Workforce Customers as an Investor Environment Communities Responsibly Global Diversity, Equity and Inclusion OUR DEI COMMITMENTS ARE PUBLIC FACING AND STRATEGICALLY ALIGNED To consistently demonstrate our purpose We measure ourselves against best-in-class and EVP in action, we understand that a practices and are committed to maintaining core accelerator is our prioritization of DEI. top quartile performance across ethnic 1 $2.5+ In 2021, MetLife developed comprehensive and racial diversity in the U.S. and female 2 public-facing DEI commitments to achieve officers globally. Our workforce data, by 2030. Our broad set of commitments is EEO-1 reporting and senior recruiting billion designed to address the needs of the process provide more detail on our underserved and underrepresented through top-quartile achievements. a mix of investments, products and services, committed to supply chain, volunteering and community efforts. Each commitment is anchored to In the 2021 MyVoice survey Inclusion pursuing DEI our business strategy and informed by Index, 75% of respondents indicated the UN SDGs. The financial components they feel a sense of belonging at work commitments of these commitments total more than $2.5 billion by 2030. by 2030 The Hispanic Association of Corporate Responsibility (HACR) awarded MetLife the HACR Award for Corporate Inclusion for the 10th consecutive year 1. DIVERSE CATEGORIES INCLUDE BLACK/AFRICAN AMERICAN; LATINO/HISPANIC; ASIAN; MULTIRACIAL. 2. THE OFFICER POPULATION IS A SUBSET OF OVERALL MANAGEMENT THAT IS A REFLECTION OF THE LEADERSHIP OF THE ORGANIZATION. IT IS COMPRISED OF ALL METLIFE EMPLOYEES AT THE VICE PRESIDENT LEVEL OR ABOVE. 2021 SUSTAINABILITY REPORT 17
Sustainability For Our For Our Creating Value For the For Our Managing Appendix at MetLife Workforce Customers as an Investor Environment Communities Responsibly WE ARE STRUCTURED TO WE PROSPER WITH EXTERNAL • Our Inclusion Networks, nine employee-led ACCELERATE DEI PERFORMANCE PERSPECTIVE AND INCLUSIVE networks in support of families; gay, lesbian, GLOBALLY DIALOGUE bisexual, transgender and queer-plus (LGBTQ+); diverse abilities; veterans; multiculturalism; To continue our progress against our 2030 To provide contemporary actions that rising professionals; women; Black professionals commitments, we provide oversight through accelerate DEI performance, we look to and Pan Asian professionals. our Global DEI governance structure. This internal and external expertise to expand oversight helps maintain sustainability, our aptitude as well as to execute against • Inclusion Tuesdays, our monthly interactive accountability and transparency in the our commitments. DEI webinar series, features members of our critical areas of DEI performance. Global DEI Leadership Council and external We gain insights from: thought leaders. Topics include creating high- MetLife’s Global Chief Diversity, Equity performing teams; exploring faith, culture and and Inclusion Officer (CDO) reports directly • Our MetLife Global DEI Leadership Council, a heritage; building trust and connection; and to our CEO and CHRO, a reporting line 16-member senior leader group, chaired by our racial inclusion. To complement these webinars, that was introduced in 2021. This reporting CEO. The Council is charged with driving and we launched a new podcast series, Inclusion structure underscores DEI as a global business, executing DEI strategy across businesses, Begins with Me: Conversations that Matter. workforce and sustainability imperative and functions and regions; providing strategic broadens our ability to strategically shape a guidance and insight to improve performance; • ADVANCE, our external roundtable comprised global culture of inclusion. and promoting and championing DEI internally of experts in racial equity-related business and externally. Members were nominated disciplines, academia and philanthropy is because of their purpose-driven leadership designed to help MetLife continue advancing and commitment to achieving results. racial equity and inclusion. 2021 SUSTAINABILITY REPORT 18
Sustainability For Our For Our Creating Value For the For Our Managing Appendix at MetLife Workforce Customers as an Investor Environment Communities Responsibly CONTINUING PROGRESS 1 Champion Inclusion Learn. Lead. Empower. Cultivate an inclusive workplace culture with the right behaviors and actions. Strengthen Our Diversity Know. Grow. Keep. Increase representation and leverage, develop and grow current workforce diversity to innovate for the future. Grow Our Impact Listen. Serve. Advocate. > Make a difference as a leading company for diversity, equity and inclusion. 2021 SUSTAINABILITY REPORT 19
Sustainability For Our For Our Creating Value For the For Our Managing Appendix at MetLife Workforce Customers as an Investor Environment Communities Responsibly EVERY ONE OF US PARTICIPATES IN SHAPING OUR INCLUSIVE CULTURE WE ARE COMMITTED TO CLOSING THE GENDER EQUITY GAP From the use of MetLife’s voice externally in the Human Rights Campaign’s Business Coalition for the Equality Act and our signature on the Business Statement on Anti-LGBTQ State Legislation, We focus on five areas to advance gender to our Inclusion Begins with Me training and our EXCELERATE program, we believe that the equity—leadership, workforce, marketplace, power of inclusive culture comes from our collective and individual actions. community and sustainability. Through the Gender Equity Initiative, we support our • The Human Rights Campaign’s Business • EXCELERATE, MetLife’s CEO-driven talent commitment to the UN Women’s Empowerment Coalition for the Equality Act supports federal sponsorship program, focuses on accelerating Principles, UN SDGs and the UNGC’s gender legislation that would provide the same basic the progression of ethnic-, racial- and gender- equality accelerator program. protections to LGBTQ+ people that are provided diverse leaders. MetLife joined the UNGC “Target Gender to other groups protected under federal law. • The program serves underrepresented groups Equality” initiative, giving the company access • The Business Statement on Anti-LGBTQ across 27 countries and increases visibility, to facilitated performance analysis, capacity State Legislation reinforces our opposition access and engagement with MetLife’s building workshops, peer-to-peer learning and to legislation aimed at restricting access Executive Leadership Team. multistakeholder dialogue at the country level. and rights for LGBTQ+ people. We are also members of the Gender and • 22% of participants have new or expanded Diversity KPI Alliance and partner with • Inclusion Begins with Me, our blueprint to responsibilities or have been promoted WEConnect International, a global supplier champion inclusion, expands our understanding thus far. network that provides members with greater of ourselves and each other. This key resource is access to women-owned businesses. the foundation for all employees to learn the role we each play in shaping our culture: • 93% of our global employees have completed the Inclusion Begins with Me three-part series; • 86% of people leaders completed inclusive AT METLIFE, WOMEN MAKE UP leadership development; and 52% 25% 41% 50% • 16 teams globally participated in INDEAVOR, a six-month interactive experience where teams of our workforce of our Executive of our managers of our strategic apply inclusive behaviors and build habits that Leadership Team advisory group foster greater trust and collaboration. 2021 SUSTAINABILITY REPORT 20
Sustainability For Our For Our Creating Value For the For Our Managing Appendix at MetLife Workforce Customers as an Investor Environment Communities Responsibly Bloomberg named MetLife to its Gender-Equality Index for the seventh consecutive year in recognition of our efforts to support gender parity through employee policies, representation and transparency. In October, MetLife China received the 2021 China Women’s Empowerment Principles Leadership and Action Award from UN Women in honor of the organization’s exceptional efforts to advance DEI in the workplace and its support for fair employment and career development of women in the insurance industry. Nine types of networks across MetLife globally: • Families at MetLife (FAM) • Gay, Lesbian, Bisexual, Transgender and Allies at MetLife (GLAM) • MetLife Diverse Abilities (MDA) • Military Veterans Network at MetLife (MVET) • Multicultural Professionals Network (MPN) • Rising Professionals at MetLife (iRISE) > • Women’s Business Network (WBN) • Black Professionals Network (BPN) + Black Executive Leadership Forum • Pan Asian Professionals Network (PAPN)
Sustainability For Our For Our Creating Value For the For Our Managing Appendix at MetLife Workforce Customers as an Investor Environment Communities Responsibly Leading the Future Talent and Skill Development We are building a MetLife where every employee At MetLife, we access, curate and engage talented To realize the total potential of MetLife, we must has a positive, consistent employees, all with the potential to contribute their recognize the total potential of each person within and impactful leadership best in their own unique and purpose-driven way. our organization. We go beyond the conventional definition of high experience. potential—we believe in total potential. We aim to create a culture of continuous learning and work to ensure every employee has access to tools, resources and incentives for growth. In 2021, MyPath had nearly 5,000 users. WE BUILD SYSTEMS THAT ENABLE INTERNAL TALENT MOBILITY 1,125 were assigned When we support our employees through access to challenging opportunities and a choice of new experiences, new project roles, they venture to test their own potential, reach for the unfamiliar and seize new challenges. enabling them to learn new skills and Employees leverage our digitally enabled learning platform to continuously develop and build the core skills they gain exposure to need in a dynamic environment. MyPath, our internal talent marketplace, supports mobility by connecting employees additional parts of the to projects and opportunities based on their skills, experiences and ambitions. Employees can unleash their full organization. MyPath potential, and managers are able to source talent quickly based on the skills needed to get critical work done. also created 347 networking connections 2021 MYLEARNING BY THE NUMBERS and unlocked over 45,000 hours of capacity. 74% 638,960 724,845 1,817 of employees accessed learning materials viewed learning materials completed learners shared MyLearning, MetLife’s materials among peers online learning platform 2021 SUSTAINABILITY REPORT 22
Sustainability For Our For Our Creating Value For the For Our Managing Appendix at MetLife Workforce Customers as an Investor Environment Communities Responsibly In 2021, with a completion rate of at least WE INVEST IN THE WE REDEFINED EXCELLENCE 85%, over DEVELOPMENT OF LEADERS IN SALES FORCE TRAINING 90% At MetLife, we believe the greatest contribution Our award-winning approach for sales of participating leaders agreed we can make to our employees is excellent training is cost effective, transformative that the Leading the Future leadership. Our “Leading the Future” program and a driver of operational excellence. program was a worthwhile supports over 5,500 leaders through a variety Distribution Academy is a crucial investment of time of learning experiences. The program takes a strategic enabler that gives MetLife a complete approach to elevating our leadership competitive advantage. so everyone can bring out the best on their team A digital learning experience, Distribution and translate leadership theory into actions Academy, is used by global, regional that strengthen our business and culture. and local stakeholders to build sales It is also critical that our workforce is nimble force capability and grow MetLife’s and prepared for transitions. Our focus on distribution business. The Academy accelerating team formation and performance, helps sales agents build their skills and simple assessments for team leaders to knowledge when and where they need it. continuously measure and improve team The platform flexes with the training life- effectiveness, and coaching and feedback cycle, inclusive of virtual, local courses tools enables organizational agility. and role playing—all tailored to bring out Additionally, we recognize the importance of the best of our sales force so they can supporting leaders as they transition to new deliver the best for our customers. and expanded roles. Through our holistic programming for leader transitions, formal upward and stakeholder feedback, we build our leadership capacity, and we aim to build a MetLife where every employee has a positive, consistent and impactful leadership experience. Developing leaders for the future directly influences our ability to create a more confident future for our customers and shareholders. 2021 SUSTAINABILITY REPORT 23
Sustainability For Our For Our Creating Value For the For Our Managing Appendix In 2021, we recognized our at MetLife Workforce Customers as an Investor Environment Communities Responsibly employees through 1,747 Holistic Well-Being peer nominated awards—103 of those with a Purpose Award As we prepare our talent for the future and bring out their potential through inclusion and development, we aim to create conditions so the individual can personally flourish. We do this by celebrating value through recognition, demonstrating care through our relentless focus on health and wellness, and promoting stability through our benefits and compensation programs. WE RECOGNIZE THE GREAT • Purpose Award, an exclusive, selection-based WORK OF INDIVIDUALS, TEAMS award recognizing colleagues who went to AND EACH OTHER extraordinary efforts to bring MetLife’s purpose to life. When we recognize tremendous effort, uplift great accomplishments and express WE ENCOURAGE EMPLOYEES appreciation for daily contributions, we show TO PRIORITIZE HEALTH employees and all others that the impact of their work and what they accomplish on behalf We believe that a person’s potential and well- of our customers is valued and matters. being are inseparable. We prioritize the health We have three primary recognition programs and well-being of our employees and provide that honor our employees’ unwavering focus specific resources so they can do the same. In on our purpose, customer experiences, 2020 we launched BeWell, a global platform collaboration and experimentation: that provides resources to help employees with resilience and coping, staying balanced, • Continuous recognition, through MetLife's maintaining physical and financial well-being enhanced global recognition program, Center and building healthy relationships. Stage, allows colleagues to recognize each other anytime for anniversaries, milestones As the pandemic continued to take its toll on or successes; mental health in 2021, it became even more vital to support mental health and combat • Above and Beyond Award, in which every mental health stigmas. The BeWell program quarter we recognize colleagues for their intensified its focus to promote and reinforce collaboration, experimentation and customer- sustained healthy mental habits, such as > focused achievements; and mindfulness, sleep, exercise and practicing appreciation and gratitude. 2021 SUSTAINABILITY REPORT 24
Sustainability For Our For Our Creating Value For the For Our Managing Appendix at MetLife Workforce Customers as an Investor Environment Communities Responsibly We incorporated training on how to prioritize WE OPERATE WITHIN A TOTAL well-being into our Leading the Future COMPENSATION FRAMEWORK program for people leaders. Through Town Hall presentations and the voice of our CEO, MetLife’s Pay for Performance philosophy we sent a resounding message that we care promotes a culture where there is a direct link about the well-being of our employees, that between an employee’s compensation and the we share in a global experience and that we “what and how” of their performance, which understand the health, economic and social may include both individual contributions and challenges of recent times. team collaboration. We use a competitive total compensation framework that consists Our benefits prioritize holistic well-being, of base salary as well as annual and long-term encouraging and equipping all employees incentive opportunities. globally to sustain and improve their physical, mental, financial and social wellness. We Company-paid and company-subsidized offer competitive total compensation and healthcare, disability, life insurance and benefits to engage and motivate our talented retirement benefits are market-aligned, and employees. By designing these programs competitive paid time off and parental leave to enable our employees to build a more programs are provided in all markets. We also confident future, we live our purpose, look for ways our benefits can be sensitive to promote our business objectives, align the ever-changing ecosystem and help with management’s interests with those of our key challenges facing our employees. many stakeholders and underscore our We regularly review our compensation and focus on long-term shareholder value. benefits programs and consider business objectives and employee input, as well as market developments, when making updates. In the U.S., MetLife enhanced virtual total MetLife annually reviews our pay practices, wellness assistance by providing employees including compensation and benefits access to MetLife’s Upwise™ financial programs, to ensure we incent the right wellness app, virtual fitness classes, behaviors and provide equal pay for equal work. Our goal is to support, reward and > teleconsultation for caregiving support, a compensate the entire individual. Learn more tobacco cessation intervention program about our Gender Pay Equity Statement and and access to MetLife Legal Plan services. benefits program. 2021 SUSTAINABILITY REPORT 25
Sustainability For Our For Our Creating Value For the For Our Managing Appendix at MetLife Workforce Customers as an Investor Environment Communities Responsibly For Our Customers OUR APPROACH AND GOVERNANCE HIGHLIGHTS EMPOWERING UNDERSERVED COMMUNITIES SUPPORTING WELLNESS INTEGRATING CLIMATE ACTION DELIVERING FOR OUR CUSTOMERS— CUSTOMER SERVICE SHARING INSIGHTS THAT ADDRESS EMPLOYEE WELL-BEING > 2021 SUSTAINABILITY REPORT 26
Sustainability For Our For Our Creating Value For the For Our Managing Appendix at MetLife Workforce Customers as an Investor Environment Communities Responsibly Our Approach Governance A key facet of our purpose is giving MetLife’s go-to-market strategy is regional customers confidence. As society faces [U.S.; Latin America (LATAM); Europe, growing financial, mental, social and Middle East and Africa (EMEA); and Asia] physical concerns, we provide solutions and each regional head reports to the CEO. that meet diverse and evolving needs. We have internal guidelines in place for Increasingly, sustainability lies at the core of product development and marketing that those needs. To help customers fulfill their are designed to ensure compliance with purpose—and in turn to help us fulfill ours— all applicable local regulations, while also MetLife must innovate to embed ESG factors taking into account diversity of perspectives into our products and services, thereby and experiences, including compliance with ingraining sustainability in our business. This the Americans with Disabilities Act of 1990. can include: • Empowering underserved populations— Prioritizing improved access to and ease of use of our products that enhance lives; $ • Supporting wellness—Securing individuals’ 35 billion and families’ health and well-being; paid out to policyholders through claims and benefits in 2021 • Protecting the environment—Taking bold action on climate change to protect our customers’ futures; Over the course of 2021, COVID-19 claims totaled • Delivering for our customers—Providing $ dependable customer service and 2 billion globally information; and • Sharing insights that address employee well-being—Contributing research, information and insights on important societal issues. 2021 SUSTAINABILITY REPORT 27
Sustainability For Our For Our Creating Value For the For Our Managing Appendix Highlights at MetLife Workforce Customers as an Investor Environment Communities Responsibly Launched Cofounded the Launched Upwise™ Private 360Health Sector in Bangladesh in early 2022, a free mobile app that helps Alliance the fourth market to offer the consumers build positive insurance product and app financial habits and feel to promote financial designed to support lifelong good about their inclusion in Mexico 1 well-being progress Identified Offered one of the largest employee trends national preferred provider that are changing the organization dental networks to workplace through expand access our annual for diverse U.S. Employee populations Benefit Trends Study > 1. ALSO OFFERED IN AUSTRALIA, CHINA AND KOREA 2021 SUSTAINABILITY REPORT 28
Sustainability For Our For Our Creating Value For the For Our Managing Appendix at MetLife Workforce Customers as an Investor Environment Communities Responsibly Empowering Underserved Communities We are committed to providing targeted products to those who need them most by innovating inclusive solutions that recognize and address the historical biases that have resulted in financial inequities within underserved populations. DRIVING FINANCIAL WELLNESS Upwise™: lowering the temperature on financial stress MetLife’s Financial Wellness and Engagement group is responsible for powering long-term MetLife has introduced Upwise™, a free app solutions that bring financial wellness and that helps consumers build positive financial education to individuals while strengthening habits and feel good about their progress. our relationship with employers. The division Upwise™ is designed to connect consumers’ helps us address and design solutions for behaviors around common financial concerns financial health and wellness needs. This or emotional stresses like monthly budgeting, includes understanding the needs and paying off debt or long-term savings. The app financial behaviors of racially and ethnically begins by assessing the consumer’s emotions diverse communities (see Sharing Insights about money—we call it the Money Mood that Address Employee Well-Being). tool—and then works with individuals to make Learn more about our Financial Wellness managing their financial life more enjoyable and Engagement products. and rewarding. Understanding that some communities require different support, we have developed a strategy to create content within the app that supports the needs of diverse consumers. We have formed a content partnership with Yemi Rose, founder and CEO of the fintech OfColor—a platform established to improve the financial health of people of color—to incorporate its content in the app. We are adding content to 2021 SUSTAINABILITY REPORT 29
Sustainability For Our For Our Creating Value For the For Our Managing Appendix at MetLife Workforce Customers as an Investor Environment Communities Responsibly educate users on eco-friendly ways MetLife recently enhanced PlanSmart to In Korea, MetLife’s Mini Insurance products to manage their money, and we have better serve diverse customers. We created offer customers single-pay options that established an external advisory council a new workshop for the LGBTQ+ community provide one year of coverage for less than comprised of industry experts who that offers insight on marriage and family KRW 5,000 (~$4.25). We introduced Smart specialize in best practices for improving planning solutions, closing a retirement and Easy MetLife Mobile, an online platform financial health in underserved communities. savings gap, planning for long-term care that offers a simple purchase experience for and setting up an estate plan. six Mini Insurance products. MetLife Korea Upwise™ helps consumers prioritize financial hosted the “Donation with Mini Insurance” goals and suggests simple actions for them We also worked with several institutional campaign and donated KRW 10,000 for every to develop good financial habits, feel more customers to better use PlanSmart workshops mini insurance policy sold, where MetLife Korea optimistic about what their money can for their employees of color, while updating and MetLife Korea Foundation contributed do for them and free up the next dollar so other workshops to reflect comments KRW 5,000 each. In 2021, MetLife Korea sold they can spend it on what matters most. from our partners at OfColor. nearly 2,000 policies and donated a total of The app also engages consumers through KRW 20 million for the campaign. The donation personalized challenges that offer fun, Helping low-income customers went to Korea Society of Retired Fire Officers rewarding ways to help them achieve small manage finances with confidence to support medical treatment for retired fire wins that lead to big outcomes. officers fighting cancer. In India, PNB MetLife partnered with India ® Post Payments Bank (IPPB) to launch low-cost In the U.K., MetLife launched MortgageSafe, PlanSmart : offering tools to empower employees insurance. The government-backed product a policy that ensures mortgage repayments are provides a means of protection and financial covered when someone is unable to work due MetLife’s PlanSmart program is a multi- security to a large portion of low-income to accident or illness for four weeks or more. channel experience that focuses on behavioral and underserved customers—especially MortgageSafe offers three levels of protection, change, with tools and guidance that those in unbanked or remote areas. giving customers of all income levels an empower customers’ employees to build option to secure their most valuable asset. financial literacy, confidence and well-being. MetLife administers the PlanSmart program which includes broad transition solutions > from tools for individuals to financial education workshops provided by specially 1 trained third-party financial professionals. 1. THE FINANCIAL PROFESSIONALS PROVIDING FINANCIAL EDUCATION ARE NOT AFFILIATED WITH METLIFE BUT ARE PROVIDING THE PROGRAM UNDER A SERVICE PROVIDER CONTRACT. 2021 SUSTAINABILITY REPORT 30
Sustainability For Our For Our Creating Value For the For Our Managing Appendix at MetLife Workforce Customers as an Investor Environment Communities Responsibly MEXICO PRIVATE SECTOR Many of our products cater to low- and Better serving diverse groups ALLIANCE TO PROMOTE moderate-income families. These products FINANCIAL INCLUSION protect our customers against death, Several of MetLife’s products allow insured sickness or disability. individuals to easily connect with providers Along with our internal DEI focus, MetLife that share similar backgrounds, who look provides solutions to support diverse and like them and share their same language. Responding to an invitation from the accessible education and resources. We This is essential to helping everyone get UN Development Programme, MetLife start by doing our best to understand the the quality of care they deserve. Language Mexico co-founded the Private Sector diversity of our customers and then develop and communication disparities between and provide flexible and relevant solutions a patient and a network dental healthcare Alliance to Promote Financial Inclusion. provider, as one example, can result in The Alliance has focused on developing that recognize an individual’s specific needs. adverse health outcomes and treatment collaborative business models to Learn more about our products that serve errors. MetLife offers one of the largest expand financial health and inclusion diverse populations. national preferred provider organization for underserved customer segments. (PPO) dental networks featuring: Enhancing offerings for women • Enhanced benefits and outreach for higher- risk populations (e.g., people with diabetes The Alliance established four In line with MetLife’s focus on gender or hypertension); workstreams to provide access to equality, we are committed to meeting the • Health data connected to products, including and use of financial services: financial health needs of women, who are other employers’ non-MetLife offerings (e.g., 1. With a gender perspective; fast becoming key household earners. In across medical providers), to maximize usage 2. For small- and medium-sized EMEA, Women’s Protect covers cancer of all benefit opportunities; and enterprises; treatments, along with offering discounts on a variety of health and wellness benefits. • Robust health education and an integrated 3. For populations in rural areas; and MetaLife Mujer in Mexico and Seguro Vida dental and wellness program to promote oral 4. For financial resilience. Pensión 57 Mujer in Colombia offer special health and well-being. assistance for issues directly affecting women. 2021 SUSTAINABILITY REPORT 31
Sustainability For Our For Our Creating Value For the For Our Managing Appendix at MetLife Workforce Customers as an Investor Environment Communities Responsibly The wide-ranging, diverse network Making financial planning means that over 90% of members live more accessible within 10–15 miles of a network dentist, allowing us to meet the needs of a diverse In Mexico, we offer a flexible life insurance patient population. Where necessary, product called Met99, designed to make mobile dentistry capabilities and vendor financial planning more accessible to relationships can bring dental care to low- and moderate-income government employees. We also recruit all dentists employees. Customers can choose the with a network credentialing process that protection they need from more than includes providers’ cultural competencies. 20 benefits. Met99 enables individual MetLife is one of the only dental carriers policyholders and their economic certified for dental continuing education, dependents to have life and other kinds which includes health DEI training for of protection within the same policy. network dentists and non-network dentists. Multiple languages may be spoken within dental provider offices, and MetLife provides health history forms available in approximately 50 spoken languages. 2021 SUSTAINABILITY REPORT 32
Sustainability For Our For Our Creating Value For the For Our Managing Appendix at MetLife Workforce Customers as an Investor Environment Communities Responsibly Supporting Wellness Building a more confident future for customers means helping reduce stress during difficult times, particularly when the wellness of family is at stake. We constantly work on improving and evolving our products and services based on local market and customer needs. INITIATIVES TO ENCOURAGE COMPLETE HEALTH 360Health moments of critical health concerns. The working group promotes sustainability Each market has a market-leading digital through member companies’ products and Now available across four markets in the Asia- platform as well, through which customers services, as well as healthcare and wellness Pacific region, MetLife 360Health provides a can easily access the services offered. solutions for employees, customers, suppliers unique perspective on helping customers with Downloads of the 360Health app have and communities. solutions that address their mental, physical, crossed 100,000 in Bangladesh and 160,000 Five roundtables were held to discuss the financial and social health, alongside work in Korea. In China, around 620,000 role of the private sector in the health agenda factors, through a comprehensive focus on the customers can access the app on WeChat, and resilient health systems, government five key aspects of managing critical illnesses while more than 100,000 corporate perspectives regarding the contribution of to improve customers’ “healthspan”: customers in Australia have access to companies to UN SDG #3 and best practices 1. Prevention 360Health through the web portal and implemented by member companies. To learn 2. Early diagnosis the new mobile app, launched recently more about MetLife’s actions to support the 3. Access to treatment in partnership with Teladoc. 360Health’s UN SDGs, see pages 8–9. 4. Ongoing care innovative approach has consistently won 5. Financial protection awards in all four markets, with Bangladesh being the latest, adding the coveted 2022 Each market offers a range of value-added Bangladesh Innovation Award—Best services to deliver the holistic 360Health Innovation in Insurance. solution. These include free virtual doctor consultations; special discounts on diagnostic Good Health and Well-Being tests; preferential access to specialists; Working Group appointment booking with doctors and hospitals; health assessments using AI; MetLife Mexico leads the UNGC’s Good nutrition, exercise and mental health trackers; Health and Well-Being Working Group, an beauty and well-being benefits; and support initiative aligned with UN SDG #3—Good from dedicated care managers from early Health and Well-Being. 2021 SUSTAINABILITY REPORT 33
Sustainability For Our For Our Creating Value For the For Our Managing Appendix at MetLife Workforce Customers as an Investor Environment Communities Responsibly Integrating Climate Action MetLife’s products and services are an important component of our environmental stewardship and climate change strategy. Among our 11 climate goals is a commitment to invest $5 million to develop products and partnerships that drive climate solutions (see Driving Climate Solutions). PROTECTING THE ENVIRONMENT THROUGH OUR PRODUCTS, SERVICES AND OFFERINGS Tree planting Reducing paper and waste—going digital We are connecting climate to our products MetLife is reducing paper use by pivoting by tying tree-planting initiatives around the to digital customer communications. In Asia, world to customer engagement and sales. we have made substantial progress toward In Brazil, for example, employees planted enhancing digital services and delivering a seedling for each life insurance policy next-generation offerings and experience to MetLife sold through our partner Banco Itaú. our customers. Rolled out by MetLife Korea in The reforestation initiative took place at the 2021, MetLife One is a mobile platform where Jacarandás site, an area of Atlantic Forest customers can make payments, find information that has now been preserved in perpetuity and submit claims in a simple, seamless interface. as a Private Natural Heritage Reserve. Our MetLife One was designed to be scalable and team of employees planted 712 tree seedlings, modular, so countries can adopt features that including 70 different species typical of the match local business needs. region. (See Global Tree-Planting Initiatives In Japan, the provision of new digital content for for additional examples). Banca channel customers has replaced paper Learn more about how our products and booklets, and a new customer portal site has services contribute to our environmental replaced letters to customers. These actions stewardship and climate change strategy. have reduced paper use by 35%, and reduced CO2 emissions by an estimated 2,108 tons compared with fiscal year 2019. In addition, through strict management of orders for paper 2021 SUSTAINABILITY REPORT 34
Sustainability For Our For Our Creating Value For the For Our Managing Appendix at MetLife Workforce Customers as an Investor Environment Communities Responsibly booklets, MetLife Japan has realized a 19% reduction In Ukraine, new digital welcome packs and electronic in unused paper booklet waste in warehouse space, cards for customers have replaced plastic policy and which amounts to an estimated 84-ton reduction VIP cards, eliminating approximately 600 pounds in waste emissions, compared to 2020. of plastic and approximately 440 pounds of paper In EMEA, going paperless was selected as one of annually. We now source marketing collateral from three project ideas from almost 1,300 submissions a company that manufactures products with lower during our 2020 Next Horizon Experimentation impacts. In Italy, we’ve switched to using lower- Challenge, which encouraged employees to impact materials in employee and customer submit ideas to improve customer focus and merchandise, including desk calendars that are operational efficiencies. now made of 100% recycled paper. UNIT-LINKED INSURANCE PRODUCTS—SUSTAINABLE INVESTMENTS Under a unit-linked insurance plan, policyholders addition, 40 of these funds are “Article 8,” or make regular premium payments for insurance “a fund that promotes environmental or social coverage and as an investment. The plan then characteristics but does not have them as the offers a combination of insurance and investment overarching objective.” We also have unit- payouts. A unit-linked insurance plan can be used, linked products in Asia that offer sustainable for example, to provide life insurance, build wealth, investment opportunities for policyholders. In generate retirement income and pay for education. Malaysia, AmMetLife’s WealthEnrich, a limited In the Gulf, MetLife policyholders of these unit- premium Investment-Linked Insurance Plan, is linked insurance products can select from several tailor-made for high-net-worth individuals and investment funds that align with their financial goals. focuses on leaving a legacy for family members. Six of these funds are “Article 9” funds under In conjunction with the launch of this plan, we the European Union’s Sustainable Finance introduced the AmMetLife Positive Change Fund Disclosure Regulation (SFDR), or “a fund that with an investment strategy of investing primarily has sustainable investment as its objective.” In in companies whose products, behavior and services make a positive social impact. 2021 SUSTAINABILITY REPORT 35
Sustainability For Our For Our Creating Value For the For Our Managing Appendix at MetLife Workforce Customers as an Investor Environment Communities Responsibly Delivering for Our Customers—Customer Service MetLife supports our customers at the toughest times of their lives, so it’s imperative that we make it as easy as possible for them to access information about their policies when they need it most. INITIATIVES TO IMPROVE CUSTOMER SERVICE Transitioning to a single call center Responding to government in Colombia changes in Chile MetLife Colombia has transitioned to a Our pension fund administrator company single customer call center, eliminating ProVida offers advice on how to plan a the previous, less-efficient two-center financially healthy retirement to many model. We also introduced new tools and low- and moderate-income segments of applications to resolve issues quicker and the Chilean population. The administrator help improve the customer experience. provides financial inclusion programs aimed These included: at women, giving them tools to contribute to their pensions and grow at work. • Interactive Voice Response—customers are identified with their ID and directed to a In an effort to soften the economic fallout specialized representative; and of the pandemic, the Chilean government • Specialization of call center representatives authorized emergency pension fund by line of business and skills. withdrawals of 10% on three occasions. Regulatory changes also allowed retirees to gain access to anticipated payments from their annuities. Pension Fund Administrators J.D. Power recognized MetLife’s Retirement were given a short time frame to comply & Income Solutions—Customer Solutions and respond to strong customer demand. Center team for providing “An Outstanding Nonetheless, we fulfilled our obligations and Customer Service Experience” for phone helped provide financial security to many support. This was the third consecutive year Chileans in a time of need. the team was recognized. 2021 SUSTAINABILITY REPORT 36
Sustainability For Our For Our Creating Value For the For Our Managing Appendix at MetLife Workforce Customers as an Investor Environment Communities Responsibly 91% First Call Resolution Purpose-led sales challenge in EMEA In EMEA, MetLife launched the “League of Protection Superheroes,” a purpose-led MetLife Colombia’s new call center challenge in which teams from each of our has resulted in more personalized EMEA markets presented their initiatives attention for customers and helped pertaining to sustainability, corporate social to achieve First Call Resolution1 of responsibility, DEI and wellness to a panel of judges composed of MetLife executives. 91% and increase our Net Promoter Every two months, for 10 months, markets Score to 67% in 2021. competed head-to-head as the judges scored their presentations and initiatives based on creativity, impact and strategic alignment. 1. FIRST CALL RESOLUTION IS A METRIC THAT MEASURES A CALL CENTER’S PERFORMANCE FOR RESOLVING CUSTOMER INTERACTIONS ON THE FIRST CALL OR CONTACT, ELIMINATING THE NEED FOR FOLLOW-UP CONTACTS. 2021 SUSTAINABILITY REPORT 37
Sustainability For Our For Our Creating Value For the For Our Managing Appendix at MetLife Workforce Customers as an Investor Environment Communities Responsibly Sharing Insights that Address Employee Well-Being Building employee resilience Financial health has been a top MetLife undertakes numerous research studies to concern for employees during help us and our stakeholders better understand the COVID-19 pandemic. important workforce dynamics and industry trends. For more information about our studies, please visit our website. Strengthening our understanding of the U.S. workforce through thought leadership MetLife’s 19th annual U.S. Employee Benefit Trends Study (EBTS) identified several trends that are changing the workforce. For example, employees expect their employers to help protect and enable their well-being. Employers that create a holistic work culture that addresses changing priorities in safety, mental health and more will succeed in fostering a more resilient, productive and healthy workforce. 2021 SUSTAINABILITY REPORT 38
Sustainability For Our For Our Creating Value For the For Our Managing Appendix at MetLife Workforce Customers as an Investor Environment Communities Responsibly 2021 STUDIES Millennials poised for major life changes expect help from employers MetLife’s 2021 Open Enrollment Study found that millennials were more likely than others to say the pandemic has had a significant impact on their major life plans. Yet, as millennial employees prepare for new life stages, more than half also said they’re anxious about the state of their personal finances, compared with 45% of Over employees overall. 50% Millennial managers sacrifice their well-being for employees of millennial employees are The Squeezed Middle study conducted anxious about the state of their by MetLife found that 52% of employees with supportive millennial managers said they personal finances1 are healthy across physical, financial, social and mental health pillars. But although millennial managers foster strong employee performance, they’re sacrificing their own well-being—they now feel more overwhelmed, burnt out and stressed while working compared to December 2020. 1. METLIFE 2021 OPEN ENROLLMENT STUDY. 2021 SUSTAINABILITY REPORT 39
Sustainability For Our For Our Creating Value For the For Our Managing Appendix at MetLife Workforce Customers as an Investor Environment Communities Responsibly Creating Value as an Investor OUR APPROACH AND GOVERNANCE HIGHLIGHTS METLIFE GENERAL ACCOUNT INVESTMENT PORTFOLIO METLIFE INVESTMENT MANAGEMENT RESPONSIBLE INVESTMENTS >
Sustainability For Our For Our Creating Value For the For Our Managing Appendix at MetLife Workforce Customers as an Investor Environment Communities Responsibly Our Approach MetLife’s commitment to helping people MetLife and MIM maintain policies and enjoy rich, rewarding lives is fulfilled by all brochures that guide and communicate our areas of our business, including where and ESG integration efforts within our investment how we invest through our institutional processes, including: investment management business, MIM. 1 MIM-managed investments include MetLife General Account 1 Exclusionary Investments MetLife’s general account portfolio, as well Screens and Divestment Policy as investments made on behalf of MIM’s unaffiliated institutional client portfolios. MIM ESG Investment Policy We believe ESG factors can have an impact MIM Engagement Policy on investment performance and are important considerations to effectively manage risk and MIM Public Fixed Income ESG achieve our clients’ investment objectives, Integration brochure including MetLife’s. MIM aims to deliver MIM Private Capital Sustainable strong and sustainable risk-adjusted returns Investing brochure for our investors by building tailored portfolio solutions, appropriately integrating ESG MIM Commercial Mortgage Lending criteria into our investment decision-making Supplemental ESG Investment Policy processes and collaborating constantly. MIM Real Estate Equity ESG Investment Policy 1. PLEASE SEE APPENDIX, PAGE 149 FOR A DEFINITION OF GENERAL ACCOUNT. 2021 SUSTAINABILITY REPORT 41
Sustainability For Our For Our Creating Value For the For Our Managing Appendix at MetLife Workforce Customers as an Investor Environment Communities Responsibly Governance MIM ASSETS UNDER MANAGEMENT Reporting to our CEO, MetLife’s Chief MIM’s combined AUM helps finance job creation, business growth and community Investment Officer also serves as MIM’s development around the world. President and oversees ESG integration efforts for all investments, including those managed by MIM. ESG and sustainability- $ 1, 2 Total AUM as of year-end 2021, related investment initiatives are reported to 669 billion publicly reported as follows: the Governance and Corporate Responsibility Committee of the Board at least annually. MIM’s Sustainable Investment Strategies 3 $ 2 MetLife General Account AUM (SIS) team provides leadership, advises 488 billion internal functions on ESG-related matters and is responsible for the development, implementation and oversight of MIM’s sustainable investment strategy. MIM’s ESG Integration Council, chaired by the head of $ 2 Unaffiliated Institutional Client SIS, includes cross functional representation 181 billion AUM managed by MIM on behalf of from MIM’s asset sector teams and support our unaffiliated institutional clients. functions to ensure consistent communication These assets are not included in and application of ESG investment practices MetLife’s consolidated financial and policies, as well as best practices, statements. knowledge and expertise related to ESG integration activities and emerging risks and opportunities. In addition, as part of our core business practices, we maintain ongoing dialogue to raise awareness of sustainable business practices and prioritize active engagement with our investee company leadership as a key strategy to managing investment risk. 1. PLEASE SEE MIM TOTAL AUM FACTSHEET AS OF 12/31/21 FOR MORE DETAILS. 2. AS OF DECEMBER 31, 2021. AT ESTIMATED FAIR VALUE. SEE EXPLANATORY NOTE ON PAGE 149. 3. FOR A DEFINITION OF GENERAL ACCOUNT, PLEASE SEE EXPLANATORY NOTE ON PAGE 149. 2021 SUSTAINABILITY REPORT 42
Highlights Sustainability For Our For Our Creating Value For the For Our Managing Appendix at MetLife Workforce Customers as an Investor Environment Communities Responsibly $65 $ Over million 82 billion of new impact investments,2 in responsible investments1 reaching $77 million of our $500 million goal, with over 40% to climate change priorities3 $ Over 25% 6 billion of real estate investments4 of new green annual investments,3 bringing total progress toward powered with renewable 3 electricity (goal to have our $20 billion goal 100% by 2030) to nearly $10 billion > 1. REPRESENTS ASSETS MANAGED BY MIM AT ESTIMATED FAIR VALUE AS OF DECEMBER 31, 2021. FOR DEFINITIONS OF RESPONSIBLE INVESTMENTS, IMPACT INVESTMENTS AND GREEN INVESTMENTS, PLEASE SEE PAGES 90–91. 2. ANNUAL INVESTMENTS IN 2021. 3. METLIFE’S 2030 CLIMATE GOAL TO ALLOCATE 25% OF IMPACT INVESTMENTS TO CLIMATE CHANGE PRIORITIES BETWEEN 2020 AND 2030. PLEASE SEE PAGE 10 FOR MORE INFORMATION. 4. REPRESENTS PERCENTAGE OF MIM-MANAGED AND -CONTROLLED REAL ESTATE INVESTMENTS AS OF 12/31/21. 2021 SUSTAINABILITY REPORT 43
Sustainability For Our For Our Creating Value For the For Our Managing Appendix at MetLife Workforce Customers as an Investor Environment Communities Responsibly 1 MetLife General Account Investment Portfolio MetLife maintains a well-diversified investment portfolio and applies prudent risk management to secure long-term returns in accordance with MetLife’s ESG Investment Policy. MetLife is building a foundation for a less carbon-intensive and more socially responsible general account portfolio through our investment strategy. MetLife has a commitment to energy transition initiatives that drive environmental sustainability and decarbonization. To harness the power of our influence as a leading insurance and financial services firm, we have set goals to help transition to a zero-carbon economy and more sustainable future. In 2022, MetLife, Inc. made the commitment to take the company’s carbon neutrality commitment a step further by targeting net zero emissions for global operations and its general 2 account investment portfolio by 2050 or sooner. EXCLUSIONARY INVESTMENT SCREENS MetLife has applied exclusionary investment screens for our general account, which have been implemented to avoid investment in companies doing business in certain industries or business lines that are not in alignment with our core values, including: • Manufacturers of automatic and • Tobacco, vaping and e-cigarette manufacturers; semiautomatic assault weapons intended • Mining and/or utility companies deriving for sale to civilian customers; 25% or more of their revenue from thermal • Direct producers of controversial weapons, coal; and including cluster munitions, landmines, and • Companies that hold at least 20% of their oil biological and chemical weapons; reserves in oil sands. 1. FOR A DEFINITION OF GENERAL ACCOUNT, PLEASE SEE EXPLANATORY NOTE ON PAGE 149. 2. THE NET ZERO COMMITMENT APPLIES TO GHG EMISSIONS FROM METLIFE, INC.’S OWNED AND LEASED OFFICES ACROSS THE WORLD, AUTOMOBILE FLEETS, EMPLOYEE BUSINESS TRAVEL AND ASSETS IN METLIFE’S GENERAL ACCOUNT INVESTMENT PORTFOLIO, WHICH INCLUDES THE GENERAL ACCOUNTS OF METLIFE, INC.’S WHOLLY OWNED INSURANCE COMPANY SUBSIDIARIES, WHERE DATA AND METHODOLOGIES ARE AVAILABLE. EMISSIONS ARE TRACKED AND REPORTED IN ACCORDANCE WITH THE GREENHOUSE GAS PROTOCOL. READ MORE ABOUT METLIFE’S CLIMATE COMMITMENTS ONLINE. ADDITIONAL INFORMATION ABOUT METLIFE’S GENERAL ACCOUNT INVESTMENT PORTFOLIO IS AVAILABLE HERE. 2021 SUSTAINABILITY REPORT 44
Sustainability For Our For Our Creating Value For the For Our Managing Appendix at MetLife Workforce Customers as an Investor Environment Communities Responsibly Metropolitan Life Insurance Company issued its first green funding agreement in 2020 with the aim of ultimately allocating the net proceeds to renewable energy projects, green buildings or other eligible SUSTAINABLE FINANCING EMERGING RISKS, OPPORTUNITIES green assets under the MetLife Sustainable FRAMEWORK AND RELATED AND REGULATION Financing Framework. In 2021, funds were ISSUANCES allocated as follows:1 Around the world, regulations are emerging MetLife’s Sustainable Financing Framework that require companies to report their climate Environmentally Sustainable facilitates alignment of MetLife’s business risks. Compliance with the European Union 46% Management of Living Natural and investment activities to support and Sustainable Finance Disclosure Regulation Resources and Land Use drive a more sustainable future by offering is a priority for MIM, and we are preparing a framework for issuances of green, social for these efforts. MetLife stays up to date and sustainable bonds, term loans, preferred on policy trends and evolving regulatory stock, subordinated notes and funding requirements, globally, through internal 30% Green Buildings agreements. See Managing Responsibly for and external resources, engagement and more information. our global Climate Advisory Council. See Managing Climate Risks for more information. 24% Renewable Energy In 2021, MetLife became the first U.S. insurer to include multiple veteran, women, and ethnically and racially diverse-owned boutique investment banking firms in successfully issuing a $500 million Funding Agreement-Backed Note. The transaction was led by Funded assets included wind and MIM’s Capital Markets Group. This represents the first time diverse-owned firms were solar projects in the U.S. and Mexico, engaged in more senior, higher-profile roles on a transaction of this type. LEED-certified buildings in the U.S. and sustainably managed forestry and climate 2 smart farm assets in Peru and the U.S. 1. NUMBERS ARE ROUNDED. 2. F OR MORE DETAILS ON THE INAUGURAL GREEN FUNDING AGREEMENT, SEE THE 2021 METLIFE SUSTAINABLE FINANCING REPORT. 2021 SUSTAINABILITY REPORT 45
Sustainability For Our For Our Creating Value For the For Our Managing Appendix at MetLife Workforce Customers as an Investor Environment Communities Responsibly MetLife Investment Management ESG INTEGRATION As ESG integration efforts in our industry evolve, so too will MIM’s approach. We seek MIM serves institutional investors by to review and refresh our ESG Investment combining a client-centric approach with Policy at least annually. We work closely long-established asset class expertise. MIM with our clients to provide transparency to believes in the importance of investing our approach and adapt it, as needed, to sustainably and incorporating ESG factors, meet our clients’ guidelines. as appropriate, into investment decision MetLife Bangladesh was the sole investor making. As a well-established global ACTIVE ENGAGEMENT in a landmark transaction for the financial investment manager, our investment sector in Bangladesh—the first domestic teams are responsible for appropriately MIM believes active engagement with incorporating financially material ESG company and issuer leadership is key to bond backed by a development finance factors into their risk management-focused institution and subscribed to by an investment process. Focused on managing managing investment risk. Investment institutional investor. The BDT210 crore public fixed income, private capital and real analysts regularly interact and engage estate assets, we aim to deliver strong, in discussions with a firm’s senior (~$25 million) in proceeds were applied by management. Ongoing dialogue helps raise Pran Agro Limited to local infrastructure risk-adjusted returns by building tailored awareness of sustainable business practices. expansion, supporting the creation of new portfolio solutions that successfully Further details supporting our active jobs and new opportunities for farmers. integrate client-specified ESG investment engagement practices can be found within considerations today and beyond. MIM’s Engagement Policy. > 2021 SUSTAINABILITY REPORT 46
Sustainability For Our For Our Creating Value For the For Our Managing Appendix at MetLife Workforce Customers as an Investor Environment Communities Responsibly 1 PUBLIC FIXED INCOME Active engagement tracking impacting their business. Our proprietary and reporting Engagement Database is designed to be fully integrated into the research process incidents of active MIM’s public fixed income and private and to allow each analyst to log and update 564 engagement: capital teams have recently developed engagement on ESG factors. The database in-house solutions to tag, track and report includes deals that have been rejected due on our active engagement conversations. to a negative evaluation of these factors. Our engagement conversations are guided by the Sustainable Accounting Standards Private capital related to Board (SASB) materiality mapping framework, 366 environmental issues which identifies relevant industry-specific MIM’s private capital team sees active ESG risks and opportunities for discussion engagement with investee companies and with our investee companies. Notably, projects as key to both its initial underwriting 99 related to MIM’s Real Estate Debt and Agricultural process and ongoing portfolio management. social issues Lending teams have developed in-house When considering a potential investment solutions to collect ESG-related data from opportunity, our credit analysts meet directly borrowers at the time of loan origination. with the company’s senior management related to This data is also categorized in alignment team to understand the sustainability of 99 governance issues with SASB’s framework. the company’s business model as well as management’s philosophy and how ESG Public fixed income risks are managed. Beginning with the initial due diligence If adverse findings are identified, we process and as part of the ongoing may pursue appropriate measures, which monitoring process, analysts engage in could include corrective action by the ongoing dialogue with senior leadership issuer, requirement of improved terms to assess their business model resilience and conditions or not proceeding with and responsiveness to the ESG factors a transaction. 1. MIM PUBLIC FIXED INCOME ESG-RELATED ACTIVE ENGAGEMENT CONVERSATIONS CONDUCTED IN 2021. 2021 SUSTAINABILITY REPORT 47
Sustainability For Our For Our Creating Value For the For Our Managing Appendix at MetLife Workforce Customers as an Investor Environment Communities Responsibly ESG INTEGRATION IN REAL ESTATE MIM has been involved in real estate since 1878, and today provides debt and equity origination and asset management capabilities across offices in the U.S. and international markets, including the U.K., Japan, Korea, Chile and Mexico. MIM embraces our role as a responsible real estate investment manager and lender. We understand the impact buildings have on people, communities and the environment. We also know that issues such as climate change, regulatory environments and building operational efficiencies will increasingly impact lending decisions and financial performance. 25% Real estate equity Real estate debt—commercial mortgage lending MIM offers investors strategies that seek to 1 of all investments were powered with achieve income growth and capital appreciation Our commercial mortgage loan business renewable electricity as of year-end by investing in competitively positioned properties has a focus on office buildings, retail centers, 2021, and a power-procurement in markets with favorable demand drivers. apartment complexes, industrial properties strategy was put in place to increase Multiple MIM equity portfolios have achieved and hotels. For example, MIM originated a green power procurement. 5-Star status and been designated as “Sector $180 million commercial mortgage loan on Leaders” over the past two years in the Global Heron Water Street, a newly built LEED Gold apartment building in downtown Tampa, 2 Real Estate Sustainability Benchmark (GRESB). 3 Florida, in the heart of the world’s first WELL pre-certified neighborhood, Water Street Tampa, which envisions a sustainable and environmentally friendly community. The property includes smart thermostats, WaterSense plumbing fixtures, solar shades, Energy Star appliances, electric vehicle charging stations and a bike storage and repair room. 1. MIM SURVEYED TENANTS TO ASSESS THEIR INTEREST IN PARTICIPATING IN THE ENERGY STAR TENANT SPACE RECOGNITION PROGRAM. REPRESENTS PERCENTAGE OF SUCH MIM-MANAGED AND -CONTROLLED REAL ESTATE INVESTMENTS. 2. GRESB ISSUES AN ANNUAL ASSESSMENT BENCHMARKING PROPERTIES’ PERFORMANCE IN ACHIEVING ESG GOALS AND COMPARES EACH SECTOR’S PROGRESS IN ACHIEVING GLOBAL SUSTAINABILITY STANDARDS. THE TOP 20% WITHIN EACH SECTOR OF THE BENCHMARK RECEIVES THE FIVE-STAR RATING. 3. LEARN MORE ABOUT THE WELL COMMUNITY STANDARD. 2021 SUSTAINABILITY REPORT 48
Sustainability For Our For Our Creating Value For the For Our Managing Appendix at MetLife Workforce Customers as an Investor Environment Communities Responsibly ESG INTEGRATION IN AGRICULTURAL LENDING MIM’s Agricultural Finance Group clients provide long-term debt capital for farmers, ranchers, agribusinesses, forest products MetLife is not only identifying opportunities facilities and timberland owners, and we to plant 5 million trees as part of our broader are proud of our role in building resilient 2030 climate goals, we also facilitate communities and supporting sustainable transactions that have financial returns agriculture for more than a century. complemented by ESG outcomes. Although these financial transactions do not contribute ESG INTEGRATION IN to our goal count of 5 million trees, they help PRIVATE EQUITY promote sustainable forest ecosystems in many different ways. MIM’s Next Horizon Manager program is an initiative to support diverse emerging talent. MIM provided financing for a $625 million The program helps female and/or ethnically timberland transaction, consisting of long-term, and racially diverse-owned firms, with a focus first mortgage loans secured by approximately on newer firms that target 50% ownership by 832,000 acres of timberland and timber across females and/or professionals of color, who are looking to raise a fund of $500 million or the Southeastern United States. The financing less. MIM’s Next Horizon Manager program allows Tamarack Timberlands, LLC, which launched with a $50 million annual deployment is owned by Ontario Teachers’ Pension Plan target. MIM has engaged with more than and whose assets are managed by Resource 100 diverse managers and invested with five Management Service, LLC, to complete this of them, for a total of $50 million on behalf of multimillion-dollar redemption transaction 1 MetLife’s general account investment portfolio. and assume direct ownership of its timberland assets in the U.S. South. The approach supports the protection of biodiversity, water and soil resources while contributing to climate change mitigation. 1. FOR A DEFINITION OF GENERAL ACCOUNT, PLEASE SEE EXPLANATORY NOTE ON PAGE 149. 2021 SUSTAINABILITY REPORT 49
Sustainability For Our For Our Creating Value For the For Our Managing Appendix at MetLife Workforce Customers as an Investor Environment Communities Responsibly Responsible Investments Under Management 1 Responsible Investments IN MILLIONS TOTAL = $82,886 MetLife is committed to delivering long- 2030 CLIMATE GOALS Green Investments term value for all our stakeholders as we $34,319 navigate a time of unprecedented change Responsible together. MIM has a long history of $ Infrastructure responsible investment asset origination and 20 billion Investments Under $28,171 5 sourcing capabilities. We define responsible originated in new green investments Management Municipal Bonds investments as those that achieve both a IN MILLIONS $17,200 market financial return and promote social and/or environmental benefits. Affordable Housing $ $2,914 MIM sources responsible investments 500 million Impact Investments for MetLife’s general account and our originated in new MetLife impact $282 unaffiliated institutional client portfolios, investments, with 25% allocated to focused on the following core areas: climate change priorities IN MILLIONS 2 TOTAL = $13,713 • Green Investments Green Investments • Infrastructure 100% $6,085 3 • Municipal Bonds Annual Infrastructure renewable electricity powering all 6 $2,993 • Affordable Housing MIM-managed and -controlled real Investments estate investments IN MILLIONS Municipal Bonds 4 • Impact Investments $4,343 Affordable Housing $227 Impact Investments $65 1. MIM MAY PERIODICALLY REFINE OR OTHERWISE MODIFY ITS DEFINITION OF RESPONSIBLE INVESTMENTS AND THE COMPONENTS THEREOF BASED ON DATA AVAILABILITY OR OTHER FACTORS. 2. MIM CURRENTLY DEFINES GREEN INVESTMENTS TO INCLUDE 1) LEED, ENERGY STAR, BREEAM AND/OR FITWEL CERTIFIED REAL ESTATE EQUITY INVESTMENTS; 2) COMMERCIAL MORTGAGE LOANS SECURED BY LEED AND/OR ENERGY STAR CERTIFIED REAL ESTATE; 3) RENEWABLE ENERGY PROJECTS, INCLUDING WIND AND SOLAR; 4) ENERGY SAVINGS PERFORMANCE CONTRACTS (ESPCs); 5) PUBLIC AND PRIVATE CORPORATE GREEN BONDS; AND 6) PROPERTY ASSESSED CLEAN ENERGY (PACE) RESIDENTIAL AND COMMERCIAL LOANS. 3. MUNICIPAL BONDS INCLUDE TAXABLE AND TAX-EXEMPT REVENUE BONDS AND, TO A MUCH LESSER EXTENT, GENERAL OBLIGATIONS OF STATES, MUNICIPALITIES AND POLITICAL SUBDIVISIONS. 4. IMP ACT INVESTMENTS ARE INVESTMENTS MADE WITH THE INTENTION TO GENERATE POSITIVE, MEASURABLE SOCIAL AND ENVIRONMENTAL IMPACT ALONGSIDE A FINANCIAL RETURN (GIIN–GLOBAL IMPACT INVESTMENT NETWORK–DEFINITION). THIS ACTIVITY INCLUDES METLIFE’S GENERAL ACCOUNT AND A SMALLER VOLUME OF METLIFE FOUNDATION ASSETS. 5. REPRESENTS ASSETS MANAGED BY MIM AT ESTIMATED FAIR VALUE AS OF DECEMBER 31, 2021. 6. 2021 MIM-MANAGED RESPONSIBLE INVESTMENTS. 2021 SUSTAINABILITY REPORT 50
Sustainability For Our For Our Creating Value For the For Our Managing Appendix at MetLife Workforce Customers as an Investor Environment Communities Responsibly GREEN INVESTMENTS The Port of Rotterdam is one of the largest ports in 1 2 MIM sources investments in companies Europe and the 10th largest globally by volumes and projects that are focused on the traded. The Port of Rotterdam Authority manages conservation of natural resources, the and operates the port and is publicly owned by the production and discovery of alternative Dutch Government (29.2%) and by the Municipality energy sources, the implementation of of Rotterdam (70.8%) as a long-term, strategic clean air and water projects, and other environmentally conscious business investment. As a major local employer with an practices. Learn more about our green increasing focus on low carbon energy transition, investments, including our nearly the 2021 MIM-originated and -managed investment $200 million public-private partnership will contribute to building a sustainable port and for flood resilience in the U.S. (structured by industry. The Port of Rotterdam Authority’s strategy the Red River Valley Alliance) and our global to become carbon neutral by 2050 consists of three achievements in green building certifications consecutive steps: and energy efficiency. 1) Increasing efficiency through the supply and INFRASTRUCTURE INVESTMENTS reuse of surplus energy and the development of carbon capture and storage projects; MIM originates investments in infrastructure 2) Investing in electrification and hydrogen to projects that create jobs and economic incentivize the use of green energy by businesses benefits. These could include building or upgrading airports, ports, roads, pipelines, at the port; and transmission lines and power generation— 3) Evolving into a hub for green energy, hydrogen including wind and solar projects. and biofuels. 1. CALCULATED BY THE ISSUER ON THE BASIS OF DATA OF THE EUROPEAN SEA PORTS ORGANISATION (NOT PUBLICLY AVAILABLE). 2. UN CONFERENCE ON TRADE AND DEVELOPMENT 2021 REVIEW OF MARITIME TRANSPORT REPORT (SEE FIGURE 1.11). 2021 SUSTAINABILITY REPORT 51
Sustainability For Our For Our Creating Value For the For Our Managing Appendix at MetLife Workforce Customers as an Investor Environment Communities Responsibly 1 3 MUNICIPAL BONDS IMPACT INVESTMENTS MetLife Corporate Treasury made a Municipal bond investments support MetLife and MIM have been in the impact $25 million investment in the Drexel infrastructure, education and community investment market for over 35 years. Our Hamilton share class of the Goldman services, spanning approximately impact investments are originated with the Sachs Government Money Market Fund, 300 municipalities in 44 states and intent to generate positive societal benefits in VETXX. Drexel Hamilton is a service- Washington, D.C. Learn more about how the markets where we live and work, creating disabled, veteran-owned and -operated we support capital expenditures for a value for communities and catalyzing inclusion broker-dealer founded on the principle range of projects from investments in LEED and equity. These investments include projects of offering meaningful employment to Gold college campus renovations to bonds that aim to mitigate climate change, help disabled veterans. that fund grant-making capacity for global expand racial equity, support women to public health and sustainable energy programs. become financially independent and expand MetLife’s support furthers Drexel Hamilton’s financial health services to the under- and mission of hiring, training and mentoring AFFORDABLE HOUSING unbanked through credit unions and military veterans for a career in financial community-based organizations. 2 services. The investment has helped Drexel INVESTMENTS Hamilton grow its business and hire eight veterans over the past year, all of whom are MIM manages investments in high-quality women, minority and/or service-disabled. housing projects that build financial health Drexel Hamilton supported 25 nonprofit and bring tangible benefits to communities. organizations over the past year, the For example, MIM’s U.K. Social Housing majority serving military veteran initiatives. investments involve social housing providers in the U.K. and overseas territories through investments in nonprofit organizations that provide rental homes at below-market rents to low-income earners, including teachers, nurses, council workers, and the elderly and infirm. 1. A MUNICIPAL BOND IS A PUBLIC DEBT SECURITY ISSUED BY A STATE, MUNICIPALITY OR COUNTY TO FINANCE ITS CAPITAL EXPENDITURES, INCLUDING THE CONSTRUCTION OF HIGHWAYS, BRIDGES OR SCHOOLS. 2. U.S. LOW INCOME HOUSING TAX CREDIT INVESTMENTS INCLUDE FEDERAL TAX CREDIT EQUITY INVESTMENTS, FINANCING AFFORDABLE RENTAL HOUSING AND STATE TAX CREDIT INVESTMENTS THAT ARE MADE WITH SUBSTANTIALLY SIMILAR REQUIREMENTS. AFFORDABLE UNITS IN A PROJECT MAY CHARGE NO MORE THAN 30% OF A HOUSEHOLD’S INCOME, AND THE AVERAGE INCOME OF ALL HOUSEHOLDS IN ASSISTED UNITS IS 60% OF AREA MEDIAN INCOME OR BELOW. 3. IMPACT INVESTMENTS ARE DEFINED AS THOSE MADE WITH THE INTENTION TO GENERATE POSITIVE, MEASURABLE SOCIAL AND ENVIRONMENTAL IMPACT ALONGSIDE A FINANCIAL RETURN. 2021 SUSTAINABILITY REPORT 52
Sustainability For Our For Our Creating Value For the For Our Managing Appendix at MetLife Workforce Customers as an Investor Environment Communities Responsibly $ 10 million MetLife funded $10 million to The New York Forward Loan Fund in 2021. With other lenders and backing from the State of New York, the fund made 1,700 small business loans to support organizations throughout the COVID-19 pandemic. Approximately 90% of the loans have gone to small businesses, nonprofits or small property owners with 10 or fewer employees and under $1 million in annual revenues. The Fund exceeded its goal to lend at least 60% of funds to minority- and women-owned businesses. 2021 SUSTAINABILITY REPORT 53
Sustainability For Our For Our Creating Value For the For Our Managing Appendix at MetLife Workforce Customers as an Investor Environment Communities Responsibly For the Environment OUR APPROACH AND GOVERNANCE HIGHLIGHTS RESILIENT OPERATIONS PROTECTING OUR COMMUNITIES DRIVING CLIMATE SOLUTIONS > 2021 SUSTAINABILITY REPORT 54
Sustainability For Our For Our Creating Value For the For Our Managing Appendix at MetLife Workforce Customers as an Investor Environment Communities Responsibly Our Approach MetLife’s commitment to environmental We are committed to collaborating with stewardship has been a cornerstone of stakeholders to reduce the risks and effects our 154-year history and is at the heart of climate change, while working toward a of our purpose. Our approach includes a more inclusive future. comprehensive environmental, health and Our employees lead our efforts to achieve safety agenda that considers the need to use our goals within every MetLife department natural resources sustainably and be a force and across every office location. To build for good in the world. a workforce that is fully engaged in our At MetLife, we believe that it is our strategy, we provide training and education responsibility to minimize our carbon footprint. opportunities focused on multiple ESG and We manage and monitor climate risks while sustainability topics. seeking opportunities to leverage our people, Our approach to addressing environmental products, services and investments to support a issues has three focus areas: low-carbon economy and a resilient planet. We support the intention of the Paris Agreement 1. Resilient operations and the recent commitments made at the 2021 2. Protecting communities United Nations Climate Change Conference (COP26) in Glasgow to reduce GHG emissions. 3. Driving climate solutions Governance The MetLife Board of Directors’ Governance and Corporate Responsibility Committee oversees our climate change and environmental strategy and implementation. This responsibility includes reviewing our climate goals, metrics associated with those goals and the MetLife Environmental Policy. MetLife’s senior leadership reports progress on commitments and programs to the Board multiple times per year. 2021 SUSTAINABILITY REPORT 55
Sustainability For Our For Our Creating Value For the For Our Managing Appendix Highlights at MetLife Workforce Customers as an Investor Environment Communities Responsibly Net Zero + 200,000 emissions by 2050 or sooner for trees planted around the world global operations and general since 2020 1 account investment portfolio th 123 6 suppliers engaged (94% response consecutive year named to Dow rate) in disclosing climate risks, Jones Sustainability Index for GHG emissions and other recognition of our commitment to 2 sustainable business practices environmental data SEE PAGE 10 FOR METRICS ASSOCIATED WITH OUR 2030 CLIMATE GOALS. 1. THE NET ZERO COMMITMENT APPLIES TO GHG EMISSIONS FROM METLIFE, INC.’S OWNED AND LEASED OFFICES ACROSS THE WORLD, AUTOMOBILE FLEETS, EMPLOYEE BUSINESS TRAVEL AND ASSETS IN METLIFE’S GENERAL ACCOUNT INVESTMENT PORTFOLIO, WHICH INCLUDES THE GENERAL ACCOUNTS OF METLIFE, INC.’S WHOLLY OWNED INSURANCE COMPANY SUBSIDIARIES, WHERE DATA AND METHODOLOGIES ARE AVAILABLE. EMISSIONS ARE TRACKED AND REPORTED IN ACCORDANCE WITH THE GREENHOUSE GAS PROTOCOL. READ MORE ABOUT METLIFE’S CLIMATE COMMITMENTS ONLINE. ADDITIONAL INFORMATION ABOUT METLIFE’S GENERAL ACCOUNT INVESTMENT PORTFOLIO IS AVAILABLE HERE. 2. COLLECTED VIA CDP’S SUPPLY CHAIN PROGRAM. 2021 SUSTAINABILITY REPORT 56
Sustainability For Our For Our Creating Value For the For Our Managing Appendix at MetLife Workforce Customers as an Investor Environment Communities Responsibly Resilient Operations ACHIEVING CARBON NEUTRALITY NET ZERO BY 2050 RESILIENT OPERATIONS 2030 CLIMATE GOALS MetLife is proud to have been the first For years, MetLife has applied a diverse U.S.-based insurer to reach carbon neutrality range of strategies to reduce emissions across our global corporate office portfolio, generated by its environmental footprint. Maintain carbon neutrality vehicle fleet and employee business travel, In 2022, MetLife made the commitment annually for our global offices, and we have maintained the designation for to achieve net zero GHG emissions for fleet and business travel 1 six consecutive years. Our strategy its global operations and general account 2 is twofold: investment portfolio by 2050 or sooner. 1. Reduce emissions as much as possible across This involves building on existing 2030 Reduce location-based GHG our global operations, including through climate goals and substantially reducing implementing energy-efficiency initiatives in emissions in line with the Paris Agreement. emissions by 30% from 2019 our corporate real estate portfolio, minimizing to 2030 employee business travel, and embracing hybrid and electric fleet vehicles; and 2. Offset our remaining emissions through 43% Achieve green or healthy support of renewable energy instruments building certification for 40% and high quality, third-party-certified carbon of our global offices’ square footage is reduction projects in markets where we certified to green or healthy building of our global office portfolio operate. These projects align with the UN standards, putting us ahead of our target (sq. ft.) SDGs and stimulate local economies by to reach 40% by 2030. promoting job creation, human health and women empowerment. Mobilize 100 suppliers to set a GHG emissions reduction target by 2025 1. METLIFE ’S GOALS FOR GHG EMISSIONS AND CARBON NEUTRALITY APPLY TO METLIFE’S OWNED AND LEASED PROPERTIES ACROSS THE WORLD, ITS FLEET OF AUTOMOBILES (SCOPE 1 AND 2 EMISSIONS) AND ITS EMPLOYEE BUSINESS TRAVEL (SCOPE 3 EMISSIONS). 2. THE NET ZERO COMMITMENT APPLIES TO GHG EMISSIONS FROM METLIFE, INC.’S OWNED AND LEASED OFFICES ACROSS THE WORLD, AUTOMOBILE FLEETS, EMPLOYEE BUSINESS TRAVEL AND ASSETS IN METLIFE’S GENERAL ACCOUNT INVESTMENT PORTFOLIO, WHICH INCLUDES THE GENERAL ACCOUNTS OF METLIFE, INC.’S WHOLLY OWNED INSURANCE COMPANY SUBSIDIARIES, WHERE DATA AND METHODOLOGIES ARE AVAILABLE. EMISSIONS ARE TRACKED AND REPORTED IN ACCORDANCE WITH THE GREENHOUSE GAS PROTOCOL. READ MORE ABOUT METLIFE’S CLIMATE COMMITMENTS ONLINE. LEARN ABOUT METLIFE’S GENERAL ACCOUNT INVESTMENT PORTFOLIO ONLINE. 2021 SUSTAINABILITY REPORT 57
Sustainability For Our For Our Creating Value For the For Our Managing Appendix at MetLife Workforce Customers as an Investor Environment Communities Responsibly MANAGING GREEN AND certification programs. MetLife has HEALTHY BUILDINGS 12 Energy Star-certified buildings in the U.S. that cover 3.4 million square feet. Globally, MetLife’s offices comprise approximately 13.5 million square feet. We MetLife has obtained three Fitwel are committed to developing programs that certifications in the U.S. Fitwel is a joint improve the financial and environmental initiative of the U.S. Centers for Disease performance of building space that we own Control and Prevention and the General or operate. This includes a commitment to Services Administration, created to enhance reducing our consumption of energy, water, all buildings and communities to strengthen plastics, paper and other natural resources, health and well-being. The certifications as well as to providing our employees with cover 1.3 million square feet of real estate, healthy spaces where they can thrive. We including our global headquarters in New prioritize sustainable building materials York City. MIM has also obtained Fitwel and design, high levels of indoor air quality, certifications for 17 properties held in its natural light and sustainable amenities such real estate equity investment portfolio. as bike storage, healthy dining options and sit-stand desks. MetLife has achieved Leadership in We are proud to have been awarded Energy and Environmental Design (LEED) Energy Star’s Partner of the Year—Sustained certifications for over 34 million square Excellence Award, which recognizes partners feet of real estate—4.7 million square feet that have made a long-term commitment to attributed to the corporate office network, fighting climate change and protecting public including a new certification in Providencia, Chile, and 29.4 million square feet of MIM- health through energy efficiency, and which managed real estate properties. This is a have demonstrated leadership year over year. total of 82 buildings. In addition to LEED, MetLife prioritizes Energy Star, Fitwel, ISO 14001 and other sustainable building > 2021 SUSTAINABILITY REPORT 58
Sustainability For Our For Our Creating Value For the For Our Managing Appendix at MetLife Workforce Customers as an Investor Environment Communities Responsibly PROMOTING SUPPLY response rate to our request, disclosed CHAIN SUSTAINABILITY climate risks, GHG emissions and other environmental data to us through this MetLife’s Supply Chain Sustainability program. We share a scorecard with these Program embeds sustainability criteria in suppliers that identifies areas of strength and our procurement process, including within opportunities for improvement on climate requests for information and within supplier change management. We encourage suppliers contracts, and incentivizes environmental to set targets to reduce emissions and offer stewardship to reduce GHG emissions. As resources to help them with this process. part of our climate goals, we aim to engage 100 suppliers on setting GHG emissions MetLife also has a longstanding reduction targets by 2025. commitment to purchase products that have a lower environmental impact than Every year we request that suppliers respond others. We prioritize Energy Star-certified to the CDP Climate Change Questionnaire. IT equipment, sustainably sourced paper In 2021, 123 suppliers, representing a 94% and green building materials. METLIFE SUPPLIER CDP 2021 SCORECARD RESULTS metric tons in annual CO2e savings 67.9 reported by suppliers million $ in annual monetary savings from 14.2 emissions reduction billion of suppliers in the program reported having 77%their own forward-looking climate targets of suppliers are engaging their own suppliers 74%on climate issues 2021 SUSTAINABILITY REPORT 59
Sustainability For Our For Our Creating Value For the For Our Managing Appendix at MetLife Workforce Customers as an Investor Environment Communities Responsibly PROTECTING OUR COMMUNITY 2030 CLIMATE GOALS Protecting Our Communities $ 10 million INSPIRING EMPLOYEES TO MAKE AN IMPACT in grants committed to environmental Each year, approximately 10,000 employees participate in our employee engagement program to causes by MetLife Foundation promote environmental stewardship, called “Our Green Impact.” The program offers employees on-site and virtual environmental education, as well as volunteer events. In addition to location- based “green teams” that drive initiatives at the office level, every MetLife line of business, function and region has a climate goals champion responsible for helping the enterprise achieve its goals 5 million by 2030. This includes setting objectives for their function, driving action, collecting metrics and sharing progress with their senior leaders and associates regularly. trees planted, prioritizing areas vulnerable to 2021 EcoChallenge Tree planting natural disasters More than 3,100 employees from 40 markets MetLife’s goal to plant 5 million trees by 2030 participated in the 2021 MetLife EcoChallenge, is an effort to reduce carbon emissions in an annual two-week effort to encourage the atmosphere and help reforest areas that 50,000 employees to adopt green habits, tripling have been decimated by natural disasters, participation rates from 2020 and making it including hurricanes, floods and wildfires. stakeholders engaged and the most impactful challenge to date. Our We expect to reach our target through initiatives educated on environmental collective actions resulted in: that include large-scale reforestation programs stewardship annually • Over 147,000 actions completed; in national and state forests, distribution of • Avoiding 35,000 lbs. of CO2; trees to homeowners in communities impacted by disaster and employee volunteer projects • Removing over 10,000 cups, 25,000 plastic in urban areas around the world. We plan to bottles, 12,000 plastic containers and engage all stakeholders in this commitment 15,000 plastic straws from landfills; and educate our employees, customers and community members about the importance • Spending more than 435,000 minutes of trees. MetLife also joined 1t.org, a global exercising; and leadership platform to mobilize, connect and • Spending more than 110,000 minutes learning empower the global reforestation community about environmental issues. to conserve, restore and grow 1 trillion trees by 2030. 2021 SUSTAINABILITY REPORT 60
Sustainability For Our For Our Creating Value For the For Our Managing Appendix at MetLife Workforce Customers as an Investor Environment Communities Responsibly GLOBAL TREE-PLANTING INITIATIVES + 200,000 total trees planted since 2020 Reaching our tree-planting goal around the world EXAMPLES 1 3 5 7 9 In Mexico, we planted almost In Argentina, we planted In Spain, approximately 25% of the In Romania, we planted 10,000 In India, we planted more than 20,000 trees as part of two 600 trees in partnership MetLife workforce, in partnership trees for policies sold as part 14,000 saplings to add around programs, one with the nonprofit with ReforestArg. with the Arbor Day Foundation, of our “Tree of Life” insurance 24 acres of green through our Reforestamos and another with planted 854 total trees in an area program, in partnership with our “Glow Green” initiative. the Arbor Day Foundation. In both where natural forests have been pension products and providers. cases, we encouraged employees lost to fires. to “adopt a tree.” 2 4 6 8 10 In the U.S., 20 employees in In Uruguay, we planted 100 trees In Hungary, we partnered with In Turkey, we donated 10,000 trees In Korea, 1,800 trees were planted Tampa, Florida, worked with —one tree per local employee— the Hungarian Association of in 2021 to reforest areas destroyed to honor those who participated in 200 other volunteers to plant in the public park of Punta del Executives and Főkert Budapest by fires in the Hatay region. The the Korea School Challenge. 1,250 longleaf pines. Diablo, Rocha, with the Plantatón to plant 1,200 saplings. saplings will be planted through Uruguay initiative. the Turkish Foundation for Combating Soil Erosion. 2021 SUSTAINABILITY REPORT 61
Sustainability For Our For Our Creating Value For the For Our Managing Appendix at MetLife Workforce Customers as an Investor Environment Communities Responsibly 2021 METLIFE AND METLIFE FOUNDATION SUPPORT FOR ECORISE 20,328 Empowering youth Partnering for positive change EcoRise is a school-based program to MetLife leverages customer marketing and students indirectly impacted empower youth to tackle real-world communication to understand priorities challenges in their schools and communities and collaborate on ways to reduce by teaching environmental literacy, social environmental impact. See Reducing innovation and hands-on design skills. Through Paper and Waste—Going Digital for 3,360 this partnership, MetLife Foundation provides more information. students directly impacted grant funding for the program, and MetLife MetLife also collaborates with external employees have the knowledge and skills organizations that are focused on climate to inspire and educate students to become action. MetLife is a founding member of the involved in environmental stewardship in Climate Leadership Council, an international 60 their schools and communities. policy institute founded in collaboration teachers supported (enrolled/trained) with business and environmental leaders to promote a carbon dividends framework as a cost-effective and equitable tool in our climate solutions toolbox. We engage 30 and support a variety of advocacy and schools served in seven cities industry groups, such as the U.S. Green Building Council, the Geneva Association, and Institute for International Finance Sustainable Finance Working Group, and 7 collaborate on monitoring and managing climate risks through globally recognized MetLife volunteers participated at frameworks and initiatives. three student project showcases 4 > Student Innovation Grants awarded (over $1,600 total) 2021 SUSTAINABILITY REPORT 62
Sustainability For Our For Our Creating Value For the For Our Managing Appendix at MetLife Workforce Customers as an Investor Environment Communities Responsibly DRIVING CLIMATE SOLUTIONS 2030 CLIMATE GOALS Driving Climate Solutions Commit $ As climate change continues to impact our In line with its commitment to the U.S. 5 million employees, customers, shareholders and Department of Energy’s Better Building to develop products and 2 partnerships that drive communities, MetLife has committed to Challenge, MIM’s real estate equity climate solutions financing and developing climate solutions investments are targeting: over the next decade. MIM has a long history of sourcing investments in companies and • 50% reduction in Scope 1 and 2 emissions Originate projects that are focused on the conservation from a 2020 base year by 2030; and $ of natural resources, the production and • 20% reduction in Portfolio Energy Intensity 20 billion discovery of alternative energy sources, 3 from a 2016 baseline by 2026. of new MIM-managed the implementation of clean air and water green investments projects and other environmentally conscious business practices. Originate MIM’s real estate equity investments By engaging tenants in energy, water and $ support our green investment goals by waste management initiatives to drive 500 million implementing efficiency programs and of new MetLife impact investments, encouraging environmental best practices, reductions, perform energy assessments and with 25% allocated to climate including working to register and benchmark implement cost-effective strategies to improve change priorities utility usage to the U.S. Environmental energy and water efficiency, MIM reduced Protection Agency’s (EPA) Energy Star energy consumption by 7.6% in 2021 across Power all MIM-managed Portfolio Manager across 100% of our its real estate equity portfolio. and controlled real estate owned and investment properties. investments with On average, these investment properties have 100% saved 16.3% and 451 million kBtu since their 4 renewable electricity baseline year. Read more about MIM Real Estate Equity team’s ESG Challenge. For more information on progress toward these goals, please see For Our Customers and Creating 1. FOR A DEFINITION AND ADDITIONAL INFORMATION REGARDING METLIFE’S IMPACT INVESTMENTS AND GREEN INVESTMENTS, PLEASE SEE PAGE 90. 2. U.S. DEPARTMENT OF ENERGY-LED INITIATIVE TO ENCOURAGE INSTITUTIONS TO IMPROVE BUILDING ENERGY EFFICIENCY BY AT LEAST 20% OVER 10 1 YEARS AND SHARE THEIR STRATEGIES AND RESULTS. Value as an Investor. 3. BASED ON A COMMITMENT OF 45 MILLION SQUARE FEET. 4. PER BETTER BUILDINGS CHALLENGE GUIDANCE, AVERAGE SAVINGS ARE REPORTED SINCE BASELINE YEARS ARE DIFFERENT FOR EACH PROPERTY DUE TO DYNAMIC NATURE OF PORTFOLIO. 2021 SUSTAINABILITY REPORT 63
Sustainability For Our For Our Creating Value For the For Our Managing Appendix at MetLife Workforce Customers as an Investor Environment Communities Responsibly For Our Communities OUR APPROACH, GOVERNANCE AND PRIORITIES—METLIFE FOUNDATION HIGHLIGHTS FINANCIAL HEALTH STRONGER COMMUNITIES FOSTERING RACIAL EQUITY AND INCLUSION ACROSS COMMUNITIES VOLUNTEERING EFFORTS—ENGAGING OUR EMPLOYEES > 2021 SUSTAINABILITY REPORT 64
Sustainability For Our For Our Creating Value For the For Our Managing Appendix at MetLife Workforce Customers as an Investor Environment Communities Responsibly MetLife Foundation: Our Approach Governance MetLife plays an important role in As a separate legal entity, MetLife Foundation has communities as one of the world’s leading its own Board of Directors, chaired by MetLife, Inc.’s financial services companies. We strive Head of Corporate Affairs. MetLife Foundation’s to be a force for good in the communities President and Chief Executive Officer reports directly where we operate through the work of to the Foundation’s Board Chair. As a fully integrated MetLife Foundation; our corporate giving; role, MetLife Foundation’s President and CEO also employee volunteering efforts; meaningful, serves as MetLife, Inc.’s Head of Corporate Giving high-impact partnerships; and by providing and Employee Volunteerism, a function overseen pro bono services. MetLife employees work by the Governance and Corporate Responsibility every day to help build a more confident Committee of MetLife’s Board of Directors. future for people around the world. Priorities Giving back to the places where MetLife operates helps foster strong connections between the company and communities. MetLife Foundation positively impacts communities through grants for financial health and well-being, diversity and inclusion, youth and education, community improvement, disaster relief, and arts and culture. MetLife Foundation helps people manage household budgets, recover from the unexpected, build short-term savings and stability, and plan for the future. MetLife Foundation supports communities through strategic grants that demonstrate its commitment to helping low- and moderate-income people around the world build a more confident future. MetLife Foundation partners with nonprofit organizations and social enterprises to close the equity and wealth gap, build financial health and support small business owners—all issues that have been exacerbated by the COVID-19 pandemic. These focus areas are aligned with the UN SDGs, business priorities and the opportunity for improved DEI. 2021 SUSTAINABILITY REPORT 65
Sustainability For Our For Our Creating Value For the For Our Managing Appendix Highlights at MetLife Workforce Customers as an Investor Environment Communities Responsibly Since 2020, MetLife MetLife Foundation Over Foundation has provided $33 million more than completed its three-year contributed in grants globally $27 million $5 million by MetLife and MetLife in grants to address COVID-19 commitment to advance racial Foundation in 20211 3 related issues globally2 equity in the U.S. MetLife Foundation MetLife was awarded contributed the first More than the U.S. President’s $1 million in grants since Volunteer Service Award 2020 as part of its climate 25,000 for providing over goal to contribute employees volunteered more than 61,000 hours 6,000 hours $10 million across 37 countries of service to Junior by 2030 Achievement4 1. INCLUSIVE OF METLIFE FOUNDATION, FUNDACIÓN METLIFE MEXICO, METLIFE KOREA FOUNDATION AND CORPORATE CONTRIBUTIONS. IN ADDITION, SINCE 2013, METLIFE FOUNDATION HAS REACHED 17.3 MILLION TOTAL PEOPLE THROUGH ITS FINANCIAL HEALTH WORK, A 20% INCREASE OVER 2020. 2. INCL USIVE OF METLIFE FOUNDATION, FUNDACIÓN METLIFE MEXICO, METLIFE KOREA FOUNDATION AND CORPORATE CONTRIBUTIONS. 3. AS OF 2022. COMMITMENT WAS MADE IN JUNE 2020. THIS INCLUDES A $1 MILLION COMMITMENT TO THE UNITED NEGRO COLLEGE FUND TO HELP FINANCE SCHOLARSHIPS AT HISTORICALLY BLACK COLLEGES AND UNIVERSITIES. 4. THIS WAS OUR SEVENTH CONSECUTIVE AWARD AND SIXTH CONSECUTIVE GOLD AWARD. 2021 SUSTAINABILITY REPORT 66
Sustainability For Our For Our Creating Value For the For Our Managing Appendix at MetLife Workforce Customers as an Investor Environment Communities Responsibly Financial Health MetLife Foundation provides grants to nonprofit organizations dedicated to helping people manage household budgets, grow their incomes and put good financial habits into practice. Its initiatives help people to save and plan for the future, create more certainty in their lives and recover from the unexpected. From supporting workforce development programs to empowering financial technology organizations to provide services to low- and moderate-income people, MetLife Foundation continually seeks to expand opportunities for improving financial health for people around the world. Learn more about our Financial Health initiatives. TECHNOVATION (CHILE) GENERATION (INDIA) INCLUSION PLUS (KOREA) Technovation is a global technology and Since 2019, MetLife Foundation has For the fourth consecutive year, MetLife entrepreneurship education nonprofit with a partnered with Generation to enhance the Foundation supported Inclusion Plus mission to empower girls and their families financial health of young people through Solution Lab, an accelerator for financial to tackle real-world problems using cutting- skilling, training and employment, setting technology (fintech) social enterprises edge technologies, such as mobile and them on a path toward earning a steady focused on building the financial health of artificial intelligence. With a grant from MetLife income and improving their long-term low- and moderate-income South Korean Foundation, Technovation partnered with financial health. In 2021, Generation enrolled families. In 2021, the lab supported 10 social the Chile-based nonprofit Tecnología con more than 1,600 students from low-income enterprises with three months of mentorship, nombre de Mujer to engage youth, parents, families in workforce programs and in tech an opportunity to win $150,000 in scale-up educators and mentors in science, technology, roles. As a result, Generation achieved a grants, as well as to network with a group of engineering and mathematics (STEM) 92% graduation rate and 81% placement rate 22 impact investors through a Virtual Deal entrepreneurship programs, reaching 550 girls. within 90 days—66% of students Share Live day for follow-on investments. were women. The cohort of entrepreneurs represented a diverse mix of solutions, including a service to waive housing deposits for young people, a platform for gig workers to find jobs and an insurance platform for seniors and disabled people. 2021 SUSTAINABILITY REPORT 67
Sustainability For Our For Our Creating Value For the For Our Managing Appendix at MetLife Workforce Customers as an Investor Environment Communities Responsibly FINNSALUD (MEXICO) In 2021, FinnSalud developed a: FinnSalud is a three-and-a-half-year project • Financial health index through a baseline launched in 2019 supported by MetLife survey of over 1,500 credit union members; Foundation and managed by BFA Global • Financial health score linked to the index; in Mexico. The program is developing a set of financial health standards and a • Recommendations engine linked to the measurement tool to shed light on the state score; and of the financial health of Mexicans and to • Digital tool to deploy financial health surveys. inform initiatives that can improve it. The FinnSalud project also measured the financial health of over 3,400 employees and members of FinnSalud’s partner institutions to understand whether relevant and affordable financial services promote financial health. 2021 SUSTAINABILITY REPORT 68
Sustainability For Our For Our Creating Value For the For Our Managing Appendix at MetLife Workforce Customers as an Investor Environment Communities Responsibly Stronger Communities MetLife Foundation focuses on supporting communities around the world through grants, impact investments, employee volunteerism and donations, and long-term grassroots partnerships. MetLife Foundation sought opportunities to support elders and children in Japan, lift up veteran entrepreneurs, honor 9/11 victims and their families, address COVID-19-related disparities and make an impact in numerous communities across the world by leveraging our resources and partnership ecosystem. THE NIPPON FOUNDATION HONORING THE 9/11 SUPPORTING VETERANS PARTNERSHIP 20TH ANNIVERSARY MetLife Foundation partners with Bunker MetLife Foundation announced a MetLife has a longstanding commitment Labs, a nonprofit supporting military- partnership in Japan with The Nippon to supporting 9/11 disaster recovery and connected entrepreneurs by providing the Foundation, a social innovation hub that honoring those who were lost in the resources that help grow their businesses. aims to achieve a society in which all attacks, including two MetLife employees. The Foundation supported Bunker Labs’ people support one another, reducing the Building on the $8 million MetLife has virtual events, which have provided burdens and challenges they face together. contributed to recovery efforts and the increased access for veteran entrepreneurs The two organizations launched “MetLife 9/11 Memorial and Museum, MetLife to learn how to launch and sustain their Foundation and The Nippon Foundation: Foundation made a series of contributions businesses, and The Transition podcast, Better Life Better Place for the Elderly and to commemorate the anniversary and which provides storytelling, subject matter Children,” a program that will develop 12 care educate new generations, while providing expertise and introductions to the Bunker facilities for the elderly and children across sustained safety and preparedness, and Labs community. Japan by the end of 2024. The program is the uniting America in service to communities. first step in MetLife Japan’s “Empowering MetLife employees in seven cities Learn more about all of our Stronger Our Communities” initiative which, through volunteered for the September 11 National Communities initiatives. employee support, aims to create a more Day of Service, packing healthy sustainable society. nonperishable meals, which were distributed to local food banks. 2021 SUSTAINABILITY REPORT 69
Sustainability For Our For Our Creating Value For the For Our Managing Appendix at MetLife Workforce Customers as an Investor Environment Communities Responsibly ADDRESSING COVID-19 DISPARITIES To date, MetLife and MetLife Foundation have collectively contributed over $250 million of relief to help people cope with COVID-19, between premium credits and direct contributions. This includes MetLife Foundation’s over $27 million contribution to COVID-19 relief and recovery, including direct cash assistance in the form of help with rent or bills, debt or savings, and food or basic needs, as well as financial coaching and counseling. Read more about our support for COVID-19 relief. MetLife Foundation donated $1.6 million to help Bangladesh, India and Nepal manage the surge in COVID-19 cases across South Asia, > with record case numbers resembling those experienced in the U.S. and Europe in 2020. Fundación MetLife Mexico donated approximately $867,000 to help communities respond to and recover from COVID-19. The funds supported six organizations in 13 states. This included eight hospitals and sanitary infrastructure at public schools located in low-income communities, benefiting 95,300 people. SUPPORTING DIVERSE YOUNG ARTISTS MetLife recently sold art owned by the company fetching $1.875 million. MetLife Foundation directed the funds from the sale to three New York City-based organizations focused on supporting a new generation of artists from historically marginalized communities. These organizations included: Lower Eastside Girls Club to support a visual arts program, classes, mentoring and community engagement; Harlem School of the Arts to support workshops, tuition assistance and art programs; and the Urban Arts Partnership to support its School of Interactive Arts, which teaches students how to create their own video games with original art, music and storytelling elements. > 2021 SUSTAINABILITY REPORT 70
Sustainability For Our For Our Creating Value For the For Our Managing Appendix at MetLife Workforce Customers as an Investor Environment Communities Responsibly Fostering Racial Equity and Inclusion Across Communities MetLife’s commitment to DEI goes well beyond our organization. We seek to foster racial equity across all our communities and, in doing so, close the equity and wealth gap by building financial confidence and resiliency among marginalized groups. For example, in 2021, MetLife Foundation provided a grant to the Thurgood Marshall College Fund, which provides awards almost exclusively to historically Black colleges and universities and predominantly Black institutions. MetLife Foundation also funds a United Negro College Fund scholarship endowment to support Black students majoring in business, accounting or finance. SUPPORTING SOCIAL ENTREPRENEURS MetLife Foundation’s support to Echoing 500 Green’s Racial Equity Philanthropic Fund is helping to scale more than 500 social enterprises social enterprises with with a racial equity focus. The Fund supports racial equity focus leaders of color in launching and scaling social innovations with an intentional, explicit and sustained focus on advancing racial justice. The organization plans to reach more than 15,000 low- and moderate-income individuals by finding, investing in and connecting promising social innovators to its resources. Through their Fellowship program, Echoing Green helps entrepreneurs become impactful leaders by connecting them with tools, resources and communities to bring their ideas to life. 2021 SUSTAINABILITY REPORT 71
Sustainability For Our For Our Creating Value For the For Our Managing Appendix at MetLife Workforce Customers as an Investor Environment Communities Responsibly Volunteering Efforts— 2021 GLOBAL VOLUNTEERING BY THE NUMBERS Engaging Our Employees 61,843 volunteer hours MetLife employees live our purpose by lending their business skills and enthusiasm to their communities through support for education, the environment and financial health, as well as through pro bono initiatives. 25,450 acts of volunteering GREAT EMEA LITTER PICK In 2021, employees across our EMEA on helping underserved communities and region came together to volunteer for the supporting our DEI focus areas of disability, 37 countries environment in the “Great EMEA Litter Pick,” gender, and race and ethnicity. an initiative in which employees spent time MetLife Foundation’s partners have included: removing and recycling trash from their neighborhoods and local communities. • Girls Who Code, to provide girls and young 90 DAYS OF GIVING BY THE NUMBERS All EMEA markets participated, with over women with a unique blend of computer 500 participants cleaning a variety of locations, science, sisterhood and a first-hand look including beaches, parks, woods and other into careers in technology; public areas, including employees in Egypt 35,750 hours spent volunteering cleaning litter from the Nile River. • Room to Read, which transforms the lives of millions of children in low-income VOLUNTEERING WITH PURPOSE communities by focusing on literacy and gender equality in education; 14,384 employee volunteers MetLife’s second annual “Volunteering with • Special Olympics, which uses the power of Purpose: 90 Days of Giving” campaign sport as a catalyst for inclusion for children encouraged employees globally to and adults with intellectual disabilities; and activate our purpose through community • Together We Rise, to improve the lives of countries volunteering. Volunteer opportunities 37 were designed to increase the impact and children in foster care. reach of nonprofit partners, with a focus 2021 SUSTAINABILITY REPORT 72
Sustainability For Our For Our Creating Value For the For Our Managing Appendix at MetLife Workforce Customers as an Investor Environment Communities Responsibly MENTORING WITH PURPOSE Education and engagement with caring people in vulnerable situations. During the adult role models can play an important first program, MetLife mentors and youth role in increasing social capital and a sense mentees spent two months exchanging of belonging, thereby driving economic letters that discussed the day-to-day life of mobility and reducing inequality. Read more working for a multinational corporation. In about our mentoring efforts. the second program, volunteers developed specific skills with young people through MetLife Foundation is a longstanding partner virtual meetings. The program also increased of Junior Achievement Worldwide, one of the young participants’ access to dental care. the world’s largest organizations working to inspire and empower young people to succeed in a global economy. MetLife volunteers in 21 countries helped prepare Junior Achievement awarded MetLife the youth for employment and entrepreneurship. U.S. President’s Volunteer Service Award In Latin America, MetLife Brazil partnered for contributing 6,000 hours of volunteer with nonprofit Atados on two virtual service—the sixth consecutive year we’ve mentoring programs in which MetLife earned the Gold award. employees volunteered to help young 2021 SUSTAINABILITY REPORT 73
Sustainability For Our For Our Creating Value For the For Our Managing Appendix at MetLife Workforce Customers as an Investor Environment Communities Responsibly 2021 TAPROOT FOUNDATION SKILLS-BASED AND PRO BONO New York Business Council PARTNERSHIP BY THE NUMBERS VOLUNTEERING for Access to Justice workshops MetLife employees around the globe drive MetLife recently joined the New York State 3 social impact through skills-based and pro Business Council for Access to Justice, bono volunteering, sharing their expertise in which supports the provision of critical technology, legal and HR, among other areas. free legal services for low- to moderate- Learn more about our volunteering and pro income New Yorkers. MetLife Legal Affairs 29nonprofits bono services initiatives. partnered with the law firm of Debevoise & Plimpton and Legal Services NYC to host a virtual Emergency Rent Assistance Program Taproot Foundation application clinic to help New York tenants facing eviction access financial assistance. volunteer hours Since 2016, MetLife Foundation and The clinic is part of the New York State 550 Taproot Foundation have offered Business Council for Access to Justice’s “Opportunity Workshops,” which pair efforts to address the looming housing and skilled employees with nonprofits who eviction crisis. need support to develop approaches of nonprofit partners and solutions for issues critical to their 91%that worked with MetLife day-to-day success. volunteers found the In 2021, we partnered with Dell Technologies deliverable they received to be good or excellent on two workshops, including the first-ever Opportunity Workshop in the U.K. and Ireland, bringing our companies’ best combined skillsets to the table. 2021 SUSTAINABILITY REPORT 74
Sustainability For Our For Our Creating Value For the For Our Managing Appendix at MetLife Workforce Customers as an Investor Environment Communities Responsibly Asian American Legal Defense approximately 106 hours with the organization Climate Foundation and Education Fund to research, create and design a fact sheet that provided resources for victims of The Climate Foundation is a nonprofit The Asian American Legal Defense and hate crimes in New York. The goal was to committed to developing sustainable Education Fund (AALDEF) is a New York- empower members of the Asian American economic solutions to urgent challenges based national organization that protects and and Pacific Islander (AAPI) community with an emphasis on regenerative food promotes the civil rights of Asian Americans. with the information they needed to security, ecosystem life support and Thirteen MetLife employees volunteered report hate crimes. measurement of carbon export with Blue Carbon sinks. In 2021, MetLife Legal Affairs provided advice on the U.S. registration requirements needed to complete the Foundation’s registration process in the Philippines. DACA immigration clinic Nine MetLife Legal Affairs associates volunteered to work on a Deferred Action for Childhood Arrivals (DACA) immigration clinic in partnership with law firm Akin Gump Strauss Hauer & Feld LLP. Volunteers interviewed clients and put together DACA applications help to provide status relief to immigrant youth. 2021 SUSTAINABILITY REPORT 75
Sustainability For Our For Our Creating Value For the For Our Managing Appendix at MetLife Workforce Customers as an Investor Environment Communities Responsibly Managing Responsibly OUR APPROACH AND GOVERNANCE RISK MANAGEMENT HIGHLIGHTS SUSTAINABLE FINANCING FRAMEWORK CODE OF BUSINESS ETHICS SUPPLIER MANAGEMENT MANDATORY TRAINING HUMAN RIGHTS CYBERSECURITY AND DATA PRIVACY GOVERNMENT RELATIONS > 2021 SUSTAINABILITY REPORT 76
Sustainability For Our For Our Creating Value For the For Our Managing Appendix at MetLife Workforce Customers as an Investor Environment Communities Responsibly Our Approach When we uphold our values with courage and conviction, we embody the promises we make and prove that our employees' trust is reliably placed. Effective governance underpins MetLife’s ability to fulfill our purpose—Always with you, building a more confident future. It enables us to deliver on the promises we make to our customers, employees and shareholders. We are proud to have a culture in which each employee takes responsibility for their actions, adopts an ownership mindset and is empowered to speak up. Along with customers, employees are at the heart of what we do. Our team helps us maintain customer focus as one of our global key focus areas. To maintain this culture, MetLife has focused on continuously improving governance practices and regularly adopts and updates trainings, policies and codes, and resources for all employees to uphold and promote in their day-to-day practices. These policies include: Code of Business Ethics Global Anti-Bribery and Corruption Policy (see Code of Business Ethics) Antitrust Guidelines MetLife Equal Employment Opportunity Global Sales Practices Policy and Anti-Harassment Policy MetLife Speak Up Tool Global Privacy & Information Security Program (internal) MetLife Pay Equity Statement Supplier Code of Business Ethics MetLife Environmental Policy MetLife Privacy Policies 2021 SUSTAINABILITY REPORT 77
Sustainability For Our For Our Creating Value For the For Our Managing Appendix at MetLife Workforce Customers as an Investor Environment Communities Responsibly Governance BOARD OF DIRECTORS MetLife’s Board of Directors is responsible for providing direction on the management of the property, affairs and business of the Corporation. We maintain a Directors’ Code of Business Ethics, which requires each Director to annually review and sign an acknowledgment of understanding and compliance. Each of MetLife’s Board Committees (with the 1 DIVERSITY OF SKILLS AND EXPERIENCE exception of the Executive Committee) is chaired (Includes both primary and secondary qualifications) by an independent director with demonstrated expertise in the responsibilities of that Committee Executive Leadership 11 and strong leadership skills. The Board’s Governance Corporate Governance/Public Company Board 11 and Corporate Responsibility Committee meets at Financial Services 6 least three times each year and makes regular reports Global Literacy 10 to the Board of Directors about its activities. Regulated Industry/Government 13 The Governance and Corporate Responsibility Investments 5 Committee is tasked with various responsibilities, Financial Expertise, CFO and Audit 7 including oversight of MetLife’s: Risk Management 10 • Proposed succession and development plans for Consumer Insight/Analytics 3 Executive Officer; Technology 7 • Ethics and compliance programs and sales practices, Corporate Affairs 7 to mitigate the risk of non-compliance, customer and regulatory complaints and other reputational risks; • Annual compliance plan approval; and • Goals and strategies concerning legislative, regulatory and corporate responsibility initiatives that impact MetLife’s interests. The Committee also oversees an annual Board evaluation. 1. AS OF APRIL 2022. FOR A MORE DETAILED DESCRIPTION OF THE SKILLS AND EXPERIENCES, SEE METLIFE'S 2022 PROXY STATEMENT. 2021 SUSTAINABILITY REPORT 78
Sustainability For Our For Our Creating Value For the For Our Managing Appendix Highlights at MetLife Workforce Customers as an Investor Environment Communities Responsibly Women comprise Joined 1 WEConnect 38% of our Board of Directors International, (five women), and an organization committed to enabling women business owners 41% to compete in the global of our managers marketplace Established a senior management global 98% Climate of employees completed Code Advisory of Business Ethics training Council in 2022 to enhance governance of climate risk > 1. DATA AS OF APRIL 2022. 2021 SUSTAINABILITY REPORT 79
Sustainability For Our For Our Creating Value For the For Our Managing Appendix at MetLife Workforce Customers as an Investor Environment Communities Responsibly 2022 BOARD OF DIRECTORS DEMOGRAPHICS SUSTAINABILITY GOVERNANCE The Company has nominated highly qualified independent leaders to serve on MetLife’s Chief Sustainability Officer (CSO) is responsible its Board of Directors, including Carla Harris, the most recent appointee as of for corporate ESG strategy and commitments. The CSO April 2022. coordinates with other functional leaders, including the CEO, Head of Corporate Affairs, Chief Investment Officer, Chief Risk Officer and CDO to establish sustainability goals and enact progress across the organization. MetLife’s sustainability function reports regularly to the Governance and Corporate Responsibility Committee of the Board of Directors. The function has responsibilities relating to, among other things: • Directing and integrating MetLife’s sustainability strategy, target-setting activities, commitments, policies and key performance indicators (KPIs) across the enterprise; • Summarizing MetLife’s sustainability performance and metrics in an annual report; • Ensuring MetLife’s index of disclosures are aligned to key reporting frameworks, including the Global Reporting Initiative (GRI), SASB and Task Force on Climate-related Financial Disclosures (TCFD); and • Managing MetLife’s monitoring and management of relevant ESG issues and opportunities in coordination with appointed sustainability champions in key markets. 2021 SUSTAINABILITY REPORT 80
Sustainability For Our For Our Creating Value For the For Our Managing Appendix at MetLife Workforce Customers as an Investor Environment Communities Responsibly Code of Business Ethics MetLife’s Code of Business Ethics helps us live our purpose with every customer, in every interaction, every day. It helps us navigate an always-changing external environment while meeting the highest professional standards. The Code is the foundation for our Success Principles and represents our core beliefs for conducting business. Our Success Principles articulate the behaviors that MetLife employees are expected to exhibit, guide our actions and help us to deliver on our purpose. Our Code of Business Ethics is available in 19 languages and applies to all employees. Each year, employees pledge that they commit to and comply with the Code. In the Code, we confirm our commitment to Reporting channels include: conducting business fairly, honestly and openly, and our zero-tolerance policy toward all forms of bribery • Speak Up Tool, a desktop icon available to and corruption committed by MetLife employees or a all employees; third party acting for or on behalf of MetLife. We also • Corporate Special Investigations Unit; maintain several supplemental codes, including the Financial Management Code of Business Ethics • Local or Regional Compliance Risk Management; and the Supplier Code of Business Ethics. • Local or Regional Helpline or Whistleblowing Code training for employees is focused on managing Contact; and conflicts of interest and ethical decision making. • Local or Regional HR or Employee Relations. Throughout this training, we encourage employees to have an ownership mindset, speak up and escalate MetLife prohibits any form of retaliation against concerns when they arise. an employee for raising a concern in good faith or assisting with an investigation regarding a RAISING CONCERNS AND SPEAKING UP potential violation of our Code, our policies, laws or regulations. At MetLife, we understand the importance of an environment where employees feel empowered to speak up. We encourage employees to lead by example, holding themselves and others accountable by raising issues and concerns. Employees can speak up using the channel that is most comfortable for them, and can report anonymously, where permissible by law. 2021 SUSTAINABILITY REPORT 81
Sustainability For Our For Our Creating Value For the For Our Managing Appendix at MetLife Workforce Customers as an Investor Environment Communities Responsibly Mandatory Training We prioritize learning and provide access to 2021 TRAINING BY THE NUMBERS training and educational resources to every employee. We hosted 25 mandatory courses in 2021, averaging 14 courses and seven hours of learning per employee in 2021 alone. The courses included enterprise-wide modules 25 and those targeted to specific employee mandatory courses groups. We achieved a 95% completion rate, surpassing our 90% target. Mandatory training topics included anti-money laundering, privacy and data 7 hours protection, fraud prevention, anti-bribery of learning per employee on average and corruption, communicating effectively, three lines of defense (see Risk Management), ethical business conduct and DEI topics such as working across cultures, allyship, 95% microaggressions and bias. The mandatory training program is reviewed on a regular completion rate basis and may be adjusted based on MetLife needs. Every MetLife employee is required to complete yearly training and comply with applicable privacy laws and regulations when processing personal data held by the company (see Cybersecurity and Data Privacy). > 2021 SUSTAINABILITY REPORT 82
Sustainability For Our For Our Creating Value For the For Our Managing Appendix at MetLife Workforce Customers as an Investor Environment Communities Responsibly Cybersecurity and Data Privacy MetLife’s customers, employees and Compliance and other lines of business oversee business partners around the world provide our information technology security policies, us with their personal information every emerging risks and compliance requirements. day. We recognize that privacy and data Every year, we conduct mandatory protection are significant concerns for both cybersecurity and privacy training for companies and individuals, and we have all employees to raise awareness about Each October for Cybersecurity Awareness a longstanding commitment to protect potential threats and to give them clear personal information and use it responsibly. actionable guidelines to inform their Month, MetLife raises awareness about the importance of cybersecurity and provides Our policies and procedures are designed everyday tasks and decision making. employees with the resources they need to protect the confidentiality and security We have established reporting processes to protect themselves, our customers and of personal information and ensure that and escalation pathways from our MetLife. In 2021, our campaign was organized information is handled appropriately businesses and functions to ensure that worldwide, which includes key areas such as potential personal data incidents can be around weekly themes and included speaking safeguards and risk management; monitoring; events, YamJams, articles and other interactive incident response; cybersecurity and assessed and handled in a timely manner— engagement opportunities. e-discovery investigation; and threat including reporting to senior management, intelligence. Our Global Privacy & Information as needed. Security Program establishes enterprise-wide We are also participants in industry principles and global minimum standards, cybersecurity groups and events, such among other things, around the collection as Cybersecurity Awareness Month, and use of personal information in compliance a national campaign sponsored by the with applicable privacy laws and regulations. Department of Homeland Security that An internal committee of Business Information was created to raise awareness about Security Officers with representation from 1 cybersecurity and staying safe. Technology, Law, Internal Audit, HR, 1. PLEASE SEE METLIFE 2022 PROXY STATEMENT FOR ADDITIONAL INFORMATION. 2021 SUSTAINABILITY REPORT 83
Sustainability For Our For Our Creating Value For the For Our Managing Appendix at MetLife Workforce Customers as an Investor Environment Communities Responsibly Risk Management THREE LINES OF DEFENSE RISK MANAGEMENT MODEL At MetLife, we are in the business of ESG risks, including climate risks, are First Line mitigating risk and protecting families and within the purview of multiple Board and their futures. We manage risk so that senior management committees, as they Lines of business individuals and communities can realize underpin all aspects of risk management. their full potential. MetLife has a The Finance and Risk Committee of the and corporate comprehensive and well-established risk Board of Directors oversees the assessment, management framework that constantly management and mitigation of material functions evolves and is designed to address material risks, as well as capital and liquidity identify, measure, financial and non-financial risks (including management practices. Other Board of monitor, manage and report risk compliance risks) to our business. Our risk Directors committees also have significant and control framework operates under a risk management oversight responsibilities: “Three Lines of Defense” model where each employee is responsible for risk management. • Audit: internal controls, information security It helps us identify, measure, monitor, and cybersecurity, and relevant legal and Second Line manage and report on risks at the right level, regulatory compliance allowing us to deliver on the promises we • Governance and Corporate Responsibility: Global Risk make to our customers, employees ethics, compliance programs, sales practices, and shareholders. management succession and reputation, as Management The program is led by an independent well as strategies, activities and initiatives provides strategic advisory services and effective Global Risk Management (GRM) related to sustainability and DEI challenge and oversight to the first line of defense organization headed by our Chief Risk • Investment: investment portfolio risks Officer, who reports directly to MetLife’s CEO. For more information • Compensation: compensation plan risks (e.g., about our risk management framework, avoiding incentives to take excessive risk) Third Line please visit our website. Internal Audit provides independent assurance and testing over the risk and control environment and related processes and controls 2021 SUSTAINABILITY REPORT 84
Sustainability For Our For Our Creating Value For the For Our Managing Appendix at MetLife Workforce Customers as an Investor Environment Communities Responsibly MANAGING CLIMATE RISKS modeling and climate risk analysis of the U.S. energy portfolio. Climate risks, both physical and transition MetLife has also established a Climate risks, could impact MetLife’s business Risk Working Group (CRWG) in Europe, operations, investments, customers and comprising principally members of our supply chain. These risks, as well as Executive Management Committee to associated opportunities, are identified, develop a comprehensive approach to measured, monitored, managed and managing climate risk for MetLife Europe reported to MetLife’s Board of Directors, and MetLife Europe Insurance. when appropriate, through our enterprise- wide risk management framework. We have integrated climate risks into our investments Sustainable Financing Framework underwriting standards, conducted a qualitative risk assessment and are developing quantitative scenario analysis MetLife’s Sustainable Financing Eligible assets are subject to a review capabilities. We have plans to build on our Framework facilitates alignment of our consistent with MetLife’s policies, including work and measure the carbon intensity business and investment activities to MIM’s ESG Investment Policy. of our investment portfolio and develop drive a sustainable future (see Creating As part of the Framework, MetLife has metrics, including stress tests and scenario Value as an Investor).The Framework committed to publishing an annual analysis, to assess climate risks. guides our issuances of green, social and Sustainable Financing Report, which sustainable bonds, term loans, preferred includes a summary of outstanding In 2022, MetLife launched a global stock, subordinated notes and funding Climate Advisory Council to enhance our agreements by MetLife, Inc. and its MetLife Sustainable Financing issuances, governance of climate risk. The Council subsidiaries, including Metropolitan Life including issuance date, size, maturity is chaired by our Chief Risk Officer and Insurance Company and Metropolitan date, currency and format. The 2021 includes our Chief Financial Officer, Chief Tower Life Insurance Company. Sustainable Financing Report is available Investment Officer, General Counsel, Chief on our website. Auditor, Head of Investor Relations and MetLife’s Sustainable Financing Council, Learn more about the Framework and other executive-level and management- comprising members from the Office of see Creating Value as an Investor for level staff. the Chief Investment Officer, Corporate information regarding two issuances Treasury and Global Sustainability functions, completed in accordance with MetLife’s To date, the council has addressed topics meets regularly and is responsible for the including climate regulation, climate risk review and selection of eligible assets. Sustainable Financing Framework. 2021 SUSTAINABILITY REPORT 85
Sustainability For Our For Our Creating Value For the For Our Managing Appendix at MetLife Workforce Customers as an Investor Environment Communities Responsibly Supplier Management In 2021, MetLife engaged with over 200 Diverse 1 Business Partners. We have spent an estimated MetLife’s Global Procurement Policy MetLife asks sustainability questions in $3.5 billion since the inception of MetLife and Procedures help secure the best requests for information and during 2 Supplier Inclusion and Development in 2003. value from our suppliers across the four onboarding. We encourage suppliers to MetLife participates in national supplier diversity major MetLife regions (U.S, EMEA, Asia participate in the MetLife Supply Chain advocacy organizations that foster important and LATAM). MetLife’s Supplier Code of Sustainability program through active connections and relationship-building Business Ethics articulates our intention engagement (see Promoting Supply opportunities. These organizations include: to work with suppliers who act consistently Chain Sustainability). with MetLife’s principles and standards. This includes our commitment to conduct THIRD-PARTY RISK MANAGEMENT business ethically and lawfully in countries Women’s Business Enterprise National Council where we operate across our supply chain, The Supplier Third-Party Risk and we expect the same of our suppliers. Management (TPRM) Program We expect suppliers to operate in line with protects sensitive MetLife and customer National Minority Supplier Development Council MetLife’s principles, which prioritize respect information. Third parties are required to for basic human rights within organizations, comply with all elements of the MetLife including rights to health and safety, life TPRM Program, including participation in National LGBT Chamber of Commerce and liberty and equality. Suppliers should a risk assessment prior to providing goods also comply with all applicable federal, state or services and in ongoing monitoring of and local employment, equal opportunity, our business relationship. Disability:IN labor, immigration and wage and hour laws. Through MetLife’s TPRM program, we Failure to comply with these requirements evaluate the risk of third-party engagements can result in the termination of our and suppliers before assigning them a risk business arrangement. rating and manage them accordingly. National Veteran Business Development Council 1. THIS NUMBER IS LESS THAN THE 2020 METRIC AS A RESULT OF THE SALE OF METLIFE AUTO & HOME, COMPLETED IN APRIL 2021. 2. DUE TO THE LONG HISTORY OF THE PROGRAM, SPEND FIGURES FROM 2003 THROUGH 2007 ARE APPROXIMATED. 2021 SUSTAINABILITY REPORT 86
Sustainability For Our For Our Creating Value For the For Our Managing Appendix at MetLife Workforce Customers as an Investor Environment Communities Responsibly Human Rights Government Relations FOSTERING SUPPLIER DIVERSITY As a UNGC signatory and participant, Our Government Relations team engages MetLife encourages respect for human with policymakers and relevant stakeholders Through MetLife’s Supplier Inclusion & rights and prioritizes compliance with at international, regional and individual market Development program, our goal is to grow policies and regulations designed to levels to support our business, customers partnerships with diverse suppliers to prevent any abuses of human rights, such and employees. Government Relations promote their economic growth. Supplier as human trafficking or slavery, forced supports opportunities and activities to Inclusion & Development is integrated labor and child labor. promote diversity, inclusion, financial health within Global Procurement so we can and well-being of customers and communities interact with sourcing professionals and Although we believe governments hold in the markets in which we operate. The team business stakeholders to include diverse the primary responsibility for safeguarding also collaborates with MetLife’s Sustainability suppliers in our supply chain. As part of our and protecting human rights, we also Office by seeking opportunities to increase new DEI goals, MetLife has committed to believe that our corporate values compel our voice and engagement with regulators spending $5 billion with diverse suppliers by us to promote DEI and human rights and other stakeholders to advance MetLife’s 2030 and to annually report the economic within our businesses, in alignment with sustainability goals. impact of MetLife’s diverse supply chain. the International Labour Organization’s See 2030 DEI Commitments for more Declaration on Fundamental Principles information, and read more about our and Rights at Work. Supplier Inclusion & Development Read MetLife’s statement on program. human rights. MetLife joined WEConnect International to enable women business owners to compete in the global marketplace. WEConnect International creates opportunities for women-owned businesses to connect with qualified buyers around the world. As part of our membership, MetLife gains access to a global database of women-owned businesses, as well as resources to develop a diverse and inclusive global supply chain. 2021 SUSTAINABILITY REPORT 87
Sustainability For Our For Our Creating Value For the For Our Managing Appendix at MetLife Workforce Customers as an Investor Environment Communities Responsibly Appendix GLOSSARY > STAKEHOLDER ENGAGEMENT > AWARDS AND RECOGNITIONS > UN SUSTAINABILITY > DEVELOPMENT GOALS UN GLOBAL COMPACT INDEX > SASB INDEX > TCFD INDEX > GRI STANDARD INDEX > ESG SCORECARD > FORWARD-LOOKING STATEMENTS > 2021 SUSTAINABILITY REPORT 88
Sustainability For Our For Our Creating Value For the For Our Managing Appendix at MetLife Workforce Customers as an Investor Environment Communities Responsibly Glossary BeWell: A global physical, mental and emotional • Ethnic Minority Business Enterprises (MBEs) Environmental, Social and Governance (ESG): well-being program to convey a message of certified by the National Minority Supplier ESG is a common term now used to describe support and empathy for all of our employees Development Council (NMSDC) factors of corporate responsibility. For MetLife, through leadership engagement and outreach, • Women Business Enterprises (WBEs) certified corporate responsibility is about managing business virtual programs and the provision of relevant by the Women’s Business Enterprise National and responsibly delivering long-term value for all resources and tools. Council (WBENC) stakeholders, and sustainability is about achieving Carbon Neutrality: Carbon neutral, or carbon • Veteran and Service-Disabled Veteran Business a positive societal impact while improving the neutrality, means eliminating or offsetting all Enterprise (SDVBE) certified by National Veteran long-term sustainability of the company. greenhouse gas (GHG) emissions across a Business Development Council (NVBDC) Equity: Providing opportunities for everyone to company’s operations. For MetLife, in 2021, • Disability-Owned Business Enterprise (DOBE) progress in their careers at all levels, no matter this goal applied to GHG emissions from all of certified by Disability:IN their background. MetLife’s owned and leased properties across EMEA: A MetLife market acronym for Europe, the world, as well as its fleet of automobiles • LGBT Business Enterprise certified by National Middle East and African countries. (Scope 1 and 2 emissions). The goal also applies LGBT Chamber of Commerce (NGLCC) to the company’s employee business travel • Small businesses as defined by the federal EXCELERATE: MetLife’s talent sponsorship (Scope 3 emissions). government (SBA) program driven by the CEO and senior leaders. Carbon Offset: A tool for claiming “rights” Diverse Business Partner Spend: Payments made Exclusionary Investment Screening: The to carbon emissions reductions generated to third-party suppliers that qualify as Diverse exclusion of companies and/or sectors from an somewhere else in the world through the buying Business Partners, according to their diversity investment portfolio that contradict a client’s and selling of certificates representing a specific status at the respective year end, in exchange corporate or moral values. volume of emissions. To offset the GHG emissions for goods and services that are commercially Financial Wellness: Describes the state of that we cannot reduce in the short term, MetLife feasible for negotiation and are within Global one’s personal monetary affairs. There are many supports a diverse portfolio of third-party-certified Procurement’s scope according to its policy. dimensions to financial health, including the emissions-reduction and renewable energy amount of savings you have, how much you’re generation projects in countries where we operate Diversity: Leveraging our unique attributes putting away for retirement and how much around the world. MetLife seeks out and supports and perspectives. of your income you are spending on fixed or projects that empower local economies and align Energy Savings Performance Contracts non-discretionary expenses. with the United Nations Sustainable Development (ESPCs): Debt financings under which the U.S. Goals (UN SDGs). government, military or a government agency Fitwel: Created as a joint initiative led by the Diverse Business Partner: A business that is contracts with a service provider to install U.S. Centers for Disease Control and Prevention majority owned, operated and controlled by equipment. The high-efficiency equipment is (CDC) together with the General Services ethnic minorities, women, lesbian, gay, bisexual, comprised of lighting, windows, heating/cooling Administration (GSA), Fitwel provides guidelines transgender, queer-plus (LGBTQ+) individuals, equipment, plumbing fixtures or similar capital for designing, constructing and operating healthier people with disabilities or veterans, as well as improvements. Once installed, the equipment buildings. The Center for Active Design (CfAD) federally recognized small businesses. A diverse generates cost savings versus the equipment is the operator of Fitwel and responsible for the supplier is defined as a business that is at least replaced. The service provider raises debt capital third-party certification. 51% owned, operated and financially controlled to fund the capital expenditures, and the debt by one or more of the following: service is paid for the contracting government entity in the form of lower operating costs. 2021 SUSTAINABILITY REPORT 89
Sustainability For Our For Our Creating Value For the For Our Managing Appendix at MetLife Workforce Customers as an Investor Environment Communities Responsibly Funding Agreement-Backed Note Impact Investments: Investments made with the MetLife Investment Management (MIM): MIM (or Funding-Backed Security): Securities that intention to generate positive, measurable social is the institutional asset management business of are backed by a funding agreement, which is a and environmental impact alongside a financial MetLife. Inc. MIM provides public fixed income, deposit-type contract, issued by life insurance return (GIIN—Global Impact Investment private capital and real estate investment solutions companies, that promise a stream of predictable Network—definition). This activity includes both to institutional investors worldwide. fixed payments over a specified period of time. MetLife’s general account and a smaller volume of MetLife’s Purpose Awards: An exclusive, Gender Equality: The state in which access to MetLife Foundation assets. selection-based award recognizing colleagues rights or opportunities is unaffected by gender. Inclusion: Ensuring that through our interactions, who went to extraordinary efforts to bring our Gender Gap Analysis: An analysis of the relative everyone is fully respected, recognized and valued. purpose to life. disparity between people of different genders. Infrastructure: Includes infrastructure investments Municipal Bonds: Includes entire (public) Green Bonds: Includes public corporate green supporting airports, ports, transportation (roads, municipal bond portfolio for MetLife’s general bonds held within MetLife’s general account rail, bridges), transmission, energy management account and unaffiliated institutional asset and unaffiliated institutional asset management systems, social infrastructure (stadiums, housing, management clients—no exclusions. portfolios as identified by Bloomberg for all courthouses), data centers, metering, telecom and MyVoice: MetLife’s all-employee survey that green bond International Securities Identification water. Excludes: ESPCs, renewable investments, gives employees the opportunity to be heard Numbers (ISINs) issued in the global market. energy (pipelines, gas-fired generation) and more frequently on topics that are relevant to private prisons. our culture and business and measures the Greenhouse Gas Emissions (or Carbon International Labour Organization’s Declaration behaviors that drive our business strategy. Emissions): A GHG is any gas that has the on Fundamental Principles and Rights at Work: property of absorbing infrared radiation (net heat Adopted in 1998, the Declaration commits Member Net Zero: The balance between the amount of energy) emitted from Earth’s surface and reradiating States to respect and promote principles and rights GHGs produced and the amount removed from it back to Earth’s surface. Carbon dioxide, methane in four categories, whether or not they have ratified the atmosphere. and water vapor are examples of GHG gases. the relevant Conventions. These categories are: While sometimes used synonymously with “carbon MetLife reports all GHG gases in CO2 equivalents freedom of association and the effective recognition neutral,” a growing consensus behind “net zero” (CO2e). This is why sometimes “carbon emissions” is of the right to collective bargaining, the elimination is to reduce all identified emissions in value chains used as shorthand for describing all GHG emissions. of forced or compulsory labor, the abolition of and economies to zero as quickly as possible Green Investments: Investments in projects, child labor and the elimination of discrimination through technical, policy and behavioral change. infrastructure or companies that support or in respect of employment and occupation. The transition to a net zero emissions future focuses provide environmentally friendly products LATAM: A MetLife market acronym for Latin on reducing all emissions as much as possible, and practices. MIM currently defines green American countries. without the purchase offsets (see “carbon offset”) investments to include 1) LEED, Energy Star, that balance GHGs emitted elsewhere in the world BREEAM and/or Fitwel-certified real estate Leadership in Energy and Environmental Design through activities such as burning fossil fuels. equity investments; 2) commercial mortgage (LEED): An internationally recognized green building Our Green Impact: MetLife’s signature loans secured by LEED and/or Energy Star certification system, providing third-party verification environmental employee engagement program certified real estate; 3) renewable energy that a building or community was designed and that aims to promote environmental awareness projects, including wind and solar; 4) energy built using strategies aimed at improving performance across the global enterprise and empowers savings performance contracts (ESPCs); 5) across energy savings, water efficiency, CO2 employees to reduce environmental impact public and private corporate green bonds; emissions reduction, improved indoor environmental at work, at home and in our communities. and 6) property assessed clean energy (PACE) quality, stewardship of resources and sensitivity to residential and commercial loans. their impacts. 2021 SUSTAINABILITY REPORT 90
Sustainability For Our For Our Creating Value For the For Our Managing Appendix at MetLife Workforce Customers as an Investor Environment Communities Responsibly Paris Agreement: A legally binding international Responsible Investments: Investments that intend United Nations (UN) Global Compact: treaty on climate change. The agreement’s to achieve both a market financial return and A voluntary initiative based on CEO commitments goal is to limit global warming to well below 2, promote social and/or environmental benefits. to implement universal sustainability principles to preferably to 1.5, degrees Celsius, compared to Responsible investments at MetLife include green take steps to support UN goals. pre-industrial levels. investments, infrastructure, municipal bonds, UN Global Compact’s Target Gender Pay Equity: Providing equal pay for equal work. affordable housing and impact investments. Equality Initiative: A gender equality accelerator Preferred Provider Organization (PPO): Sustainable Financing Framework: Guidance for program for participating companies of the UN A type of health plan that contracts with medical future issuances of green, social and sustainable Global Compact. providers, such as hospitals and doctors, to bonds, term loans, preferred stock, subordinated Unit-Linked Insurance Plan: A multi-faceted create a network of participating providers. notes and funding agreements (each a “MetLife product that offers both insurance coverage and Sustainable Financing”) by MetLife, Inc. and investment exposure in equities or bonds. Principles of Responsible Investment (PRI): its subsidiaries, including Metropolitan Life The six Principles for Responsible Investment are Insurance Company and Metropolitan Tower UN Sustainable Development Goals (SDGs): a voluntary and aspirational set of investment Life Insurance Company. The 2030 Agenda for Sustainable Development, principles that offer a menu of possible actions Total Compensation: With respect to a year, adopted by all United Nations Member States in for incorporating ESG issues into investment the total of base salary earnings during the year, 2015, provides a shared blueprint for peace and practice. The Principles were developed by annual incentive awards for performance in that prosperity for people and the planet, now and investors, for investors. In implementing them, year, stock-based long-term incentive awards into the future. At its heart are the 17 SDGs, which signatories contribute to developing a more in consideration of performance in that year are an urgent call for action by all countries— sustainable global financial system. and potential for future contributions. Items developed and developing—in a global partnership. Private Sector Alliance to Promote Financial such as sign-on payments and others that the UN Women’s Empowerment Principles: A set Inclusion: An initiative to develop collaborative Compensation Committee recommends, but of principles offering guidance to business on business models that help companies do well which are not determined under the company’s how to promote gender equality and women’s financially, and to expand inclusion and financial general executive compensation framework, empowerment in the workplace, marketplace health for underserved customer segments. are not included. Retirement benefits, medical and community. Pro Bono Services: Professional work programs and potential termination payments U.S. Department of Energy’s Better Building undertaken voluntarily and without payment. are also not included. Challenge: An initiative to encourage institutions Prudent Risk Management: A legal obligation to Total Compensation Framework: The sum of to improve building energy efficiency by at least 20% always act with the responsibilities, care and skill wages and benefits paid to employees. over 10 years and share their strategies and results. of a person showing ordinary prudence. U.K. Social Housing Investments: Includes U.S. Low-Income Housing Tax Credit Real Estate Equity: Includes LEED-, Energy Star- social housing providers in the U.K. and overseas Investments: Includes federal tax credit equity and Fitwel-certified real estate equity investments. territories through investments in nonprofit investments financing affordable rental housing organizations that provide rental homes at below- and state tax credit investments that are made Renewable Energy Sources: These include solar, market rents to low-income earners, including with substantially similar requirements. Affordable wind, hydropower, biomass, geothermal resources teachers, nurses, council workers and the elderly units in a project may charge no more than 30% and hydrogen derived from renewable resources. and infirm (privates). of a household’s income, and the average income of all households in assisted units is 60% of area median income or below. 2021 SUSTAINABILITY REPORT 91
Sustainability For Our For Our Creating Value For the For Our Managing Appendix at MetLife Workforce Customers as an Investor Environment Communities Responsibly Stakeholder Engagement MetLife engages with a broad array of stakeholders on a regular basis. We deeply value the time and diverse input we receive from our stakeholders and the opportunities for two-way dialogue. Stakeholder group Nature of engagement Frequency Board of Directors In-person meetings and other direct engagement. In 2021, the Board held five meetings, and Board Committees held a total of 32 meetings. Additional interactions with Board members occur on an ongoing basis throughout the year. Employees MetLife engages with our employees on an ongoing basis, including through new-hire Consistent, ongoing, daily information and trainings, annual and other periodic surveys, internal communications, our intranet, dialogue throughout the year. social media and on-site events. We also host a multitude of open forums such as Town Halls with Senior Leaders, Coffee Hour check-ins and others. Customers and MetLife engages with customers throughout the year through a multitude of channels, Ongoing with consistent and sustained open prospective customers including direct outreach and in-person and virtual conversations. dialogue throughout the year. Investors/shareholders MetLife engages with investors and shareholders in multiple ways, including annual Ongoing with consistent and sustained open filings and reports, presentations, media and direct engagements throughout the year. dialogue throughout the year. Prospective employees MetLife’s primary channels of engagement with recruits are through social media, Occurs regularly on an ongoing basis. annual reports and our recruitment efforts. NGOs MetLife engages with NGOs on a regular basis in a variety of ways, including social MetLife maintains ongoing dialogue with media, in-person meetings and virtual sessions. numerous NGOs. Suppliers and MetLife engages our suppliers through annual scorecards, newsletters, events, training Engagement occurs on a regularly occurring business partners and year-round virtual correspondence. basis—both through project work and other means. Governments MetLife’s engagement with government occurs on a continual basis at international, Occurs regularly on an ongoing basis. national and local levels. Communities MetLife engages with our communities through MetLife Foundation-led activities, Occurs regularly on an ongoing basis. volunteerism and social media, as well as events. 2021 SUSTAINABILITY REPORT 92
Sustainability For Our For Our Creating Value For the For Our Managing Appendix at MetLife Workforce Customers as an Investor Environment Communities Responsibly Awards and Recognitions WORKFORCE COMMUNITY • Pensions & Investments’ Best Place to Work in • Crain’s 2021 Notable Businesses Championing • U.S. President’s Volunteer Service Award— Money Management (MIM) Diversity and Inclusion (MetLife Legal Plans) Gold, awarded by Junior Achievement • Seramount’s Inclusion Index, Best Companies • Bloomberg’s Gender Equality Index (seventh consecutive award; sixth for Multicultural Women, Top Companies (7th consecutive year) consecutive gold) for Executive Women (for the 14th time), • Hispanic Association of Corporate GOVERNANCE 100 Best Companies for Working Parents Responsibility (HACR) Award for Corporate and Best Companies for Dads • Dow Jones Sustainability Index Inclusion (10th consecutive year) • LATINA Style’s 50 Best Companies for Latinas CUSTOMERS • FORTUNE’s World’s Most Admired to Work for in the U.S. Companies List • Military Friendly Employer and • J.D. Power: “An Outstanding Customer Service • JUST 100 List of Best Corporate Citizens Military Friendly Spouse Employer Experience” for Phone Support (MetLife Retirement & Income Solutions Customer • Newsweek’s Most • Dave Thomas Foundation’s America’s Best Solutions Center) Responsible Companies Adoption-Friendly Workplaces • EcoVadis Silver Score ENVIRONMENT • Energy Star Partner of the Year— • American Association of People with Sustained Excellence Award Disabilities and Disability:IN’s Best Place to • Fortune 50 member of EPA Green Power Work for Disability Inclusion Purchaser Program • Human Rights Campaign’s Best Place to • LEED Gold Recognition for UAE retail office Work for LGBTQ Equality (100% for the and LEED Certification in Providencia, Chile 18th consecutive year) • 5-star ratings from the Global Real Estate Sustainability Benchmark for two of MIM’s real estate partnership funds 2021 SUSTAINABILITY REPORT 93
Sustainability For Our For Our Creating Value For the For Our Managing Appendix at MetLife Workforce Customers as an Investor Environment Communities Responsibly UN SDGs MetLife’s sustainability efforts focus on prioritizing five of the 17 UN SDGs, given their relevance to MetLife’s business. We leverage our products and services, workforce, investments and community to drive progress of these five SDGs. Goal How we support the goals MetLife was built to help people through stressful times, and as today’s society continues to grapple with growing financial, mental, social and physical concerns, we are a leader in providing benefits that address evolving needs and expectations. • Provided more than a quarter of a billion total dollars of relief to help people around the world cope with the impacts of COVID-19—through premium 1 credits and contributions from MetLife and MetLife Foundation • Expanded 360Health app to serve Bangladesh, providing free doctor consultations, specialist doctor appointments, online medicine ordering, health assessments and many other features for members; 360Health has already benefited our customers’ health in Australia, China and Korea for several years • Expanded the BeWell program, which supports the physical, mental, social and financial well-being of MetLife employees through outreach, virtual program and other resources We pay out tens of billions of dollars in benefits every year to help create a more confident world for everyone, including enabling more resilient, economically thriving communities. • Paid out approximately $35 billion in claims and benefits to customers. We’ve paid more than $80 billion in group life insurance in the U.S. over the last decade 2 • MetLife’s general account totals nearly half a trillion dollars and provides a vital source of capital for long-term economic growth and job creation • Raised minimum wage to $20 per hour for all U.S. employees • Launched MyPath, a global platform to foster internal talent mobility and career opportunities • Since its founding in 1976, MetLife Foundation has contributed over $900 million to strengthen communities, with its financial health work reaching 17.3 million low- and moderate-income individuals in 42 markets 1. AS OF DECEMBER 31, 2020. 2. FOR DEFINITION OF GENERAL ACCOUNT, PLEASE SEE EXPLANATORY NOTE ON PAGE 149. 2021 SUSTAINABILITY REPORT 94
Sustainability For Our For Our Creating Value For the For Our Managing Appendix at MetLife Workforce Customers as an Investor Environment Communities Responsibly UN SDGs Goal How we support the goals 1 We are proud to be a carbon neutral company—a status we’ve maintained since 2016—and we continue to build on that work with 11 climate goals for 2030, which include reducing GHG emissions across our operations and supply chain and using responsible investments to advance clean energy projects and green financing. 2 • Reduced GHG emissions by 21% between 2020 and 2021 3 • Committed to net zero GHG emissions for our global operations and general account investment portfolio by 2050 or sooner • Planted more than 200,000 trees around the world since 2020 • MetLife Foundation donated grants worth more than $1 million total since 2020 as part of our climate goal to contribute $10 million by 2030 4 • Originated more than $6 billion of new MIM-managed green investments , bringing total progress toward our $20 billion goal to nearly $10 billion We are taking action to create greater leadership commitment and accountability, deepen our understanding of equity and equality and enhance our ability to lead inclusively in the future. 5 6 7 • Achieved top-quartile performance for DEI across each ethnically and racially diverse category in the U.S. and for female officers globally, compared with other companies in our industry • Women represented 38% of MetLife’s Board of Directors5 as of April 2022 • Joined the UNGC’s Target Gender Equality Initiative, a gender-equality accelerator program for companies that have signed on to the UNGC • Joined the Human Rights Campaign’s Business Coalition for the Equality Act and signed the Business Statement on Anti-LGBTQ State Legislation • Established a comprehensive suite of public-facing long-term DEI goals for 2030 9 • MetLife Foundation completed its three-year, $5 million commitment to support racial equity in 2022 8 • Engaged with over 200 Diverse Business Partners, spending approximately $3.5 billion since the inception of our Supplier Inclusion and 10 Development Program in 2003 • MetLife Foundation committed to expanding opportunities for women and girls through partnerships that support financial health programs, careers in technology and entrepreneurship 1. METLIFE’S GOALS FOR GHG EMISSIONS AND CARBON NEUTRALITY APPLY TO ALL OF ITS OWNED AND LEASED OFFICES ACROSS THE WORLD, ITS FLEET OF AUTOMOBILES (SCOPE 1 AND 2 EMISSIONS) AND ITS EMPLOYEE BUSINESS TRAVEL (SCOPE 3 EMISSIONS). 2. GHG REDUCTIONS WERE IN PART DUE TO REDUCTIONS IN BUSINESS TRAVEL DUE TO THE COVID-19 PANDEMIC. 3. THE NET ZERO COMMITMENT APPLIES TO GHG EMISSIONS FROM METLIFE, INC.’S OWNED AND LEASED OFFICES ACROSS THE WORLD, AUTOMOBILE FLEETS, EMPLOYEE BUSINESS TRAVEL AND ASSETS IN METLIFE’S GENERAL ACCOUNT INVESTMENT PORTFOLIO, WHICH INCLUDES THE GENERAL ACCOUNTS OF METLIFE, INC.’S WHOLLY OWNED INSURANCE COMPANY SUBSIDIARIES, WHERE DATA AND METHODOLOGIES ARE AVAILABLE. EMISSIONS ARE TRACKED AND REPORTED IN ACCORDANCE WITH THE GREENHOUSE GAS PROTOCOL. READ MORE ABOUT METLIFE’S CLIMATE COMMITMENTS ONLINE. LEARN ABOUT METLIFE’S GENERAL ACCOUNT INVESTMENT PORTFOLIO ONLINE. 4. FOR A DEFINITION AND ADDITIONAL INFORMATION REGARDING METLIFE’S GREEN INVESTMENTS, PLEASE SEE PAGE 90. 5. WHEN COMPARED TO PEERS IN INDUSTRY BENCHMARKS. 6. DIVERSE CATEGORIES INCLUDE BLACK/AFRICAN AMERICAN; LATINO/HISPANIC; ASIAN; MULTIRACIAL. 7. THE OFFICER POPULATION IS A SUBSET OF OVERALL MANAGEMENT THAT IS A REFLECTION OF THE LEADERSHIP OF THE ORGANIZATION. IT IS COMPRISED OF ALL METLIFE EMPLOYEES AT THE VICE PRESIDENT LEVEL OR ABOVE. 8. DIVERSE BUSINESS PARTNER MEANS MAJORITY OWNED, OPERATED AND CONTROLLED BY ETHNIC MINORITIES, WOMEN, LGBTQ INDIVIDUALS, PEOPLE WITH DISABILITIES, OR VETERANS, AS WELL AS FEDERALLY RECOGNIZED SMALL BUSINESSES. 9. THIS INCLUDES A $1 MILLION COMMITMENT TO THE UNITED NEGRO COLLEGE FUND TO HELP FINANCE SCHOLARSHIPS AT HISTORICALLY BLACK COLLEGES AND UNIVERSITIES. 10. DUE TO THE LONG HISTORY OF THE PROGRAM, SPEND FIGURES FROM 2003 THROUGH 2007 ARE APPROXIMATED. 2021 SUSTAINABILITY REPORT 95
Sustainability For Our For Our Creating Value For the For Our Managing Appendix at MetLife Workforce Customers as an Investor Environment Communities Responsibly UN Global Compact Index UN GC Principle Reference Human Rights Principle 1: Businesses should support and respect the protection of Letter from Our CEO internationally proclaimed human rights; and Sustainability at MetLife >> Recent Highlights in Alignment with the UN SDGs For Our Workforce >> Global Diversity, Equity and Inclusion >> Our DEI Commitments Principle 2: Make sure that they are not complicit in human rights abuses. Are Public Facing and Strategically Aligned Creating Value as an Investor >> MetLife Investment Management >> ESG Integration in Agricultural Lending Managing Responsibly >> Governance; Supplier Management; Human Rights MetLife’s Statement on Human Rights MetLife’s Code of Business Ethics MetLife Supplier Code of Business Ethics MetLife Signs UN Women’s Empowerment Principles MetLife Ethics and Fraud HelpLine Privacy Compliance Program Labor Principle 3: Businesses should uphold the freedom of association and the Letter from Our CEO effective recognition of the right to collective bargaining; Sustainability at MetLife >> Recent Highlights in Alignment with the UN SDGs; Sustainability Goals and Progress Principle 4: The elimination of all forms of forced and compulsory labor; For Our Workforce >> Global Diversity, Equity and Inclusion >> Our DEI Commitments Principle 5: The effective abolition of child labor; and Are Public Facing and Strategically Aligned Creating Value as an Investor >> MetLife Investment Management >> ESG Integration Principle 6: The elimination of discrimination in respect of employment in Agricultural Lending and occupation. Managing Responsibly >> Governance; Supplier Management; Human Rights MetLife’s Statement on Human Rights MetLife’s Code of Business Ethics MetLife Supplier Code of Business Ethics MetLife Slavery & Human Trafficking Statements MetLife on Pay Equity 2021 SUSTAINABILITY REPORT 96
Sustainability For Our For Our Creating Value For the For Our Managing Appendix at MetLife Workforce Customers as an Investor Environment Communities Responsibly UN Global Compact Index UN GC Principle Reference Environment Principle 7: Businesses should support a precautionary approach to Sustainability at MetLife >> Recent Highlights in Alignment with the UN SDGs; environmental challenges; Sustainability Goals and Progress Principle 8: Undertake initiatives to promote greater environmental Creating Value as an Investor >> MetLife Investment Management >> ESG Integration; responsibility; and Responsible Investments For the Environment Principle 9: Encourage the development and diffusion of environmentally Managing Responsibly >> Risk Management >> Managing Climate Risks friendly technologies. CDP Climate Change Response 2021 2021 TCFD Report Anti-Corruption Principle 10: Businesses should work against corruption in all its forms, including Sustainability at MetLife >> Recent Highlights in Alignment with the UN SDGs extortion and bribery. Managing Responsibly MetLife’s Code of Business Ethics 2021 SUSTAINABILITY REPORT 97
Sustainability For Our For Our Creating Value For the For Our Managing Appendix at MetLife Workforce Customers as an Investor Environment Communities Responsibly SASB Index MetLife is reporting to the SASB Standards to bring industry-specific rigor to our sustainability disclosure. We are reporting to the two Financials Sector Standards most closely aligned with our business: Asset Management & Custody Activities and Insurance. All data is as of December 31, 2021. SASB—Sustainability Accounting Standards Board Transparent Information & Fair Advice for Customers Code/Metric Response/Reference FN-AC-270a.1, (1) Number and (2) percentage of covered employees For MetLife’s disclosure on material legal proceedings, other than ordinary routine litigation incidental with a record of investment-related investigations, consumer-initiated to the business, see Note 21 of the 2021 Form 10-K and Note 14 of the 1Q22 Form 10-Q. complaints, private civil litigations, or other regulatory proceedings FN-AC-270a.2, Total amount of monetary losses as a result of legal For MetLife’s disclosure on material legal proceedings, other than ordinary routine litigation incidental proceedings associated with marketing and communication of financial to the business, see Note 21 of the 2021 Form 10-K and Note 14 of the 1Q22 Form 10-Q. product-related information to new and returning customers FN-AC-270a.3, Description of approach to informing customers about For summary information regarding our business overview and the major products we offer, see products and services 2021 Form 10-K, Item 1. Business. Employee Diversity & Inclusion Code/Metric Response/Reference FN-AC-330a.1, Percentage of gender and racial/ethnic group For Our Workforce >> Global Diversity, Equity and Inclusion representation for (1) executive management, (2) non-executive management, (3) professionals, and (4) all other employees 2021 SUSTAINABILITY REPORT 98
Sustainability For Our For Our Creating Value For the For Our Managing Appendix at MetLife Workforce Customers as an Investor Environment Communities Responsibly SASB Index SASB—Sustainability Accounting Standards Board Incorporation of Environmental, Social and Governance Factors in Investment Management & Advisory Code/Metric Response/Reference FN-AC-410a.1, Amount of assets under management, by asset class, 1. MIM is pr edominately a global fixed income and real estate investment manager. Approximately that employ 3% of our overall AUM is held in index equity funds and other limited equity investments. Our (1) integration of environmental, social, and governance (ESG) issues, public equity investments are almost exclusively comprised of index strategies. MIM is a passive (2) sustainability themed investing, and (3) screening index investor. As of December 31, 2021, we estimate that approximately $646.8 billion of assets employ ESG integration efforts (See Creating Value as an Investor). 2. $82.9 billion in responsible investments (see Creating Value as an Investor >> Responsible Investments for more). 3. MIM applies specific guidelines as requested by our clients and client-directed investment screens into our investment process, as applicable. FN-AC-410a.2, Description of approach to incorporation of MIM ESG Investment Policy >> Our Approach to Environmental, Social and Governance (ESG) environmental, social, and governance (ESG) factors in investment and/ Considerations (page 2). or wealth management processes and strategies Creating Value as an Investor >> MetLife Investment Management >> ESG Integration 2021 SUSTAINABILITY REPORT 99
Sustainability For Our For Our Creating Value For the For Our Managing Appendix at MetLife Workforce Customers as an Investor Environment Communities Responsibly SASB Index SASB—Sustainability Accounting Standards Board Incorporation of Environmental, Social and Governance Factors in Investment Management & Advisory (continued) Code/Metric Response/Reference FN-AC-410a.3, Description of proxy voting and investee engagement Proxy Voting policies and procedures MIM has implemented policies and procedures (the Proxy Policies) that govern how it votes proxies. The Proxy Policies have been designed to ensure that client securities are voted in the best interests of clients in accordance with applicable rules. The Proxy Policies are based on the guiding principle of maximization of economic value of client holdings. MIM does not permit voting decisions to be influenced in any manner that is contrary to, or dilutive of, this guiding principle. The Proxy Policies are designed to ensure that material conflicts of interest on the part of MIM or its affiliates do not affect voting decisions on behalf of clients. Based on the guiding principle that all votes made by MIM on behalf of its clients must be made in the best interest of the clients and with the intent to maximize the economic value of clients’ securities holdings, MIM has adopted proxy voting guidelines (the Guidelines) that set forth how it plans to vote on specific matters presented for shareholder vote. MIM has retained Institutional Shareholder Services (ISS) recommended proxy voting guidelines to monitor and vote proxies. MIM, however, may deviate from the Guidelines with respect to a particular shareholder vote when such action is consistent with the guiding principle of seeking the maximum economic value to clients, taking into consideration all relevant facts and circumstances at the time of the vote. Prior to deviating from the Guidelines, MIM’s Proxy Committee, which is comprised of senior investment personnel, and legal and compliance personnel, must first determine whether there is any material conflict of interest between MIM (or any of its affiliates) and clients. ISS monitors client accounts and their holdings to be sure that all proxies are received and voted. Should a proxy arise that is not covered by the Guidelines, ISS will be directed to vote in a manner approved MIM’s Proxy Committee. In addition, MIM’s Proxy Committee regularly monitors matters presented for shareholder vote and tracks the voting of the proxies. Engagement MIM ESG Engagement Policy 2021 SUSTAINABILITY REPORT 100
Sustainability For Our For Our Creating Value For the For Our Managing Appendix at MetLife Workforce Customers as an Investor Environment Communities Responsibly SASB Index SASB—Sustainability Accounting Standards Board Business Ethics Code/Metric Response/Reference FN-AC-510a.1, Total amount of monetary losses as a result of legal For MetLife’s disclosure on material legal proceedings, other than ordinary routine litigation incidental proceedings associated with fraud, insider trading, anti-trust, anti- to the business, see Note 21 of the 2021 Form 10-K and Note 14 of the 1Q22 Form 10-Q. competitive behavior, market manipulation, malpractice, or other related financial industry laws or regulations FN-AC-510a.2, Description of whistleblower policies and procedures MetLife has an Ethics and Fraud Helpline and local whistleblowing policies and procedures in certain countries. Anyone can raise a concern anonymously, to the extent permitted by law, through the Ethics and Fraud helpline which is managed by a third party and made available in 14 languages. In addition, MetLife Japan attained Whistleblowing Compliance Management System (WCMS) Certification. WCMS was introduced by the Consumer Affairs Agency in February 2019. Under this system, businesses evaluate their own whistleblowing system in accordance with the examination standards specified by the Consumer Affairs Agency and apply for registration through a designated registration institution. As of the writing of this report, 133 companies (of which 19 are insurance companies) are registered. We are hoping that this certification will raise the level of comfort for employees to be able to raise concerns. Systemic Risk Management Code/Metric Response/Reference FN-AC-550a.1, Percentage of open-end fund assets under management As of December 31, 2021 ($ millions) by category of liquidity classification 1 Total Invested Assets & Cash Highly liquid 79.8% Moderately liquid 2.5% Less liquid 17.7% 100.0% 1 Institutional Client AUM Highly liquid 0.0% Moderately liquid 2.8% Less liquid 97.2% 100.0% 1 Open-end funds (including mutual funds) are a portion of the general account Total Invested Assets & Cash and Institutional Client Assets Under Management. Represents the portion of such open-end funds that are expected to be convertible into cash in up to three days (highly liquid); in more than three days but seven days or less (moderately liquid), or longer (less liquid). 2021 SUSTAINABILITY REPORT 101
Sustainability For Our For Our Creating Value For the For Our Managing Appendix at MetLife Workforce Customers as an Investor Environment Communities Responsibly SASB Index SASB—Sustainability Accounting Standards Board Systemic Risk Management (continued) Code/Metric Response/Reference FN-AC-550a.2, Description of approach to incorporation of liquidity risk For information regarding the company’s liquidity, see Item 7 of 2021 Form 10-K >> Liquidity and management programs into portfolio strategy and redemption Capital Resources, as well as Item 1A—Risk Factors for information about the company’s risks. risk management Managing Responsibly >> Risk Management FN-AC-550a.3, Total exposure to securities financing transactions Total secured financing type transactions For information regarding Securities Lending and Repurchase Agreements, see Note 8 of 2021 Form 10-K. Total commitments to lend and fund For information regarding Mortgage Loan Commitments and Commitments to Fund Partnership Investments, Bank Credit Facilities, Bridge Loans and Private Corporate Bond Investments, see Note 21 of 2021 Form 10-K. FN-AC-550a.4, Net exposure to written credit derivatives For information regarding Primary Risks Managed by Derivatives >> Credit Default Swaps >> Written, see Note 9 of 2021 Form 10-K FN-AC-000.A, (1) Total registered and (2) total unregistered assets Registered Unregistered Total AUM under management (AUM) (in millions) AUM AUM General Account AUM $ 12,961 $ 475,053 $ 488,014 Institutional Client AUM 61,712 119,304 181,016 Total Registered Assets and Unregistered Assets $74,673 $594,357 $669,030 2021 SUSTAINABILITY REPORT 102
Sustainability For Our For Our Creating Value For the For Our Managing Appendix at MetLife Workforce Customers as an Investor Environment Communities Responsibly SASB Index SASB—Sustainability Accounting Standards Board Transparent Information & Fair Advice for Customers Code/Metric Response/Reference FN-AC-000.B, Total assets under custody and supervision Total assets under custody and supervision are $699,228 million comprised of Total Invested 1 Assets & Cash of $518,212 million plus Institutional Client AUM of $181,016 million. 1 Represents Total Investments plus Cash and Cash Equivalents of MetLife, Inc. at carrying value. FN-IN-270a.1, Total amount of monetary losses as a result of legal For MetLife’s disclosure on material legal proceedings, other than ordinary routine litigation incidental proceedings associated with marketing and communication of insurance to the business, see Note 21 of the 2021 Form 10-K and Note 14 of the 1Q22 Form 10-Q. product-related information to new and returning customers FN-IN-270a.1, Complaints-to-claims ratio For MetLife’s disclosure on material legal proceedings, other than ordinary routine litigation incidental to the business, see Note 21 of the 2021 Form 10-K and Note 14 of the 1Q22 Form 10-Q. FN-IN-270a.3, Customer retention rate For summary information regarding our business overview and the major products we offer, see 2021 Form 10-K, Item 1. Business. 2021 SUSTAINABILITY REPORT 103
Sustainability For Our For Our Creating Value For the For Our Managing Appendix at MetLife Workforce Customers as an Investor Environment Communities Responsibly SASB Index SASB—Sustainability Accounting Standards Board Transparent Information & Fair Advice for Customers (continued) Code/Metric Response/Reference FN-IN-270a.4, Description of approach to informing customers Employer voluntary benefit insurance products about products MetLife’s employee voluntary benefit insurance products and services are available to businesses with two or more employees via our FINRA-licensed sales team. We provide existing and potential customers with information about products, services and third-party relationships via web pages, webinars, presentations, conferences, videos, newsletters, thought leadership reports, articles and electronic or printed materials. The development and review of materials includes legal, product subject matter experts, and compliance and marketing teams to ensure compliance, accuracy and clarity, and following of regulatory filing standards where appropriate and applicable, based upon various regulating agencies and bodies, such as state departments of insurance, and FINRA and ERISA guidelines for marketing material and plan filings. Information may include specific product details, features, disclaimers, exclusions, and other terms and conditions, as well as general information about MetLife’s brand, corporate functions and financial performance. Custom communication campaigns MetLife is committed to developing custom Group Benefits communications campaigns tailored for each employer, aimed to drive awareness, education and participation. We recommend an omnichannel communications strategy, increasing focus on digital delivery and using offline channels as an important secondary channel. Integrating messages across these channels creates a surround-sound effect that enhances the employee experience. We also have deep experience in building compelling communications for digital channels such as Twitter, LinkedIn, Facebook, microsites, online benefits fairs and emails—and we partner with each employer to craft a step-by-step plan to meet employee’s needs and habits. Communication tactics Product enrollment and service communications plans include: • P ersonalized enrollment kits mailed to employees’ homes, in addition to announcement and reminder email communications. • Custom Micr osite to serve as an educational resource center that all employees can access. • E mployee video(s) to highlight the product details, the need for each benefit, plan benefits and enrollment instructions. • B enefit Decision Guide to help employees evaluate benefit needs by highlighting the value of each benefit and what employees should consider when evaluating their individual and loved one’s needs. 2021 SUSTAINABILITY REPORT 104
Sustainability For Our For Our Creating Value For the For Our Managing Appendix at MetLife Workforce Customers as an Investor Environment Communities Responsibly SASB Index SASB—Sustainability Accounting Standards Board Transparent Information & Fair Advice for Customers (continued) Code/Metric Response/Reference FN-IN-270a.4, Description of approach to informing customers In-person and/or virtual benefit support and trainings: about products • V irtual benefit fairs: Hosted by qualified benefit counselors available through either a platform hosted by the employer or through a WebEx or teleconference that MetLife hosts. • W ebinars: Live product presentations to employees with options for Q&A, recording, camera, chat, polls and engagement activities. • B rainshark presentations: Customized presentations with “voice over” audio that highlight the benefits available. • HR team tr aining sessions: Product training to HR representatives, typically through webcast, focused on our products and highlights of the specific plan design as well as frequently asked questions from employees. During annual enrollment, MetLife provides real-time support through virtual engagement such as chatting via a webinar, responding to questions submitted through a MetLife microsite or calling during set office hours. • W e also accommodate requests for print material and giveaways, if needed. • Social M edia: Custom-designed specifically for employers to drive awareness of the plan, direct employees to educational resources and highlight the need for the plan. • Coor dinator Support: Custom training, Brochures, FAQs, Infographics and more. • N ew Hire Communications: With employers’ approval, MetLife mails all new hires at the time of employment with communication that congratulates them on their new position, provides them with details about each benefit, the plan, and gives them enrollment information and timeline. • Call Cen ter and Operations: Inbound calls for specific questions or support and/or confirmation of account changes, such as beneficiaries. • F requency of communications depends on the product, employer’s enrollment period, audience and nature of communications. Retirement & Income Solutions (RIS): Product and service communications occur through five primary channels: 1. F ace-to-face, e.g., Sales and Customer Support Teams: sales enablement collateral that includes presentation decks and slip sheets. 2. W eb: A section for each RIS LOB with specific details on products, services, market insights and support materials. 3. Conferences/events and webinars: Topically focused and typically delivered via panel discussion, sponsored segment or hosted WebEx. 2021 SUSTAINABILITY REPORT 105
Sustainability For Our For Our Creating Value For the For Our Managing Appendix at MetLife Workforce Customers as an Investor Environment Communities Responsibly SASB Index SASB—Sustainability Accounting Standards Board Transparent Information & Fair Advice for Customers (continued) Code/Metric Response/Reference FN-IN-270a.4, Description of approach to informing customers 4. Digital: Email, social (primarily LinkedIn) and banner/display covering both direct outreach, about products such as with email, and targeted communications. 5. Call Center and Operations: Inbound calls for specific questions or support and outbound communications that are primarily direct mail and take the form of regulatory notifications, benefit enrollment kits or confirmation of account changes such as beneficiaries. The frequency of communication depends on the line-of-business, audience and the nature of communications. RIS is financially regulated due to its nature of products and adheres to ERISA requirements for specific product lines (e.g., with Institutional Income Annuities that are within a 401(k)). As such, all communications regardless of channel or format are legally reviewed following a defined internal process and strict adherence to regulatory requirements, including risk/legal disclosures and no investment advice. There is also ongoing training and monitoring of communications such as with FINRA registered agents. MetLife Investment Management (MIM) Product and service communications occur through five primary channels: • F ace-to-face, e.g., Sales and Customer Support Teams: Sales enablement collateral includes presentation decks and slip sheets. There is usually one standard deck per investment capability. With sales taking anywhere from six months to three years on average, the number of meetings held depends on the prospect. However, usually at least three meetings with the sales team and investment team occur in addition to RFP reviews and final presentation to the investment committee where Sales, Investments, Compliance and Operations present processes and answer questions. These meetings are also forums to discuss potential investment, operational and compliance risks, and how they are monitored. Investment consultants play a big part by acting as intermediaries in 75% of the deals in the U.S. Therefore, MIM follows a path of informing investment consultants about our products, and they assign a buy, hold, sell rating to the products. Prospects who use an investment consultant usually only buy from us if our product is rated a buy by their investment consultant. MIM (through its appropriate legal entities) sells its investment capabilities in the U.S., Canada, EMEA, Japan, Korea, Hong Kong, Singapore, Malaysia and a few other Asian countries. • W eb (MIM): Separate sections for each MIM LOB provide details on the value proposition for each product, investment team members and support materials. We also have sections on thought leadership divided by LOB and a section on ESG. 2021 SUSTAINABILITY REPORT 106
Sustainability For Our For Our Creating Value For the For Our Managing Appendix at MetLife Workforce Customers as an Investor Environment Communities Responsibly SASB Index SASB—Sustainability Accounting Standards Board Transparent Information & Fair Advice for Customers (continued) Code/Metric Response/Reference FN-IN-270a.4, Description of approach to informing customers • Con ferences/events and webinars: Topically focused and typically delivered via panel about products discussion, sponsored keynote address or hosted via ON24 or, if sponsored, via the host’s platform. A key part of the in-person conferences is networking done by our sales team (we refer to them as the Institutional Client Group). At conferences, they learn about the prospect’s asset allocation and which asset classes they are currently looking at. Then if we have an investment capability that matches their needs, the salesperson will set up a time to meet after the conference to continue the discussion. • D igital: Email, social (only LinkedIn) and banner/display covers both direct outreach, such as with email and targeted communications. • Advertising: In addition to the banner/display digital advertising, we also do some print advertising. The frequency of communication depends on the line-of-business, audience and nature of communications. During the Sales process, if a client is actively looking to buy investment capabilities in a certain asset class, then the communication could be once every month, whereas if the prospect is just researching and taking their time, then the communication may be once a quarter. Once the prospect is a client, then there is significant communication as they are onboarded and then receive reporting approximately once a month. We are currently implementing a client portal where clients can access all their accounts in one place and have full transparency into their account. We understand that full transparency related to what is happening in the market, what is driving performance and what is occurring in the investment portfolio is key. These communications are typically conducted via reporting on a frequency demanded by the client (weekly, monthly, quarterly). We also work with clients on quarterly portfolio reviews. Additionally, MIM is regulated by the SEC and FINRA in the U.S. and by the local regulator in each of the regions it operates. We must have all communications and marketing materials reviewed by the investment compliance team to ensure all information is transparent and not misleading in any way. These materials are reviewed following a defined internal process and strictly adhere to regulatory requirements, including risk/legal disclosures. MIM members undergo ongoing 1 training and monitoring of communications such as with FINRA registered agents. 1. MIM is dedicated to the institutional investor channel. We do not provide investment capabilities for retail investors. 2021 SUSTAINABILITY REPORT 107
Sustainability For Our For Our Creating Value For the For Our Managing Appendix at MetLife Workforce Customers as an Investor Environment Communities Responsibly SASB Index SASB—Sustainability Accounting Standards Board Incorporation of Environmental, Social and Governance Factors in Investment Management Code/Metric Response/Reference FN-IN-410a.1, Total invested assets, by industry and asset class As of December 31, 2021 ($ Millions) 1 Total Invested Assets and Cash Fixed maturity securities available-for-sale: U.S. and foreign corporate $ 156,674 Foreign government 61,609 U.S. government and agency 46,599 Residential mortgage-backed 30,404 Asset-backed 18,569 Municipal 14,212 Commercial mortgage-backed 12,207 Fixed maturity securities available-for-sale 340,274 Equity securities: Common stock 1,079 Non-redeemable preferred stock 190 Equity securities 1,269 Contractholder-directed equity securities and fair value option securities 12,142 Mortgage loans: Commercial mortgage loans 50,553 Agricultural mortgage loans 18,111 Residential mortgage loans 11,323 Valuation allowances (634) Mortgage loans 79,353 Policy loans 9,111 Real estate and real estate joint ventures 12,216 Other limited partnership interests 14,625 Short-term investments 7,176 Other invested assets 18,655 Cash and cash equivalents 20,047 2 Total Invested Assets & Cash $ 514,868 1. Amounts presented are at carrying value. See the 2021 MetLife, Inc. 10-K for further information about sub-sectors of these asset classes. 2. Represents Total Investments plus Cash and Cash Equivalents of MetLife, Inc. at carrying value. 2021 SUSTAINABILITY REPORT 108
Sustainability For Our For Our Creating Value For the For Our Managing Appendix at MetLife Workforce Customers as an Investor Environment Communities Responsibly SASB Index SASB—Sustainability Accounting Standards Board Incorporation of Environmental, Social and Governance Factors in Investment Management (continued) Code/Metric Response/Reference FN-IN-410a.1, Total invested assets, by industry and asset class (cont.) Institutional Client AUM Insurance/Financial $ 84,816 Sub-Advisory 40,527 Corporate 28,842 Public 13,159 Commingled Fund 10,980 Other (Nonprofit, Taft Hartley, Other) 2,692 Institutional Client AUM $ 181,016 1 Investment Grade and Below Investment Grade Information Investment grade $ 324,603 95.4% Below investment grade 15,671 4.6% Total fixed maturity securities available-for-sale $ 340,274 100.0% U.S. and foreign MD&A—Investments—Fixed Maturity Securities AFS—U.S. corporate securities and Foreign Corporate Fixed Maturity Securities AFS RMBS MD&A—Investments—Fixed Maturity Securities AFS— Structured Products—RMBS ABS MD&A—Investments—Fixed Maturity Securities AFS— Structured Products—ABS Commercial mortgage loans MD&A—Investments—Mortgage Loans—Commercial Mortgage Loans by Geographic Region and Property Type Real estate and real estate MD&A—Investments—Real Estate and Real Estate joint ventures Joint Ventures Other invested assets MD&A—Investments—Other Invested Assets 1. B ased on nationally recognized statistical rating organization ratings where Investment grade is Aaa/Aa/A and Baa, and Below investment grade is Ba, B, Caa and lower, and In or near default. FN-IN-410a.2, Description of approach to incorporation of See response to FN-AC-410a.2 above. environmental, social, and governance (ESG) factors in investment management processes and strategies 2021 SUSTAINABILITY REPORT 109
Sustainability For Our For Our Creating Value For the For Our Managing Appendix at MetLife Workforce Customers as an Investor Environment Communities Responsibly SASB Index SASB—Sustainability Accounting Standards Board Policies Designed to Incentivize Responsible Behavior Code/Metric Response/Reference FN-IN-410b.1, Net premiums written related to energy efficiency and MetLife is unable to measure or disclose this metric at this time but will continue to evaluate in low carbon technology the future. FN-IN-410b.2, Discussion of products and/or product features that See report section: For Our Customers. incentivize health, safety, and/or environmentally responsible actions and/or behaviors Health & Well-Being Incentives MetLife believes it is important to provide our customers with tools and resources that benefit their overall health and well-being. Please see the references below for examples of the actions MetLife takes to incentivize healthy behaviors through our products. Examples include: • 360H ealth: 360Health is a combination of insurance and health services available across four markets in Asia. 360Health provides a unique perspective on helping customers with solutions that address their mental, physical, financial and social health alongside work factors through a comprehensive focus on prevention, early diagnosis, access to treatment, ongoing care and financial protection. 360Health is designed to directly address customer concerns about serious illnesses and offers medically endorsed, end-to-end solutions to help people increase their “healthspan,” or the number of healthy years in their overall lifespan. Through 360Health, we incentivize healthy behavior in customers through services and capabilities provided on platforms such as mobile app, web and WeChat. The services offered include examples such as the “360Health App” in Korea, a mobile application that measures cardiovascular health risk and stress level with AI-powered technology. The app offers health and well-being tips for personal health management and enables agents to engage with customers. Additionally in Korea, we also provide value-added service options specific to customer life stages. For example, seniors can access a senior concierge service and senior tele-counseling services. Tele-doctor services and online health assessments are popular with our customers in China. While services offered vary across markets, they include a breadth of health value-added services such as free virtual doctor consultations, special discounts on diagnostic tests, preferential access to specialists, and beauty and well-being benefits, to name a few. 2021 SUSTAINABILITY REPORT 110
Sustainability For Our For Our Creating Value For the For Our Managing Appendix at MetLife Workforce Customers as an Investor Environment Communities Responsibly SASB Index SASB—Sustainability Accounting Standards Board Policies Designed to Incentivize Responsible Behavior (continued) Code/Metric Response/Reference FN-IN-410b.2, Discussion of products and/or product features that • Japan Value-Added Services (VAS): In Japan we offer comprehensive health and incentivize health, safety, and/or environmentally responsible actions well-being-oriented VAS free of charge to support customers’ continuum of care. For and/or behaviors example, we offer a 24/7 health hotline, a medical second-opinion service, mental health support, support for returning to work post-cancer diagnosis, and medical check-up consultations. We also offer services to support customers with childcare, nursing care, cancer, dementia, brain and heart disease prevention and more. Additionally, we offer a “club off” program for customers that provides them with exclusive discounts to gyms, restaurants, tutoring and other services. Please also see report section: For Our Customers >> Empowering Underserved Communities >> Enhancing Offerings for Women for information on programs and products designed specifically for women that incentivize healthy behavior. 2021 SUSTAINABILITY REPORT 111
Sustainability For Our For Our Creating Value For the For Our Managing Appendix at MetLife Workforce Customers as an Investor Environment Communities Responsibly SASB Index SASB—Sustainability Accounting Standards Board Systemic Risk Management Code/Metric Response/Reference FN-IN-550a.1, Exposure to derivative instruments by category: (1) total As of December 31, 2021 ($ Millions) potential exposure to noncentrally cleared derivatives, (2) total fair value of acceptable collateral posted with the Central Clearinghouse, and (3) General account total potential exposure to centrally cleared derivatives 1 Amount As reported on the entity’s Schedule DB (1) Total potential exposure to non-centrally cleared derivatives $2,144 (2) Total fair value of acceptable collateral posted with the Central Clearinghouse $638 (3) Total potential exposure to centrally cleared derivatives $4,648 1 FN-IN-550a.1 specifically targets disclosures “as reported on the entity’s schedule DB.” As such, amounts only include our insurance companies that report Schedule DB for NAIC Statutory purposes. FN-IN-550a.2, Total fair value of securities lending collateral assets For information regarding Securities Lending Transactions and Repurchase Agreements, see Note 8 of 2021 Form 10-K. FN-IN-550a.3, Description of approach to managing capital and See response to FN-AC-550a.2 above. liquidity-related risks associated with systemic non-insurance activities FN-IN-000.A, Number of policies in force, by segment: (1) property and For information regarding insurance reserves and reinsurance in-force by insurance product, see casualty, (2) life, (3) assumed reinsurance Item 8 of 2021 Form 10-K, Financial Statements and Supplementary Data, Schedule lV. 2021 SUSTAINABILITY REPORT 112
Sustainability For Our For Our Creating Value For the For Our Managing Appendix at MetLife Workforce Customers as an Investor Environment Communities Responsibly TCFD Index MetLife is issuing a TCFD Index to enable comparable, decision-useful information for investors and other stakeholders regarding how we approach and manage climate risks and opportunities. The following table indicates where readers can find disclosures within MetLife’s 2021 Sustainability Report and/or other publicly available documents that address TCFD recommendations. TCFD—Task Force on Climate-Related Financial Disclosures Governance Disclosure Focus Area Recommended Disclosure Response a) Describe the board’s oversight of climate- For the Environment >> Governance related risks and opportunities. Managing Responsibly >> Governance Disclose the CDP Climate Change 2021 C1.1a, C1.1b organization’s b) Describe management’s role in assessing For the Environment >> Governance governance around and managing climate-related risks and Creating Value as an Investor >> Governance climate-related risks opportunities. and opportunities Managing Responsibly >> Governance MIM ESG Investment Policy CDP Climate Change 2021 C1.2, C1.2a 2021 SUSTAINABILITY REPORT 113
Sustainability For Our For Our Creating Value For the For Our Managing Appendix at MetLife Workforce Customers as an Investor Environment Communities Responsibly TCFD Index TCFD—Task Force on Climate-Related Financial Disclosures Strategy Disclosure Focus Area Recommended Disclosure Response a) Describe the climate-related risks and CDP Climate Change 2021 C2.1, C2.1a, C2.1b, C2.2a, C-FS2.2b, C2.3a, C2.4a opportunities the organization has identified Disclose the actual over the short, medium, and long term. and potential impacts of climate- b) Describe the impact of climate- Creating Value as an Investor related risks and related risks and opportunities on the For the Environment opportunities on organization’s businesses, strategy, and the organization’s financial planning. CDP Climate Change 2021 C2.3a, C2.4a, C3.1, C3.1d, C3.1e, CFS3.2a, CFS3.2b, CFS3.3a businesses, strategy and financial c) Describe the potential impact of different Managing Responsibly >> Risk Management >> Managing Climate Risks planning. scenarios, including a 2°C scenario, on the CDP Climate Change 2021 C3.1a, C3.1c organization’s businesses, strategy, and . financial planning Risk Management a) Describe the organization’s processes for For the Environment >> Our Approach; Resilient Operations identifying and assessing climate-related Creating Value as an Investor >> Governance; MetLife General Account Investment Portfolio risks. Managing Responsibly >> Our Approach; Governance; Risk Management MIM ESG Investment Policy CDP Climate Change 2021 C2.1, C2.1a, C2.2, C2.2a, CFS2.2c, C-FS2.2f Disclose how b) Describe the organization’s processes for For the Environment the organization managing climate-related risks. identifies, assesses Creating Value as an Investor and manages Managing Responsibly >> Our Approach; Governance; Risk Management climate-related risks. CDP Climate Change 2021 C2.1, C2.1a C2.2, C2.2d c) Describe how processes for identifying, For the Environment >> Our Approach assessing, and managing climate-related Managing Responsibly >> Our Approach; Governance; Risk Management risks are integrated into the organization’s overall risk management. MIM ESG Investment Policy CDP Climate Change 2021 C2.1, C2.2 2021 SUSTAINABILITY REPORT 114
Sustainability For Our For Our Creating Value For the For Our Managing Appendix at MetLife Workforce Customers as an Investor Environment Communities Responsibly TCFD Index TCFD—Task Force on Climate-Related Financial Disclosures Metrics and Targets Disclosure Focus Area Recommended Disclosure Response a) Disclose the metrics used by the Appendix >> ESG Scorecard >> Environmental Data organization to assess climate-related CDP Climate Change 2021 C6.1, C6.2, C6.3, C6.5, C6.10, C8.2a, C9.1 risks and opportunities in line with its strategy and risk management process. Disclose the metrics and targets used to b) Disclose Scope 1, Scope 2, and, if Appendix >> ESG Scorecard >> Environmental Data assess and manage appropriate, Scope 3 greenhouse gas CDP Climate Change 2021 C6.1, C6.2, C6.3, C6.5 relevant climate- (GHG) emissions, and the related risks. related risks and GHG Inventory Assurance Statement opportunities. c) Describe the targets used by the Sustainability at MetLife >> Sustainability Goals and Progress organization to manage climate-related For the Environment >> Driving Climate Solutions risks and opportunities and performance against targets. CDP Climate Change 2021 C4.1, C4.1a, C4.2, C4.2a, C4.2b 2021 SUSTAINABILITY REPORT 115
Sustainability For Our For Our Creating Value For the For Our Managing Appendix at MetLife Workforce Customers as an Investor Environment Communities Responsibly GRI Standard Index MetLife’s 2021 Global Reporting Initiative (GRI) Index has been prepared according to the GRI Standards Core option and represents performance data from calendar year 2021. Disclosure Number Disclosure Title Response/Reference GRI 102: General Disclosures Organizational Profile 102-1 Name of the organization MetLife, Inc. 102-2 Activities, brands, products, and services For summary information regarding our business overview and the major products we offer, see 2021 Form 10-K, Item 1. Business. 102-3 Location of headquarters 200 Park Ave., New York, NY 10166 102-4 Location of operations Global Locations 102-5 Ownership and legal form C corporation 102-6 Markets served Global Locations 102-7 Scale of the organization Appendix >> ESG Scorecard >> Financial Data, Workforce Data 102-8 Information on employees and other workers Appendix >> ESG Scorecard >> Workforce Data 102-9 Supply chain For the Environment >> Resilient Operations >> Promoting Supply Chain Sustainability Managing Responsibly >> Supplier Management MetLife Global Procurement MetLife Supplier Code of Business Ethics 102-10 Significant changes to the organization and its For information regarding acquisitions and dispositions see the 2021 Form 10-K—Note 3 supply chain Acquisitions and Dispositions. 102-11 Precautionary Principle or approach Managing Responsibly >> Risk Management 2021 SUSTAINABILITY REPORT 116
Sustainability For Our For Our Creating Value For the For Our Managing Appendix at MetLife Workforce Customers as an Investor Environment Communities Responsibly GRI Standard Index Disclosure Number Disclosure Title Response/Reference 102-12 External initiatives Signatory to the: • UN Global Compact • UN Principles for Responsible Investment • UN Women’s Empowerment Principles • Catalyst CEO Champions for Change • One Mind at Work Pledge • CEO Action for Diversity & Inclusion • Climate Leadership Council • UN Global Compact’s Target Gender Equality Initiative • Human Rights Campaign’s Business Coalition for the Equality Act • Business Statement on Anti-LGBTQ State Legislation MIM is a signatory to the following: • CDP • TCFD supporter • SASB Alliance • Principles for Responsible Investment • Global Impact Investing Network • ILPA Diversity in Action • GRESB • DOE Better Buildings Challenge Partner • USGBC Member • CFA Asset Manager Code of Conduct 2021 SUSTAINABILITY REPORT 117
Sustainability For Our For Our Creating Value For the For Our Managing Appendix at MetLife Workforce Customers as an Investor Environment Communities Responsibly GRI Standard Index Disclosure Number Disclosure Title Response/Reference 102-13 Membership of associations Some of the policy, research and trade associations with whom we engage include: • American Council of Life Insurers • Atlantic Council • Business Council for International Understanding • Business Roundtable • Coalition of Service Industries • Council of the Americas • Geneva Association • Institute of International Finance • Japan Society • Korea Society • National Center for Asia Pacific Economic Cooperation • Washington International Trade Association; Bipartisan Policy Center; U.S. Chamber of Commerce Some of the environmental associations with whom we engage include: • CDP • Center for Active Design • Climate Leadership Council • United States Department of Energy • United States Environmental Protection Agency • United States Green Building Council See also the Employees & Benefits section of our ESG Data Center, under Policies & Codes Strategy 102-14 Statement from senior decision-maker Letter from Our CEO CEO’s Letter: 2021 Annual Report Letter from Chairman of the Board: 2022 Proxy Statement 2021 SUSTAINABILITY REPORT 118
Sustainability For Our For Our Creating Value For the For Our Managing Appendix at MetLife Workforce Customers as an Investor Environment Communities Responsibly GRI Standard Index Disclosure Number Disclosure Title Response/Reference Ethics and Integrity 102-16 Values, principles, standards, and norms Managing Responsibly >> Code of Business Ethics of behavior MetLife Purpose MetLife Financial Management Code of Business Ethics MetLife Director’s Code of Business Conduct and Ethics MetLife Corporate Conduct MetLife’s Code of Business Ethics MetLife Corporate Governance MetLife Ethics and Compliance MetLife Customer Privacy Policy MetLife Supplier Code of Business Ethics Governance and Corporate Responsibility Committee Charter MetLife’s Statement on Human Rights MetLife Pay Equity Statement Governance 102-18 Governance structure Corporate Governance Governance and Corporate Responsibility Committee Charter 102-20 Executive-level responsibility for economic, Managing Responsibly >> Governance; Risk Management environmental, and social topics MetLife Statement on Climate Change MetLife’s Statement on Human Rights MetLife’s Environmental Policy Statement 102-29 Identifying and managing economic, Managing Responsibly >> Governance; Risk Management environmental, and social impacts MetLife Statement on Climate Change MetLife’s Statement on Human Rights MetLife’s Environmental Policy Statement 2021 SUSTAINABILITY REPORT 119
Sustainability For Our For Our Creating Value For the For Our Managing Appendix at MetLife Workforce Customers as an Investor Environment Communities Responsibly GRI Standard Index Disclosure Number Disclosure Title Response/Reference Stakeholder Engagement 102-40 List of stakeholder groups Appendix >> Stakeholder Engagement Letter from Chairman of the Board: 2022 Proxy Statement We consider our stakeholders to include investors and shareholders, customers, employees, governments and regulators, and the communities where we operate. 102-41 Collective bargaining agreements We do not closely track this metric due to differing definitions of collective bargaining agreements across locations. Some of our non-U.S. (non-agency) employees are covered, while in the United States, we do not have a collective bargaining agreement covering employees. MetLife’s Statement on Human Rights 102-42 Identifying and selecting stakeholders We primarily engage with stakeholders who have a high impact on, and who are most affected by, MetLife’s business operations. 102-43 Approach to stakeholder engagement Appendix >> Stakeholder Engagement Letter from Chairman of the Board: 2022 Proxy Statement MetLife’s Statement on Human Rights Investors: Engagement via annual and required SEC filings, investor presentations, roadshow participation and direct interaction. Employees: Employee surveys annually (including our global organizational health survey), annual performance reviews and direct conversations with supervisors/managers. Governments: Engagement on a continual basis at the international, national, regional and local level and participation in industry associations on an annual membership basis. Communities: Engagement via MetLife Foundation activities and employee volunteerism. Customers: Engagement via direct outreach and conversations (continual), customer satisfaction surveys (including Net Promoter Surveys) and responses to RFPs. 102-44 Key topics and concerns raised 2022 Proxy Statement, page 10 2021 SUSTAINABILITY REPORT 120
Sustainability For Our For Our Creating Value For the For Our Managing Appendix at MetLife Workforce Customers as an Investor Environment Communities Responsibly GRI Standard Index Disclosure Number Disclosure Title Response/Reference Reporting Practice 102-45 Entities included in the consolidated 2021 10-K, Exhibit 21.1 financial statements 102-46 Defining report content and topic Boundaries Letter from Our CEO Sustainability at MetLife >> Recent Highlights in Alignment with the UN SDGs The content of this report aligns with MetLife's sustainability priorities, strategy and materiality. 102-47 List of material topics In order to ensure that MetLife is aware of and appropriately addressing issues relevant to our business and stakeholders, we performed a traditional materiality analysis in 2020 using a comprehensive data-driven process. The materiality analysis is based on real-time analytics on strategic, regulatory and reputational risks and opportunities. Implementing the analysis has strengthened our understanding of ESG-related issues and enhanced our in-house capabilities to assess their evolution. In addition, this data-driven process, along with feedback from various key stakeholders and sources (e.g., ESG ratings/rankings, investors, MetLife senior executives, external perspectives, peer benchmarking, etc.), allows us to develop a forward-looking sustainability strategy that helps ensure we can continue to be a force for good in the world, sustaining customers, family, and the planet. See also Sustainability at MetLife >> Our 2030 Sustainability Commitments for a summary of MetLife’s strategic approach to ESG issues. 102-48 Restatements of information MetLife will restate our GHG emissions data when changes to the inventory meet or exceed 2% of base year emissions (Scope 1, Scope 2 and Scope 3 business travel). Changes can result from the following: structural changes, methodology changes, errors, new data sources. Please see footnotes in report for further information on data changes. 102-49 Changes in reporting Changes have been noted in footnotes where applicable. 102-50 Reporting period January 1–December 31, 2021, unless otherwise noted. 102-51 Date of most recent report June 2021 102-52 Reporting cycle Annual 2021 SUSTAINABILITY REPORT 121
Sustainability For Our For Our Creating Value For the For Our Managing Appendix at MetLife Workforce Customers as an Investor Environment Communities Responsibly GRI Standard Index Disclosure Number Disclosure Title Response/Reference 102-53 Contact point for questions regarding the report We invite your comments, questions and feedback on this report. Please contact us at: gogreen@metlife.com 102-54 Claims of reporting in accordance with the This report has been prepared in accordance with GRI: Core. GRI Standards 102-55 GRI content index Appendix 102-56 External assurance This report has been developed in accordance with the GRI, UNGC, TCFD and SASB frameworks. Our global Scope 1, Scope 2 and Scope 3 Business Travel GHG emissions have been externally verified and assured to ISO-14064-3 standards. GRI 200: Economic GRI 201: Economic Performance 103-1 Explanation of the material topic and its Boundary Sustainability at MetLife For Our Customers Creating Value as an Investor Appendix >> ESG Scorecard >> Financial Data 103-2 The management approach and its components Sustainability at MetLife For Our Customers Creating Value as an Investor Appendix >> ESG Scorecard >> Financial Data 103-3 Evaluation of the management approach Sustainability at MetLife For Our Customers Creating Value as an Investor Appendix >> ESG Scorecard >> Financial Data 201-1 Direct economic value generated and distributed Appendix >> ESG Scorecard >> Financial Data 2021 SUSTAINABILITY REPORT 122
Sustainability For Our For Our Creating Value For the For Our Managing Appendix at MetLife Workforce Customers as an Investor Environment Communities Responsibly GRI Standard Index Disclosure Number Disclosure Title Response/Reference 201-2 Financial implications and other risks and For Our Customers >> Our Approach opportunities due to climate change Creating Value as an Investor For the Environment Managing Responsibly >> Risk Management CDP Climate Change 2021, C2. Risks and Opportunities GRI 202: Market Presence 103-1 Explanation of the material topic and its Boundary For Our Customers For Our Workforce Creating Value as an Investor Global Locations 103-2 The management approach and its components For Our Customers For Our Workforce Creating Value as an Investor 103-3 Evaluation of the management approach For Our Customers For Our Workforce Creating Value as an Investor 2021 SUSTAINABILITY REPORT 123
Sustainability For Our For Our Creating Value For the For Our Managing Appendix at MetLife Workforce Customers as an Investor Environment Communities Responsibly GRI Standard Index Disclosure Number Disclosure Title Response/Reference GRI 203: Indirect Economic Impacts 103-1 Explanation of the material topic and its Boundary For Our Customers For Our Workforce Creating Value as an Investor For Our Communities 103-2 The management approach and its components For Our Customers For Our Workforce Creating Value as an Investor For Our Communities 103-3 Evaluation of the management approach For Our Customers For Our Workforce Creating Value as an Investor For Our Communities 203-1 Infrastructure investments and services supported For Our Customers For Our Workforce Creating Value as an Investor For Our Communities 203-2 Significant indirect economic impacts For Our Customers For Our Workforce Creating Value as an Investor For Our Communities 2021 SUSTAINABILITY REPORT 124
Sustainability For Our For Our Creating Value For the For Our Managing Appendix at MetLife Workforce Customers as an Investor Environment Communities Responsibly GRI Standard Index Disclosure Number Disclosure Title Response/Reference GRI 205: Anti-corruption 205-1 Operations assessed for risks related All MetLife operations globally are regularly assessed for bribery and corruption risk, in accordance to corruption with each operation’s bribery and corruption risk profile and local regulatory requirements, while ongoing, risk-based monitoring and testing activities provide assurance that key anti-corruption controls effectively mitigate corruption risk. We also became the first U.S.-based insurer in 2020 to join the UNGC, the world’s largest corporate sustainability initiative, which calls for companies to align their operations and strategies with 10 universal principles in the areas of human rights, labor, the environment and anti-corruption. Moving forward, we will partner with the UNGC to not only elevate our efforts but also use the principles as important guides to prioritize and focus our work. MetLife’s Statement on Human Rights 205-2 Communication and training about The MetLife Global Anti-Corruption Policy has been communicated in local languages to all MetLife anti-corruption policies and procedures employees globally. The policy is also available on MetLife’s global intranet sites for all employees to access. Third parties are also trained on MetLife’s policy through a brochure that is provided to all third parties we engage globally. In 2021, MetLife provided mandatory anti-bribery and corruption training to all employees. Managing Responsibly >> Risk Management MetLife’s Code of Business Ethics GRI 206: Anti-competitive Behavior 206-1 Legal actions for anti-competitive behavior, None at the corporate level. anti-trust, and monopoly practices 2021 SUSTAINABILITY REPORT 125
Sustainability For Our For Our Creating Value For the For Our Managing Appendix at MetLife Workforce Customers as an Investor Environment Communities Responsibly GRI Standard Index Disclosure Number Disclosure Title Response/Reference GRI 300: Environmental GRI 302: Energy 302-1 Energy consumption within the organization For the Environment >> Resilient Operations Appendix >> ESG Scorecard >> Environmental Data 302-3 Energy intensity CDP Climate Change 2021, C8. Energy 302-4 Reduction of energy consumption There was no energy consumption from energy generated from heating, cooling or steam. MetLife does not sell energy. GRI 305: Emissions 103-2 The management approach and its components For the Environment >> Resilient Operations MetLife's Statement on Climate Change 305-1 Direct (Scope 1) GHG emissions Appendix >> ESG Scorecard >> Environmental Data CDP Climate Change 2021, C6. Emissions Data 305-2 Energy indirect (Scope 2) GHG emissions Appendix >> ESG Scorecard >> Environmental Data CDP Climate Change 2021, C6. Emissions Data 305-3 Other indirect (Scope 3) GHG emissions Appendix >> ESG Scorecard >> Environmental Data CDP Climate Change 2021, C6. Emissions Data 305-4 GHG emissions intensity Appendix >> ESG Scorecard >> Environmental Data CDP Climate Change 2021, C6. Emissions Data 305-5 Reduction of GHG emissions For the Environment >> Resilient Operations CDP Climate Change 2021, C4. Targets and Performance GRI 306: Waste 306-3 Waste generated Appendix >> ESG Scorecard >> Environmental Data 306-4 Waste diverted from disposal Appendix >> ESG Scorecard >> Environmental Data 306-5 Waste directed to disposal Appendix >> ESG Scorecard >> Environmental Data 2021 SUSTAINABILITY REPORT 126
Sustainability For Our For Our Creating Value For the For Our Managing Appendix at MetLife Workforce Customers as an Investor Environment Communities Responsibly GRI Standard Index Disclosure Number Disclosure Title Response/Reference GRI 308: Supplier Environmental Assessment 103-2 The management approach and its components For the Environment >> Resilient Operations >> Promoting Supply Chain Sustainability Managing Responsibly >> Supplier Management CDP Climate Change 2021, C2. Risks and Opportunities 308-1 New suppliers that were screened using 100%: environmental sustainability questions are part of MetLife's standard RFP/RFI templates and environmental criteria are also included in the Supplier Onboarding Process. All suppliers are also expected to adhere to MetLife’s Supplier Code of Business Ethics. Supplier Code of Business Ethics GRI 400: Social GRI 401: Employment 103-1 Explanation of the material topic and its Boundary For Our Workforce MetLife’s Statement on Human Rights 103-2 The management approach and its components For Our Workforce Careers at MetLife MetLife’s Statement on Human Rights 103-3 Evaluation of the management approach For Our Workforce 401-1 New employee hires and employee turnover Appendix >> ESG Scorecard >> Workforce Data 2021 SUSTAINABILITY REPORT 127
Sustainability For Our For Our Creating Value For the For Our Managing Appendix at MetLife Workforce Customers as an Investor Environment Communities Responsibly GRI Standard Index Disclosure Number Disclosure Title Response/Reference 401-2 Benefits provided to full-time employees that are MetLife provides benefits to all U.S. full-time employees, and these plans/programs are generally not provided to temporary or part-time employees available to part-time employees working 20 hours per week or more. These benefits include: • Medical coverage, includes prescription drug and vision coverage • Dental coverage • Short-term and long-term disability coverage • Company-paid life insurance • 401(k) plan • Restricted Stock Units, Performance Shares and Stock Options, as components of our Long Term Incentive Award programs for high-job-level and higher-paid employees • Cash balance defined benefit retirement plan • Healthcare and Dependent Day Care Flexible Spending Accounts • Commuter Program • Back-up child-care, elder-care and college advising program • Tuition assistance program • Travel benefits: emergency services, travel accident and international medical coverage • Opportunity to earn Wellness Dividend credited toward employee contributions for medical coverage • Optional employee-paid life insurance (group term life, GVUL, dependent life, VAD&D insurance) • Legal Services plan • Critical Illness Insurance • Adoption financial assistance • Surrogacy financial assistance • Employee Assistance Program • Financial wellness program • Virtual physical therapy and fitness programs • Personalized caregiver support program • Educational support program for caregivers of neurodiverse children • Medical expert second opinion service for Medical Plan COVID-19-related: • Removed cost share for telemedical/telemental health virtual visits via health plans through the end of the year • Partnered with 2ndMD for a COVID-19 hotline for medical questions in addition to second- opinion services • MetLife employees and covered family members received cash protection through a MetLife Hospital Indemnity Insurance Program, at no cost, through first quarter 2021 • Permitted enrollment changes to Dependent Day Care flexible spending accounts to give parents flexibility to change their contribution amount as daycares closed and reopened • Offered employees special wellness incentives to support COVID-19 and flu vaccination 2021 SUSTAINABILITY REPORT 128
Sustainability For Our For Our Creating Value For the For Our Managing Appendix at MetLife Workforce Customers as an Investor Environment Communities Responsibly GRI Standard Index Disclosure Number Disclosure Title Response/Reference GRI 404: Training and Education 103-1 Explanation of the material topic and its Boundary For Our Workforce >> Global Diversity, Equity and Inclusion >> We Prosper with External Perspective and Inclusive Dialogue; Talent and Skill Development 103-2 The management approach and its components For Our Workforce >> Global Diversity, Equity and Inclusion >> We Prosper with External Perspective and Inclusive Dialogue; Talent and Skill Development 103-3 Evaluation of the management approach For Our Workforce >> Global Diversity, Equity and Inclusion >> We Prosper with External Perspective and Inclusive Dialogue; Talent and Skill Development 404-1 Average hours of training per year per employee Appendix >> ESG Scorecard >> Workforce Data 404-2 Programs for upgrading employee skills and For Our Workforce >> Global Diversity, Equity and Inclusion >> We Prosper with External transition assistance programs Perspective and Inclusive Dialogue; Talent and Skill Development 404-3 Percentage of employees receiving regular Appendix >> ESG Scorecard >> Workforce Data performance and career development reviews GRI 405: Diversity and Equal Opportunity 103-1 Explanation of the material topic and its Boundary Letter from Our CEO For Our Workforce >> Global Diversity, Equity and Inclusion Careers at MetLife; Global Diversity, Equity & Inclusion 103-2 The management approach and its components Letter from Our CEO For Our Workforce >> Global Diversity, Equity and Inclusion Careers at MetLife; Global Diversity, Equity & Inclusion 103-3 Evaluation of the management approach Letter from Our CEO For Our Workforce >> Global Diversity, Equity and Inclusion Careers at MetLife; Global Diversity, Equity & Inclusion 405-1 Diversity of governance bodies and employees Managing Responsibly >> Supplier Management 2021 SUSTAINABILITY REPORT 129
Sustainability For Our For Our Creating Value For the For Our Managing Appendix at MetLife Workforce Customers as an Investor Environment Communities Responsibly GRI Standard Index Disclosure Number Disclosure Title Response/Reference GRI 406: Non-discrimination 103-1 Explanation of the material topic and its Boundary MetLife's Code of Business Ethics 103-2 The management approach and its components MetLife’s Code of Business Ethics 406-1 Incidents of discrimination and corrective MetLife is strongly committed to equal employment opportunity and to administering all terms, actions taken conditions and privileges of employment fairly. We have policies broadly prohibiting discrimination and harassment, provide employees with several avenues to submit complaints, and have robust procedures for investigating those complaints and taking appropriate action if warranted. As a Fortune 50 employer with tens of thousands of employees, MetLife receives complaints from time to time, which are investigated. If warranted, corrective action is taken. Employee complaints and actions taken in response are confidential workplace matters. GRI 414: Supplier Social Assessment 103-2 The management approach and its components Managing Responsibly >> Supplier Management 308-1 New suppliers that were screened using 100%: Supplier social sustainability questions are part of MetLife's standard RFP/RFI templates and environmental criteria are also included in the Supplier Onboarding Process. Supplier Code of Business Ethics GRI 415: Public Policy 103-1 Explanation of the material topic and its Boundary MetLife’s Code of Business Ethics 103-2 The management approach and its components MetLife’s Code of Business Ethics 415-1 Political contributions MetLife forbids political contributions outside the United States without express approval from the Head of Global Government Relations. We made no political contributions outside the United States in 2021. 2021 Political Activities Report 2021 SUSTAINABILITY REPORT 130
Sustainability For Our For Our Creating Value For the For Our Managing Appendix at MetLife Workforce Customers as an Investor Environment Communities Responsibly GRI Standard Index Disclosure Number Disclosure Title Response/Reference GRI 417: Marketing and Labeling 417-3 Incidents of non-compliance concerning For MetLife’s disclosure on material legal proceedings, other than ordinary routine litigation incidental marketing communications to the business, see Note 21 of the 2021 Form 10-K and Note 14 of the 1Q22 Form 10-Q. We consider “significant” fines as those listed in our 10-K. GRI 418: Customer Privacy 103-1 Explanation of the material topic and its Boundary Managing Responsibly >> Cybersecurity and Data Privacy Privacy Policy 103-2 The management approach and its components Managing Responsibly >> Cybersecurity and Data Privacy Privacy Policy 418-1 Substantiated complaints concerning breaches of The number of complaints received is confidential information. MetLife has a long-standing customer privacy and losses of customer data commitment to protect the security, confidentiality and integrity of personal information, and to comply with all applicable privacy and data protection laws and regulations. To this end, MetLife has a global privacy policy that establishes enterprise-wide minimum standards on the collection, use and protection of personal information. Like other organizations, MetLife occasionally experiences security breaches, which may be described generally as the unauthorized access, loss, disclosure or misdirection of personal information. Should one of these incidents occur, MetLife has an incident response team that takes immediate steps to minimize any impact on the subject, follow applicable legal requirements, and investigate and correct the root cause, if needed, to help prevent future incidents. The team includes privacy and security professionals, lawyers and associates in our lines of business. GRI 419: Socioeconomic Compliance 419-1 Non-compliance with laws and regulations in the For MetLife’s disclosure on material legal proceedings, other than ordinary routine litigation social and economic area incidental to the business, see Note 21 of the 2021 Form 10-K and Note 14 of the 1Q22 Form 10-Q. We consider “significant” fines as those listed in our 10-K. 2021 SUSTAINABILITY REPORT 131
Sustainability For Our For Our Creating Value For the For Our Managing Appendix at MetLife Workforce Customers as an Investor Environment Communities Responsibly GRI Standard Index Disclosure Number Disclosure Title Response/Reference GRI G4 Sector Disclosures: Financial Services Product Portfolio FS7 Monetary value of products and services For Our Customers >> Empowering Underserved Communities; Enhancing Offerings for Women; designed to deliver a specific social benefit for Supporting Wellness each business line broken down by purpose Creating Value as an Investor >> MetLife Investment Management >> ESG Integration; Responsible Investments MetLife Investment Management FS8 Monetary value of products and services designed For Our Customers >> Protecting the Environment Through Our Products, Services and Offerings to deliver a specific environmental benefit for each Creating Value as an Investor >> MetLife Investment Management >> ESG Integration; business line broken down by purpose Responsible Investments SASB Index, code FN-IN-410b.2 Active Ownership FS10 Percentage and number of companies held in the Creating Value as an Investor institution's portfolio with which the reporting organization has interacted on environmental MIM’s investment analysts regularly interact and engage in discussions with a firm’s senior management or social issues throughout the initial due diligence process and as part of the portfolio monitoring process. Our engagement conversations are guided by the SASB materiality mapping framework, which identifies relevant industry-specific ESG risks and opportunities for discussion with our investment partners. Examples of MIM’s core asset sectors’ active engagement processes, including tracking and reporting of engagement activities, can be found within MIM’s Engagement Policy. MIM ESG Engagement Policy FS11 Percentage of assets subject to positive and MetLife GA’s Exclusionary Screens Policy negative environmental or social screening MetLife Investment Screen Policy—100% of the general account is subject to screening. Additionally, MIM applies specific guidelines as requested by our clients, and client-directed investment screens are incorporated into our investment process, as applicable. 2021 SUSTAINABILITY REPORT 132
Sustainability For Our For Our Creating Value For the For Our Managing Appendix at MetLife Workforce Customers as an Investor Environment Communities Responsibly GRI Standard Index Disclosure Number Disclosure Title Response/Reference Local Communities FS13 Access points in low-populated or economically For Our Communities disadvantaged areas by type For Our Customers ESG Products In many of our markets, we distribute insurance through partnerships with organizations such as banks, retailers, mobile phone operators and affinity groups. This is one example of our drive to grow in emerging markets. FS14 Initiatives to improve access to financial services For Our Communities for disadvantaged people For Our Customers ESG Products MetLife strives to improve access to our products and services for disadvantaged people. In several countries around the world, we work with partners from other industries to reach wider segments of the population. For example, in Colombia we work with a utility company, selling Personal Accident policies door-to-door and by phone for premiums as low as $1.50 per month. 2021 SUSTAINABILITY REPORT 133
Sustainability For Our For Our Creating Value For the For Our Managing Appendix at MetLife Workforce Customers as an Investor Environment Communities Responsibly ESG Scorecard MetLife’s primary performance data across Environmental, Social and Governance (ESG) indicators. Financial Data 1 Operational Data ($ in millions, except Earnings Per Share) 2021 2020 2019 2018 2017 Total Assets $ 759,708 $ 795,146 $ 740,463 $ 687,538 $ 719,892 Total Liabilities $ 691,959 $ 720,329 $ 674,081 $ 634,580 $ 661,022 Total MetLife, Inc.’s Stockholders’ Equity $ 67,482 $ 74,558 $ 66,144 $ 52,741 $ 58,676 Total Revenues $ 71,080 $ 67,842 $ 69,620 $ 67,941 $ 62,308 Premiums $ 42,009 $ 42,034 $ 42,235 $ 43,840 $ 38,992 Net Investment Income $ 21,395 $ 17,117 $ 18,868 $ 16,166 $ 17,363 Total Expenses $ 62,954 $ 60,915 $ 62,825 $ 61,634 $ 58,772 Policyholder Benefits and Claims $ 43,954 $ 41,461 $ 41,461 $ 42,656 $ 38,313 Provision for Income Tax Expense (Benefit) $ 1,551 $ 1,509 $ 886 $ 1,179 $ (1,470) Net Income $ 6,575 $ 5,418 $ 5,909 $ 5,128 $ 4,020 Dividends on Common Stock $ 1,647 $ 1,657 $ 1,643 $ 1,678 $ 1,717 Earnings Per Share1 $ 7.31 $ 5.68 $ 6.06 $ 4.91 $ 3.62 2 MetLife, Inc.’s Common Stockholders’ Return on Equity 9.7% 7.6% 9.8% 9.6% 6.3% 1. NET INCOME (LOSS) AVAILABLE TO METLIFE, INC.’S COMMON STOCKHOLDERS PER DILUTED COMMON SHARE. 2. RETURN ON METLIFE, INC.’S COMMON STOCKHOLDERS’ EQUITY IS DEFINED AS NET INCOME (LOSS) AVAILABLE TO METLIFE, INC.’S COMMON STOCKHOLDERS DIVIDED BY METLIFE, INC.’S AVERAGE COMMON STOCKHOLDERS’ EQUITY. 2021 SUSTAINABILITY REPORT 134
Sustainability For Our For Our Creating Value For the For Our Managing Appendix at MetLife Workforce Customers as an Investor Environment Communities Responsibly ESG Scorecard Financial Data 1 Total AUM $ Billions Percentage Public Corporates $ 120.9 18.1% 2 Mortgage Loans $ 110.9 16.6% Structured Products $ 71.4 10.7% Private Corporates $ 64.0 9.6% U.S. Government and Agency $ 63.3 9.5% Foreign Government $ 56.5 8.4% Private Infrastructure $ 34.4 5.1% 3 Cash and Short-Term Investments $ 30.6 4.6% 4 Real Estate Equity $ 27.1 4.0% Common and Preferred Equity $ 22.2 3.3% Emerging Market Debt $ 17.3 2.6% Municipals $ 17.2 2.6% Alternatives $ 14.7 2.2% High Yield $ 7.0 1.0% Private Structured Credit $ 5.3 0.8% Bank Loans $ 4.9 0.7% Middle Market Private Capital $ 1.3 0.2% Total $ 669.0 100.0% 1. AS OF DECEMBER 31, 2021. AT ESTIMATED FAIR VALUE. DOLLARS IN BILLIONS. SEE EXPLANATORY NOTE. 2. INCLUDES COMMERCIAL, AGRICULTURAL AND RESIDENTIAL MORTGAGE LOANS CONTAINED IN METLIFE’S GENERAL ACCOUNT (ADJUSTED AS DESCRIBED IN THE EXPLANATORY NOTE), SEPARATE ACCOUNTS AND NON-PROPRIETARY ASSETS OF UNAFFILIATED/THIRD-PARTY CLIENTS. 3. INCLUDES CASH EQUIVALENTS. 4. INCL UDES REAL ESTATE AND REAL ESTATE JOINT VENTURES CONTAINED IN METLIFE’S GENERAL ACCOUNT (ADJUSTED AS DESCRIBED IN THE EXPLANATORY NOTE), SEPARATE ACCOUNTS AND NON-PROPRIETARY ASSETS OF UNAFFILIATED/THIRD-PARTY CLIENTS. 2021 SUSTAINABILITY REPORT 135
Sustainability For Our For Our Creating Value For the For Our Managing Appendix at MetLife Workforce Customers as an Investor Environment Communities Responsibly ESG Scorecard Financial Data 1 Responsible Investments (Estimated Fair Value—$ in millions) 2021 2020 2019 2018 2017 2 Impact Investments $ 282 $ 243 $ 240 $ 230 $ 212 Affordable Housing Investments $ 2,914 $ 3,111 $ 2,972 $ 2,356 $ 2,219 3 Green Investments $ 34,319 $ 28,672 $ 18,329 $ 16,616 $ 15,059 Infrastructure $ 28,171 $ 27,249 $ 23,318 $ 17,109 $ 15,349 4 Municipal Bonds $ 17,200 $ 15,221 $ 13,586 $ 16,248 $ 17,152 Total $ 82,886 $ 74,496 $ 58,445 $ 52,559 $ 49,991 Annual Responsible Investments ($ in millions) 2021 2020 2019 2018 2017 Impact Investments $ 65 $ 12 $ 13 $ 46 $ 49 Affordable Housing Investments $ 227 $ 200 $ 333 $ 640 $ 182 3 Green Investments $ 6,085 $ 3,883 $ 1,031 $ 1,082 $ 538 Infrastructure $ 2,993 $ 2,574 $ 6,247 $ 4,177 $ 3,216 4 Municipal Bonds $ 4,343 $ 3,945 $ 2,291 $ 1,386 $ 849 Total $ 13,713 $ 10,614 $ 9,915 $ 7,331 $ 4,834 1. MIM MAY PERIODICALLY REFINE OR OTHERWISE MODIFY ITS DEFINITION OF RESPONSIBLE INVESTMENTS AND THE COMPONENTS THEREOF BASED ON DATA AVAILABILITY OR OTHER FACTORS. 2. IMP ACT INVESTMENTS ARE INVESTMENTS MADE WITH THE INTENTION TO GENERATE POSITIVE, MEASURABLE SOCIAL AND ENVIRONMENTAL IMPACT ALONGSIDE A FINANCIAL RETURN (GIIN–GLOBAL IMPACT INVESTMENT NETWORK—DEFINITION). THIS ACTIVITY INCLUDES METLIFE’S GENERAL ACCOUNT AND A SMALLER VOLUME OF METLIFE FOUNDATION ASSETS. 3. MIM CURRENTLY DEFINES GREEN INVESTMENTS TO INCLUDE 1) LEED, ENERGY STAR, BREEAM AND/OR FITWEL CERTIFIED REAL ESTATE EQUITY INVESTMENTS; 2) COMMERCIAL MORTGAGE LOANS SECURED BY LEED AND/ OR ENERGY STAR CERTIFIED REAL ESTATE; 3) RENEWABLE ENERGY PROJECTS, INCLUDING WIND AND SOLAR. 4. MUNICIP AL BONDS INCLUDE TAXABLE AND TAX-EXEMPT REVENUE BONDS AND, TO A MUCH LESSER EXTENT, GENERAL OBLIGATIONS OF STATES, MUNICIPALITIES AND POLITICAL SUBDIVISIONS. 2021 SUSTAINABILITY REPORT 136
Sustainability For Our For Our Creating Value For the For Our Managing Appendix at MetLife Workforce Customers as an Investor Environment Communities Responsibly ESG Scorecard Workforce Data (at December 31, 2021) 1 Global Workforce Data (#s) Total Female Male Employment Contract Regular 40,962 21,417 19,545 Temporary 169 113 56 Employment Type Full-time 40,844 21,305 19,539 Part-time 287 225 62 Workforce Breakdown Employees 41,131 21,530 19,601 Workforce by Region United States/Canada 13,711 8,355 5,356 Latin America 7,327 4,819 2,508 Asia 16,102 6,078 10,024 EMEA 3,991 2,278 1,713 1. TOTALS INCLUDE EMPLOYEES WHOSE GENDER IS NOT RECORDED. EXCLUDES PNB METLIFE EMPLOYEES. 2021 SUSTAINABILITY REPORT 137
Sustainability For Our For Our Creating Value For the For Our Managing Appendix at MetLife Workforce Customers as an Investor Environment Communities Responsibly ESG Scorecard Workforce Data (at December 31, 2021) Diversity Data Executive Leadership Team Employee and Board Diversity1 (%) Sales Non-Sales (includes non-U.S.) Board of Directors 2 Gender Female 40% 57% 25% 33% Male 60% 43% 75% 67% Age2 < 30 Years 14% 14% 0% 0% 30-50 Years 61% 62% 33% 0% > 50 Years 25% 23% 67% 100% Ethnicity and Race White 89% 66% 80% 83% Black or African American 3% 13% 10% 8% Hispanic or Latino 5% 8% 10% 8% Asian 1% 11% 0% 0% American Indian or Alaska Native 0% 0% 0% 0% Not Specified 0% 0% 0% 0% Two or More Races 2% 2% 0% 0% Native Hawaiian or Pacific Islander 0% 0% 0% 0% 1. U .S. ONLY. DUE TO ROUNDING, FIGURES MAY NOT ADD UP TO 100%. 2. GENDER AND AGE DO NOT INCLUDE UNIDENTIFIED PERSONNEL IN OUR SYSTEM. 2021 SUSTAINABILITY REPORT 138
Sustainability For Our For Our Creating Value For the For Our Managing Appendix at MetLife Workforce Customers as an Investor Environment Communities Responsibly ESG Scorecard Diversity Data (continued) 1 Industry-Leading Gender and Racial Diversity 2020 2021 Global Female Management2 % 41.0% 41.2% 3 Global Female Nonmanagement % 53.6% 54.2% 2 U.S. Ethnically/Racially Diverse (ERD) Management % 25.5% 25.2% U.S. ERD Nonmanagement3 % 33.8% 35.0% 4 Gender diversity for Officers (VP+)—Global 27.4% 29.1% 4 ERD Diversity for Officers (VP+)—U.S. 24.8% 26.7% Training Data Employee Training and Performance Reviews 5 Average Hours of Training per Year (# of hours) Female Male Non-sales 27 26 Sales 19 12 6 Employees Receiving Regular Performance Reviews (% of employees) Female Male Non-sales 98% 99% Sales 99% 99% 1. METRICS DO NOT INCLUDE INDIA PMB, AMMETLIFE (MALAYSIA JV), METLIFE LEGAL PLANS (HYATT LEGAL), MAXIS, VERSANT OR ECUADOR. 2020 METRICS HAVE BEEN UPDATED WITH METRICS FROM 2021 DIVESTITURES REMOVED. 2. MANAGEMENT POPULATION IS DEFINED AS ANY ACTIVE EMPLOYEE WHO HAS AT LEAST ONE DIRECT REPORT. 3. NONMANAGEMENT POPULATION IS DEFINED AS ANY ACTIVE EMPLOYEE WHO DOES NOT HAVE ANY DIRECT REPORTS. 4. THE OFFICER POPULATION IS A SUBSET OF OVERALL MANAGEMENT THAT IS A REFLECTION OF THE LEADERSHIP OF THE ORGANIZATION. IT IS COMPRISED OF ALL METLIFE EMPLOYEES AT THE VICE PRESIDENT LEVEL OR ABOVE. 5. EMPLOYEE TRAINING FIGURES INCLUDE ONLY TRAINING ACTIVITY CAPTURED IN OUR LEARNING MANAGEMENT SYSTEM, INCLUDING SKILL-BASED TRAINING AND COMPLIANCE TRAINING. DATA INCLUDES TRAINING COURSES TAKEN ONLINE (VIRTUAL COURSES) AND INSTRUCTOR-LED COURSES. 6. PERFORMANCE REVIEW FIGURES REFLECT ONLY EMPLOYEES WHO WERE IN SCOPE AND ACTIVE DURING THE YEAR-END ASSESSMENT PROCESS AND HAD RATINGS ENTERED INTO THE COMPANY’S EPERFORMANCE SYSTEM. PERFORMANCE FEEDBACK MAY BE DISCUSSED SEPARATELY FROM THE ONLINE SYSTEM. DATA DOES NOT INCLUDE INDIA PMB, NON-STANDARD GRADES (SLS GRADES), EMPLOYEES ON EXTENDED LEAVE OR EMPLOYEES HIRED/RE-HIRED ON/AFTER 10/1/2021. 2021 SUSTAINABILITY REPORT 139
Sustainability For Our For Our Creating Value For the For Our Managing Appendix at MetLife Workforce Customers as an Investor Environment Communities Responsibly ESG Scorecard New Hires and Turnover Data New Hires and Turnover1, 2,3 Hires Female Male Total (# of hires) 4,826 3,379 < 30 Years 1,785 1,547 30-50 Years 2,645 1,649 > 50 Years 389 183 Rate (% of hires) 59% 41% < 30 Years 37% 46% 30-50 Years 55% 49% > 50 Years 8% 5% U.S. ERD4 2021 Female 46% Male 40% Total 44% 1. EX CLUDES PNB METLIFE EMPLOYEES. 2. GENDER AND AGE DO NOT INCLUDE UNIDENTIFIED PERSONNEL IN OUR SYSTEM. 3. EMPLOYEE HIRES AND TERMINATIONS EXCLUDE IMPACTS DUE TO ACQUISITIONS AND DISPOSITIONS, AS APPLICABLE. 4. ETHNIC ALLY/RACIALLY DIVERSE (ERD) IS THE PERCENTAGE OF EMPLOYEES IN THE UNITED STATES THAT IDENTIFY AS AMERICAN INDIAN OR ALASKAN NATIVE, ASIAN, BLACK OR AFRICAN AMERICAN, HISPANIC OR LATINO, NATIVE HAWAIIAN OR OTHER PACIFIC ISLANDER AND TWO OR MORE RACES. 2021 SUSTAINABILITY REPORT 140
Sustainability For Our For Our Creating Value For the For Our Managing Appendix at MetLife Workforce Customers as an Investor Environment Communities Responsibly ESG Scorecard New Hires and Turnover Data Terminations Female Male Total (# of terminations) 4,610 3,832 < 30 Years 1,226 1,092 30-50 Years 2,628 2,178 > 50 Years 755 562 Rate (% of terminations) 55% 45% < 30 Years 27% 28% 30-50 Years 57% 57% > 50 Years 16% 15% U.S. ERD1 2021 Female 40% Male 35% Total 38% Employee Benefits Parental Leave Benefits (# of weeks fully paid for birth or adoptive 8 weeks for “primary caregivers” mothers and fathers) 2 weeks for “secondary caregivers” (Additional 8 weeks for childbirth under the STD Plan) Employee Satisfaction 2021 2020 2019 2018 Percentage of Employees Participating in Annual MyVoice Survey 83% 84% 82% 76% Percentage of Employees Indicating a Favorable Response to “How happy are you working at MetLife?" 78% 78% 75% 73% 1. ETHNIC ALLY/RACIALLY DIVERSE (ERD) IS THE PERCENTAGE OF EMPLOYEES IN THE UNITED STATES THAT IDENTIFY AS AMERICAN INDIAN OR ALASKAN NATIVE, ASIAN, BLACK OR AFRICAN AMERICAN, HISPANIC OR LATINO, NATIVE HAWAIIAN OR OTHER PACIFIC ISLANDER AND TWO OR MORE RACES. 2021 SUSTAINABILITY REPORT 141
Sustainability For Our For Our Creating Value For the For Our Managing Appendix at MetLife Workforce Customers as an Investor Environment Communities Responsibly ESG Scorecard 1 Environmental Data Built Environment 2021 2020 2019 2018 2017 2 Global Property (million sq. ft.) 13.5 14.1 14.6 15.40 15.32 MetLife Occupiable Area (million sq. ft.)2 11.3 12.1 12.2 7.60 7.70 3 EPA Energy Star (no. labeled buildings) 12 12 9 12 14 3 EPA Energy Star (million sq. ft.) 3.4 3.3 2.46 3.05 3.74 LEED (no. certified buildings) 26 22 22 21 18 LEED (million sq. ft.) 4.7 4.2 4.27 4.02 3.18 Fitwel Buildings (no. certified buildings) 3 3 3 — — Fitwel Buildings (million sq. ft.) 1.3 1.3 1.3 — — 4 Carbon Neutrality & GHG Emissions (metric tons CO2e) 2021 2020 2019 2018 2017 Scope 1 Emissions 12,052 14,515 19,684 25,617 25,948 Scope 2 (location-based) Emissions 51,893 66,332 87,026 96,503 108,055 5 Scope 3 Emissions (global business travel) 2,151 3,224 25,183 26,381 27,201 5 Total Operational Emissions (Scope 1+2 and business travel) 66,096 84,071 131,893 148,540 161,204 Gross Market-based Scope 2 Emissions6 9,231 23,191 30,776 31,285 35,351 Carbon Offsets 23,434 44,020 79,834 87,992 95,697 Emissions Intensity (metric tons CO2e per FTE) 0.73 0.84 1.24 1.28 1.34 Emissions Intensity (metric tons CO2e per sq. ft.) 0.006 0.007 0.009 0.009 0.009 1. TO ENSURE THAT METLIFE IS PROVIDING MEANINGFUL AND CONSISTENT COMPARISON OF DATA OVER TIME, ADJUSTMENTS TO PREVIOUS REPORTED TOTALS OF ENERGY AND EMISSIONS OCCURRED AS A RESULT OF METLIFE’S BRIGHTHOUSE FINANCIAL SPIN-OFF IN ACCORDANCE WITH THE GREENHOUSE GAS PROTOCOL CORPORATE ACCOUNTING AND REPORTING STANDARD. 2. PROPERTY FIGURES REPRESENT THE YEAR-END SQUARE FOOTAGE OF OUR REAL ESTATE PORTFOLIO. 3. U.S. MANAGED OFFICE PORTFOLIO. 4. THE INVENTORY OF GHG EMISSIONS FROM SCOPE 1, SCOPE 2 AND SCOPE 3 BUSINESS TRAVEL IN 2021 FOR METLIFE HAS BEEN VERIFIED BY QUANTIS ACCORDING TO ISO 14064-3. PLEASE SEE THE FULL STATEMENT FOR MORE INFORMATION. 5. CONVERTED TO GLOBAL BUSINESS TRAVEL, EXTRAPOLATED HISTORICALLY WHERE NECESSARY DUE TO LIMITED DATA. 6. INCL UDES RENEWABLE ENERGY CERTIFICATES, AND MARKET-BASED GLOBAL EMISSIONS WERE CALCULATED HISTORICALLY. 2021 SUSTAINABILITY REPORT 142
Sustainability For Our For Our Creating Value For the For Our Managing Appendix at MetLife Workforce Customers as an Investor Environment Communities Responsibly ESG Scorecard 1 Environmental Data Energy (MWh) 2021 2020 2019 2018 2017 Total Energy (includes electricity, fuel oil, natural gas 184,020 202,457 246,788 301,374 319,740 and fleet gasoline) Total Electricity Consumption 133,995 146,105 180,213 205,704 228,680 Renewable Energy Certificates 134,003 144,030 164,048 174,985 189,339 Energy Intensity (MWh per FTE) 2.09 2.09 2.87 3.31 3.53 Energy Intensity (MWh per sq. ft.) 0.016 0.017 0.020 0.023 0.024 Waste (lbs.)2 2021 2020 2019 2018 2017 Total Waste Generated 2,548,451 3,467,779 5,103,348 5,875,468 6,476,104 Total Waste to Landfill 1,033,121 1,339,314 2,182,607 2,460,497 2,800,881 Total Waste Recycled 1,515,331 2,128,466 2,920,740 3,414,971 3,675,223 Waste Diversion (% recycled) 59% 61% 57% 58% 57% Enterprise-wide Food Donations to Local Communities 78 451 2,092 — — (diversion from landfill) Enterprise-wide E-waste 108,218 89,732 36,944 152,989 247,128 Water (kgals)3 2021 2020 2019 2018 2017 Total Water Consumption 28,153 38,087 54,288 61,666 65,706 Water Intensity (kgals per FTE) 3.05 3.60 4.73 4.78 5.76 Water Intensity (kgals per sq. ft.) 0.01 0.01 0.01 0.0144 0.018 1. TO ENSURE THAT METLIFE IS PROVIDING MEANINGFUL AND CONSISTENT COMPARISON OF DATA OVER TIME, ADJUSTMENTS TO PREVIOUS REPORTED TOTALS OF ENERGY AND EMISSIONS OCCURRED AS A RESULT OF METLIFE’S BRIGHTHOUSE FINANCIAL SPIN-OFF IN ACCORDANCE WITH THE GREENHOUSE GAS PROTOCOL CORPORATE ACCOUNTING AND REPORTING STANDARD. 2. DUE TO METRICS AVAILABILITY, WASTE DIVERSION INCLUDES THE FOLLOWING OFFICES: AURORA, BRIDGEWATER, CONVENT STATION, DAYTON, JOHNSTOWN, NEW YORK, ORISKANY, SCRANTON, TAMPA, TROY, WARWICK AND WHIPPANY. TOTAL WEIGHT RECYCLED, REUSED AND RESOLD FOR SITES LISTED ABOVE, AND ENTERPRISE-WIDE INCLUDES OTHER SITES (WHERE DATA IS AVAILABLE). 3. DUE TO METRICS AVAILABILITY, WATER DATA INCLUDES THE FOLLOWING OFFICES: AURORA, BRIDGEWATER, CONVENT STATION, CARY, DAYTON, JOHNSTOWN, NEW YORK, ORISKANY, SCRANTON, ST. LOUIS, TAMPA, TROY, WARWICK AND WHIPPANY. 2021 SUSTAINABILITY REPORT 143
Sustainability For Our For Our Creating Value For the For Our Managing Appendix at MetLife Workforce Customers as an Investor Environment Communities Responsibly ESG Scorecard 1 Environmental Data 2021 Scope 1 Emissions (Metric Tons CO2e) Fuel Oil Natural Gas Transport Fuel CO2 Domestic 83 4,944 304 International 604 1,704 2,047 Total 687 6,648 2,350 CH4 Domestic 0.041 2.329 0.015 International 0.471 0.803 0.091 Total 0.513 3.132 0.106 N2O Domestic 0.09 2.78 0.003 International 1.08 0.96 0.018 Total 1.18 3.73 0.021 Energy Consumption by Type (MWh) 2021 Electricity 133,995 Fuel (fuel oil, natural gas, transport fuel, district heat and cooling) 50,025 Total Energy Consumption 184,020 1. TO ENSURE THAT METLIFE IS PROVIDING MEANINGFUL AND CONSISTENT COMPARISON OF DATA OVER TIME, ADJUSTMENTS TO PREVIOUS REPORTED TOTALS OF ENERGY AND EMISSIONS OCCURRED AS A RESULT OF METLIFE’S BRIGHTHOUSE FINANCIAL SPIN-OFF IN ACCORDANCE WITH THE GREENHOUSE GAS PROTOCOL CORPORATE ACCOUNTING AND REPORTING STANDARD. 2021 SUSTAINABILITY REPORT 144
Sustainability For Our For Our Creating Value For the For Our Managing Appendix at MetLife Workforce Customers as an Investor Environment Communities Responsibly ESG Scorecard Community Data MetLife Foundation Grants ($ in millions) 2021 2020 2019 2018 2017 Financial Inclusion $ 14.25 $ 17.06 $ 30.84 $ 28.94 $ 30.20 Health and Medical Research $ 1.99 $ 1.80 $ 0.50 $ 0.79 $ 0.89 Arts and Culture $ 0.52 $ 0.80 $ 1.22 $ 1.20 $ 1.34 Disaster Relief $ 0.10 $ 0.61 $ 0.09 $ 0.27 $ 0.64 Youth/Education $ 0.47 $ 0.26 $ 0.35 $ 0.63 $ 0.96 Community Improvement $ 7.15 $ 13.04 $ 2.03 $ 1.86 $ 1.82 Diversity and Inclusion $ 3.39 $ 3.56 $ 2.40 $ 1.53 $ 1.28 Employee Involvement $ 2.47 $ 2.37 $ 2.51 $ 2.68 $ 2.75 Total $ 30.34 $ 39.50 $ 39.94 $ 37.90 $ 39.88 MetLife Contributions by Source ($ in millions) 2021 2020 2019 2018 2017 MetLife Foundation $ 30.34 $ 39.50 $ 39.94 $ 37.90 $ 39.88 Mexico and Korea Foundations $ 1.43 $ 4.15 $ 2.02 $ 1.90 $ 1.36 Corporate $ 2.03 $ 2.86 $ 3.37 $ 4.58 $ 3.65 Total $ 33.80 $ 46.51 $ 45.33 $ 44.38 $ 44.89 2021 SUSTAINABILITY REPORT 145
Sustainability For Our For Our Creating Value For the For Our Managing Appendix at MetLife Workforce Customers as an Investor Environment Communities Responsibly ESG Scorecard Community Data # of Employee Volunteering Volunteers Total Hours Volunteering by Region United States/Canada 5,677 17,627 Latin America 2,049 6,172 Asia 14,789 27,341 EMEA 2,935 10,703 Total 25,450 61,843 Innovation Management 2021 2020 2019 2018 Dollar Amount (in thousands) Invested in Product Development/Innovation To be reported $ 301,014 $ 329,876 $ 409,724 after Q4 1 Number of Associates Participating in Innovation Activities 3,751 27,000+ 5,000+ N/A 2 Number of Startups Engaged 203 323 295 264 Contracts with Startups that Have Been Fully Executed 14 19 10 10 3 Number of Innovation Challenges Run 10 32 24 16 4 Number of Experiments Launched 23 33 43 28 1. THIS INCLUDES CROWDSOURCING AND FACILITATED PROGRAMS, CO-INNOVATION PROGRAMMING, MIT VISITS, THE METLIFE DIGITAL ACCELERATOR PROGRAM, COLLAB EVENTS, ETC. 2. ST ARTUPS METLIFE HAS CONNECTED OR STARTED WORKING WITH TO DETERMINE WHETHER THEIR OFFERINGS/CAPABILITIES CAN PROVIDE VALUE TO THE COMPANY AND OUR CUSTOMERS. 3. THIS INCLUDES IDEATION EVENTS LEVERAGING INNOVATION TECHNIQUES AND TOOLS TO SOLVE BUSINESS CHALLENGES. 4. PROOF OF CONCEPT OR PILOT EXPERIMENTS THAT HAVE LAUNCHED WITH STARTUPS TO EVALUATE A NEW USE CASE. THIS DOES NOT MEAN THAT THE EXPERIMENT WAS COMPLETED. 2021 SUSTAINABILITY REPORT 146
Sustainability For Our For Our Creating Value For the For Our Managing Appendix at MetLife Workforce Customers as an Investor Environment Communities Responsibly ESG Scorecard Supply Chain Management 2021 2020 2019 2018 1 Total Diverse Business Partner Spend (in millions) $188 $203 $352 $370 2 Percentage of Suppliers Covered by a Supply Chain Code of Conduct 100% 100% N/A N/A Privacy Protection/Information Security Number of Complaints Concerning Breaches of Customer Privacy Received from Outside MetLife follows applicable U.S. and global laws regarding reporting Parties and Substantiated by MetLife breaches of personal information, including providing notices to individuals and regulators. Various laws and regulatory regimes may use different standards for defining “breaches” and other information disclosure incidents, so reporting a single metric for this is open to misinterpretation. Risk Management 2021 2020 2019 2018 Percent of Employees Participating in Code of Business Ethics Training 98% 99% 98% 98% 1. IN 2018, THE SPEND BASIS TO DERIVE PERCENTAGE OF DIVERSE SPEND WAS REVISED TO REFLECT THE REMOVAL OF SPEND ADMINISTERED BY A MANAGED SERVICE PROVIDER. 2. METLIFE’S SUPPLIER CODE OF BUSINESS CONDUCT WAS PUBLISHED IN 2020 AND IS AVAILABLE ON THE EXTERNAL METLIFE GLOBAL PROCUREMENT WEBSITE. THE CODE REFERS TO ANY THIRD PARTY AND ITS PERSONNEL, INCLUDING SUBCONTRACTORS PROVIDING GOODS, SERVICES, AND/OR DELIVERABLES TO METLIFE. METLIFE DOES NOT REQUIRE SUPPLIERS TO PERFORM ATTESTATION. 2021 SUSTAINABILITY REPORT 147
Sustainability For Our For Our Creating Value For the For Our Managing Appendix at MetLife Workforce Customers as an Investor Environment Communities Responsibly Forward-Looking Statements This report may contain or incorporate by reference These factors include: (15) investment sales or lending difficulties; information that includes or is based upon forward- (1) economic condition difficulties, including (16) collateral or derivative-related payments; looking statements within the meaning of the risks relating to public health, interest rates, (17) investment valuations, allowances, or Private Securities Litigation Reform Act of 1995. credit spreads, equity, real estate, obligors impairments changes; Forward-looking statements give expectations or and counterparties, currency exchange rates, forecasts of future events and do not relate strictly derivatives, and terrorism and security; (18) claims or other results that differ from our to historical or current facts. They use words and estimates, assumptions or models; terms such as “anticipate,” “assume,” “believe,” (2) global capital and credit market adversity; (19) global political, legal or operational risks; “continue,” “could,” “estimate,” “expect,” “if,” “intend,” (3) credit facility inaccessibility; (20) business competition; “likely,” “may,” “plan,” “potential,” “project,” “should,” (4) financial strength or credit ratings downgrades; “will,” “would” and other words and terms of similar (21) technological changes; meaning or that are otherwise tied to future periods (5) unavailability, unaffordability or (22) catastrophes; or future performance, in each case in all derivative inadequate reinsurance; forms. They include statements relating to future (6) statutory life insurance reserve financing (23) climate changes or responses to it; actions, prospective services or products, future costs or limited market capacity; (24) deficiencies in our closed block; performance or results of current and anticipated (7) legal, regulatory, and supervisory and (25) goodwill or other asset impairment, or services or products, future sales efforts, future enforcement policy changes; deferred income tax asset allowance; expenses, the outcome of contingencies such as (8) changes in tax rates, tax laws or interpretations; (26) acceleration of amortization of deferred legal proceedings, and future trends in operations policy acquisition costs, deferred sales and financial results. (9) litigation and regulatory investigations; inducements, value of business acquired, Many factors determine company results, and (10) London Interbank Offered Rate value of distribution agreements acquired or they involve unpredictable risks and uncertainties. discontinuation and transition to alternative value of customer relationships acquired; Our forward-looking statements depend on reference rates; (27) pr oduct guarantee volatility, costs and our assumptions, our expectations and our (11) unsuccessful efforts to meet all environmental, counterparty risks; understanding of the economic environment, but social and governance standards or to (28) risk management failures; they may be inaccurate and may change. We do enhance our sustainability; not guarantee any future performance. Our results (12) MetLife, Inc.’s inability to pay dividends and (29) insufficient protection from operational risks; could differ materially from those we express or repurchase common stock; (30) failure to protect confidentiality and integrity imply in forward-looking statements. The risks, (13) MetLife, Inc.’s subsidiaries’ inability to pay of data or other cybersecurity or disaster uncertainties and other factors, including those it dividends; recovery failures; relating to the COVID-19 pandemic, identified in (31) accounting standards changes; MetLife, Inc.’s filings with the U.S. Securities and (14) investment defaults, downgrades or volatility; Exchange Commission, and others, may cause such differences. 2021 SUSTAINABILITY REPORT 148
Sustainability For Our For Our Creating Value For the For Our Managing Appendix at MetLife Workforce Customers as an Investor Environment Communities Responsibly (32) excessive risk-taking; Explanatory Note (33) marketing and distribution difficulties; The following information is relevant to an Accordingly, the underlying investments within (34) pension and other postretirement benefit understanding of our assets under management certain real estate and real estate joint ventures assumption changes; (AUM). Our definitions may differ from those used that are primarily commercial mortgage loans (at (35) inability to protect our intellectual property by other companies. net asset value, net of deduction for encumbering or avoid infringement claims; debt) have been reclassified to exclude them from (36) acquisition, integration, growth, disposition Total Assets Under Management real estate equity and include them as commercial or reorganization difficulties; (Total AUM) is comprised of GA AUM plus mortgage loans. (37) Brighthouse Financial, Inc. separation risks; Institutional Client AUM (each, as defined below). Institutional Client AUM is comprised of SA (38) MetLife, Inc.’s Board of Directors influence General Account AUM (GA AUM) is used by AUM plus TP AUM (each, as defined below). over the outcome of stockholder votes MetLife to describe assets in its general account MetLife Investment Management manages through the voting provisions of the MetLife (GA) investment portfolio that are actively managed Institutional Client AUM in accordance with Policyholder Trust; and and stated at estimated fair value. GA AUM is client guidelines contained in each investment (39) legal- and corporate governance-related comprised of the GA total investments, the portion contract (Mandates). effects on business combinations. of GA investment portfolio classified within assets MetLife, Inc. does not undertake any obligation held-for-sale, and cash and cash equivalents, Separate Account AUM (SA AUM) is comprised to publicly correct or update any forward-looking excluding policy loans, contract-holder-directed of separate account investment portfolios statement if MetLife, Inc. later becomes aware equity securities, fair value option securities and of MetLife insurance companies, which are that such statement is not likely to be achieved. certain other invested assets, as substantially all of managed by MetLife and included in MetLife, Please consult any further disclosures MetLife, Inc. these assets are not actively managed in MetLife’s Inc.’s consolidated financial statements at makes on related subjects in subsequent reports GA investment portfolio. Mortgage loans (including estimated fair value. to the U.S. Securities and Exchange Commission. commercial, agricultural and residential) and real estate and real estate joint ventures included in Third Party AUM (TP AUM) is comprised of non- Additional information about MetLife’s general GA AUM (at net asset value, net of deduction for proprietary assets managed by MetLife on behalf account investment portfolio is available in encumbering debt) have been adjusted from of unaffiliated/third party clients, which are stated MetLife, Inc.’s quarterly financial materials for the carrying value to estimated fair value. Classification at estimated fair value. Such non-proprietary quarter ended December 31, 2021, which may be of GA AUM by sector is based on the nature and assets are owned by unaffiliated/third-party accessed through MetLife’s Investor Relations web characteristics of the underlying investments, clients and, accordingly, are not included in page at https://investor.metlife.com. which can vary from how they are classified MetLife, Inc.’s consolidated financial statements. under GAAP. 2021 SUSTAINABILITY REPORT 149
Metropolitan Life Insurance Company 200 Park Avenue New York, NY 10166 L0622023602[exp0623][All States][All Territories] © 2022 MetLife Services and Solutions, LLC